.png)
In this new version 3.0.0 of GanttTable, we’re thrilled to introduce new features along with some improvements and bug fixes. In this version, users can now experience new Smart Columns, visualized Sprints/Versions in Gantt, and support all fields similar to JXL.
New Features
1. Smart Columns
In GanttTable version 3.0.0, we’re introducing Smart Columns. These are also known as calculable columns.
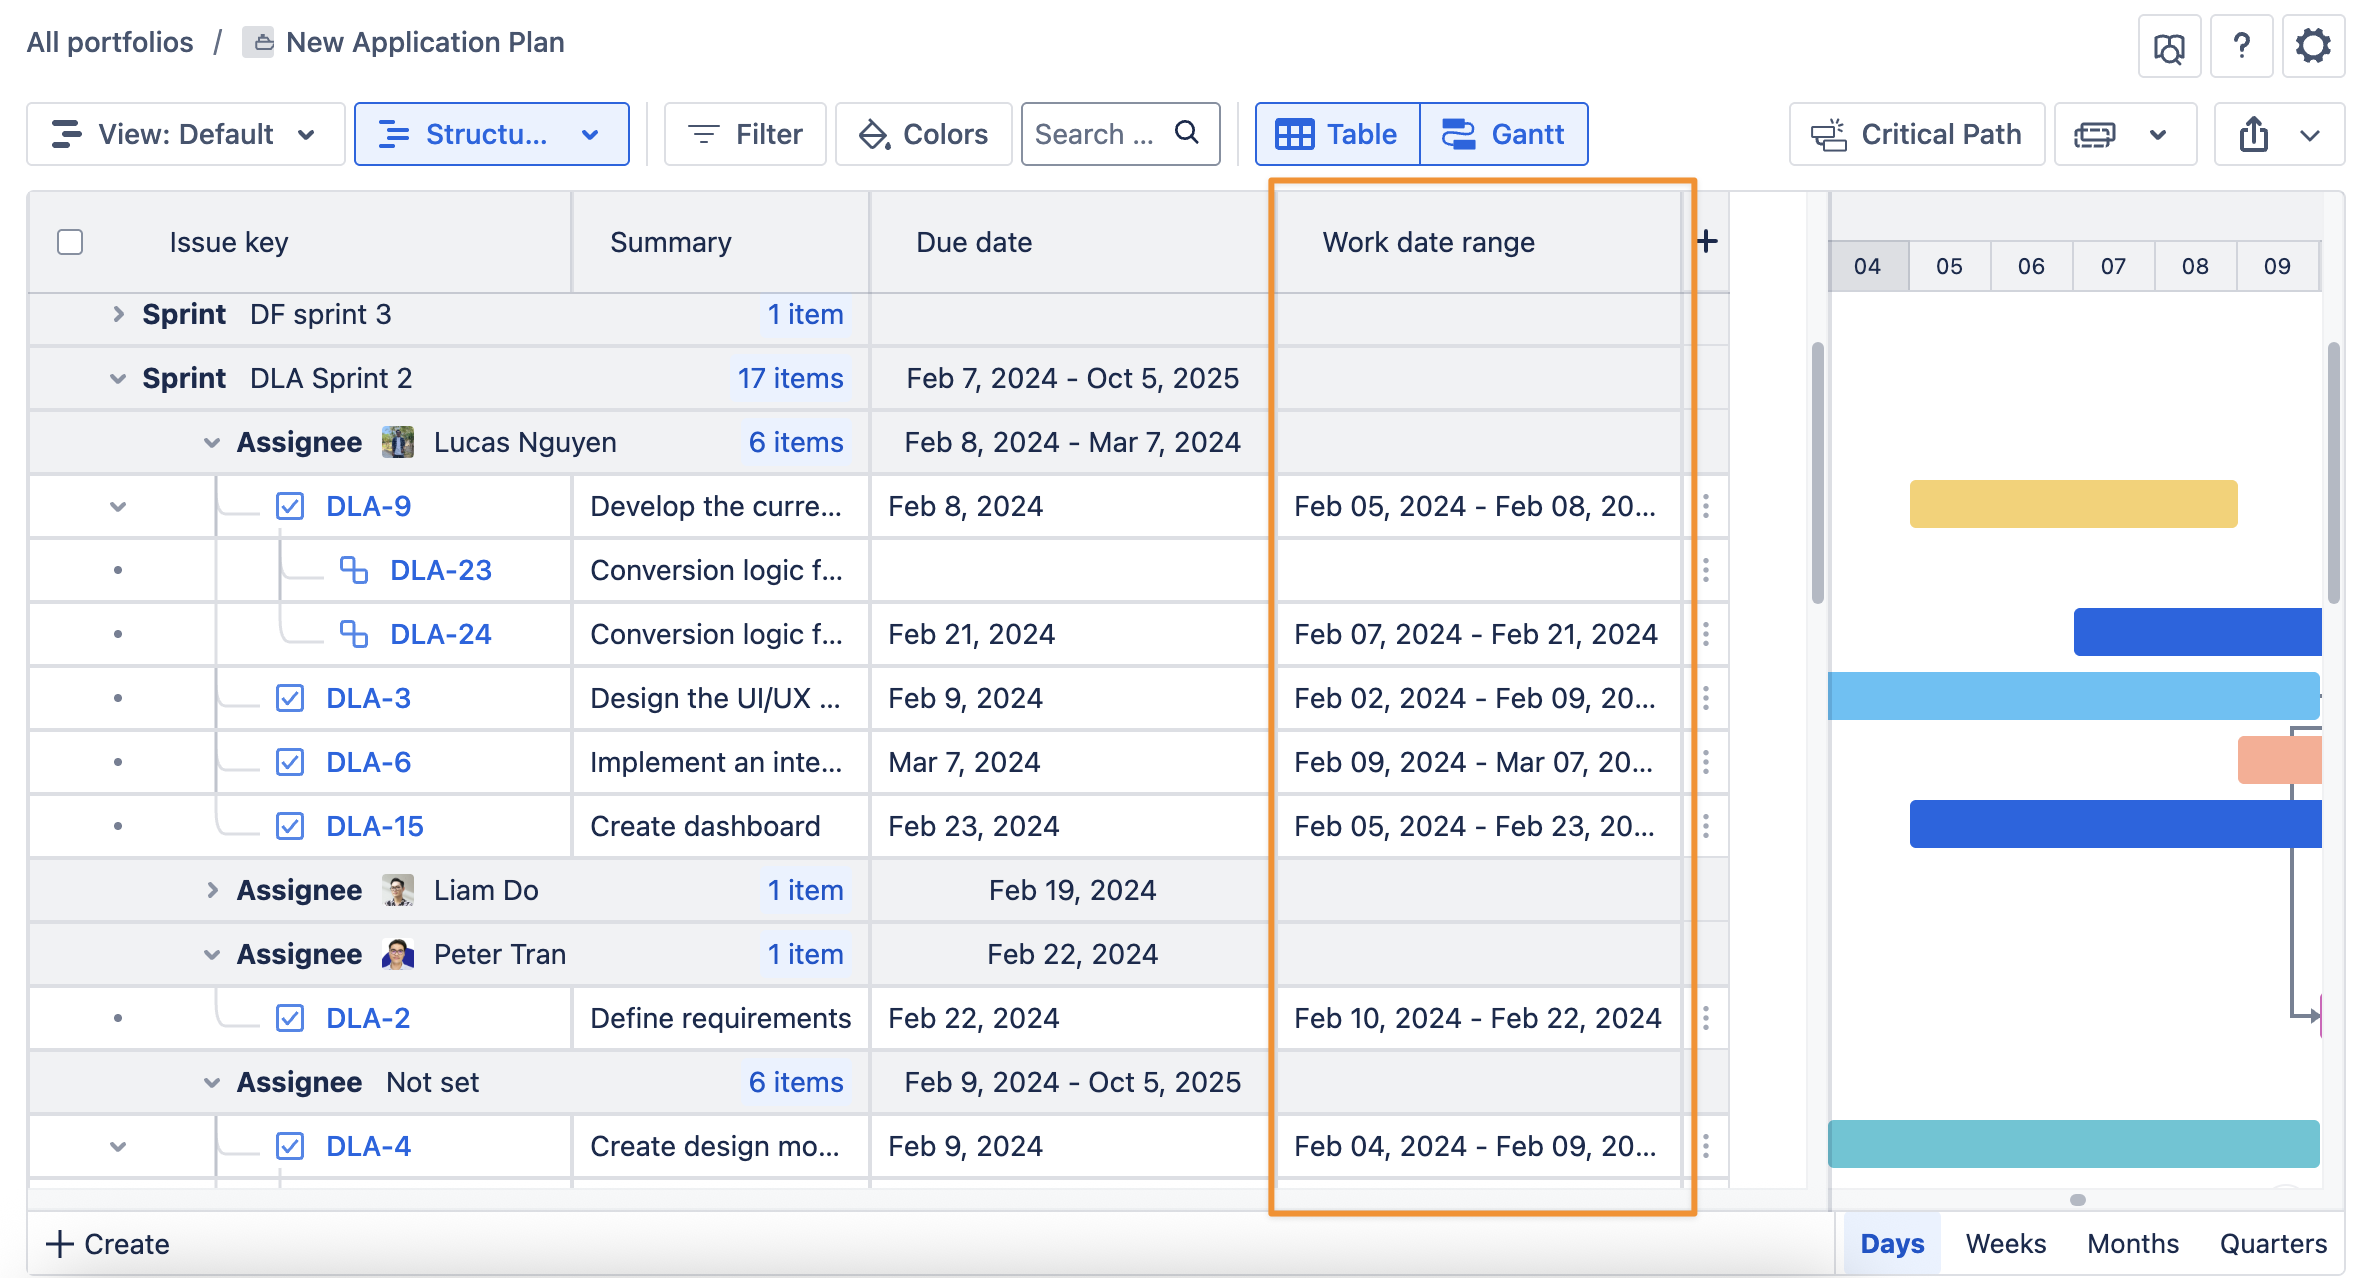
With this, you can display calculated or derived information of two Jira issue fields in the issue details.
2. Visualize Sprint/Versions in the Gantt chart
When using the Custom structure and group by Sprints or Versions, you can now visualize the sprint’s timeline or the version’s release date in the Gantt chart directly.
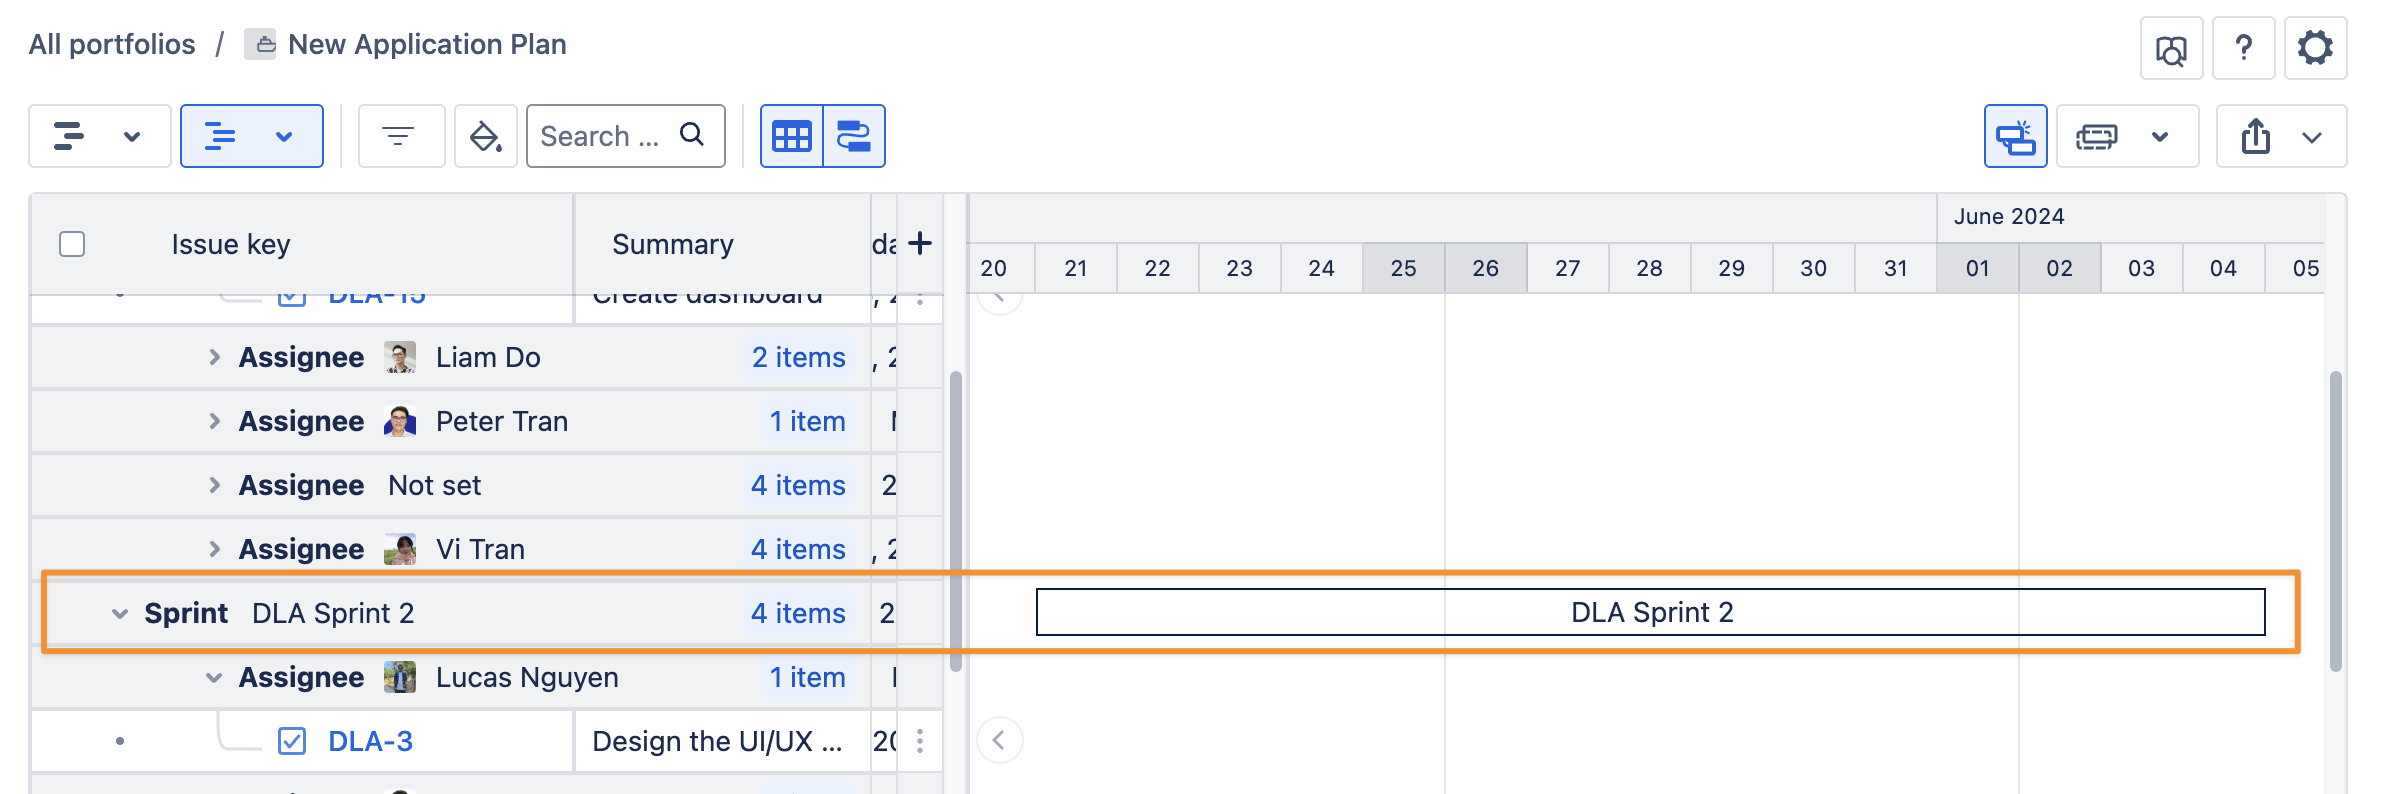
This lets users quickly check their project sprints without having to leave the app.
3. Support all fields
Also, in this version 3.0.0, GanttTable supports all fields in the advanced Excel-like table, similar to JXL.
Improvements
In this new release, we also made some UI improvements and handled cases where users can't create inline issues with some special fields.
Bug fixes
Last but not least, we fixed some known bugs to enhance the overall experience while using GanttTable:
-
Can't close "Color" box when users click continuously on 3 buttons: background, border, and text
-
Fix a layout bug for the table
-
The added project disappears after users change the project key and project name for it
-
Cannot filter by Components fields