.png)
How to open Web Console on different browsers
Chrome
Open the DevTools
Press Command+Option+J (Mac) or Control+Shift+J (Windows, Linux, Chrome OS) to jump straight into the Console panel of Chrome DevTools.
Or, navigate to More Tools > Developer Tools from Chrome menu, and click Console tab.
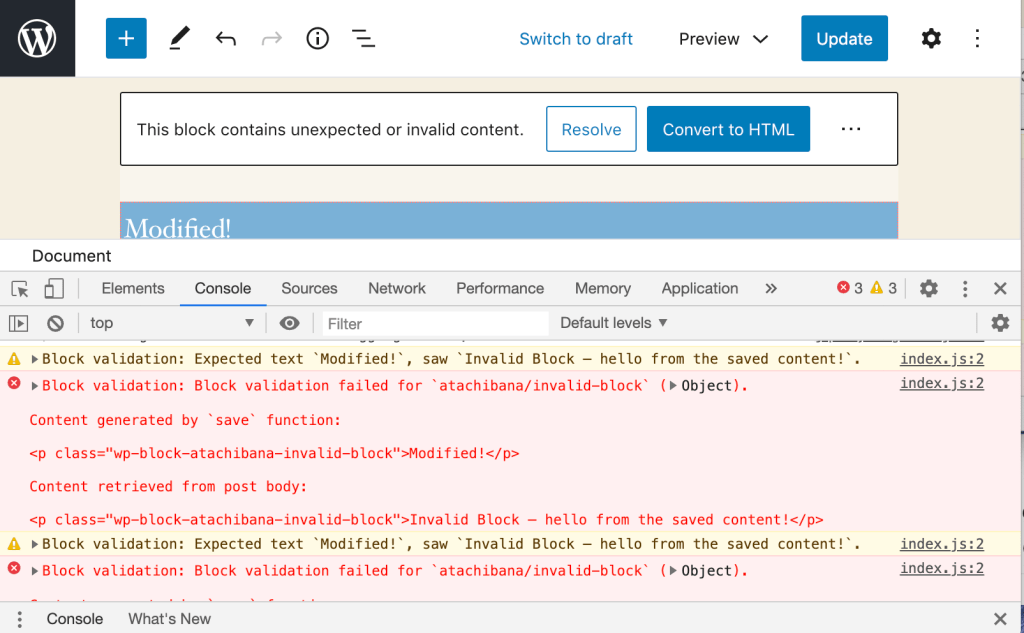
Identify the Error
The error console will open. If you don’t see any errors try reloading the page. The error may be generated when the page loads.
The console will provide you with the error type, the location of the error and the line number
Firefox
Open the Web Console
Press Command+Option+K (Mac) or Control+Shift+K (Windows) to jump straight into the Console panel of Firefox Web Console.
Or, navigate to Web Development > Web Console from Firefox menu, and click Console tab.
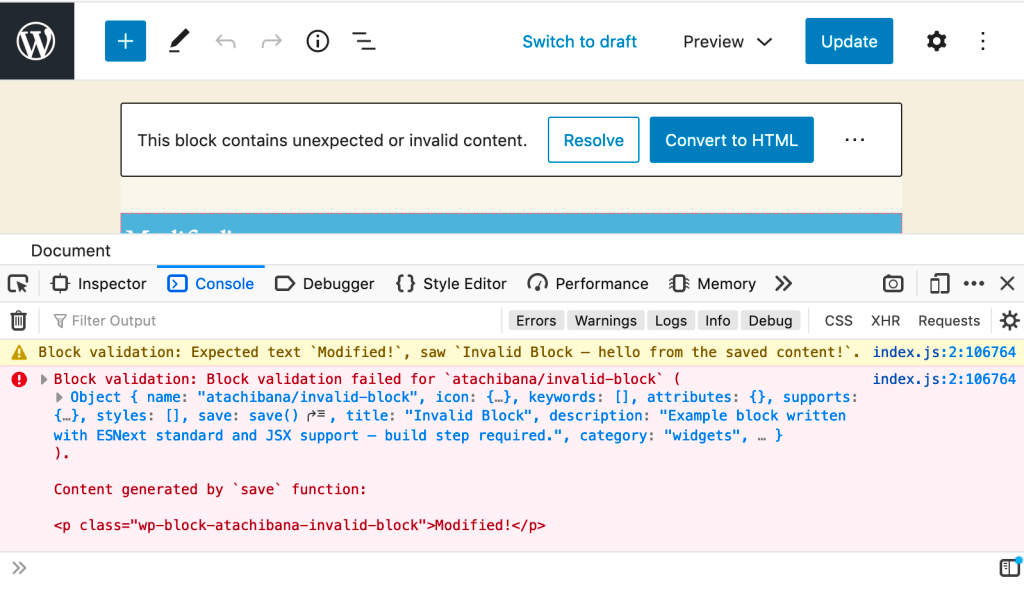
Identify the Error
The error console will open. If you don’t see any errors try reloading the page. The error may be generated when the page loads.
The console will provide you with the error type, the location of the error and the line number
Internet Explorer
Bear in mind, IE behaves vastly differently from other browsers when it comes to JS errors, and reports on them in disparate ways. The first thing to check when facing a problem in IE is if the problem only exists in IE. Also note that the debugging tools built into some IE versions are limited, and may not be available.
Open the Console
Go to the screen where you are experiencing the error. In Internet Explorer, navigate to Settings > F12 Developer Tools. Or click F12
Click on the Console tab.
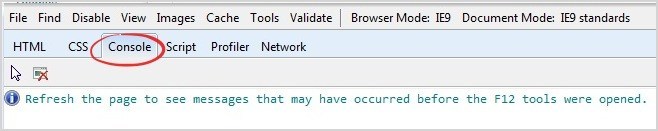
Identify the Error
The error console will open. If you don’t see any errors try reloading the page. The error may be generated when the page loads.
The console will provide you with the error type, the location of the error and the line number
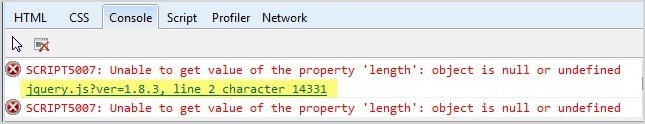
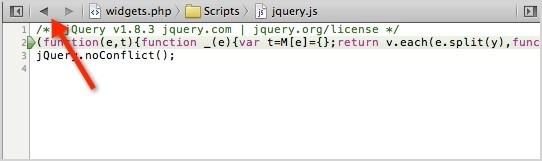
The image above shows the error to be in jquery.js on line 2.
Safari
Enable Developer Tools
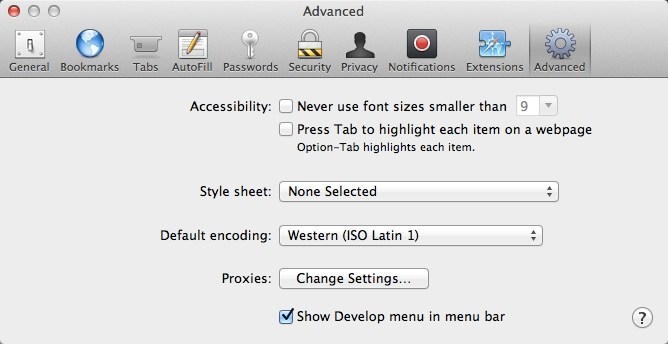
Navigate to Safari > Preferences > Advanced and check the box that says Show Develop menu in menu bar
Open the Console
Go to the screen where you are experiencing the error. In Safari, navigate to Develop > Show Error Console
Identify the Error
The error console will open. If you don’t see any errors try reloading the page.
The console show you the error, the error location and the line number:
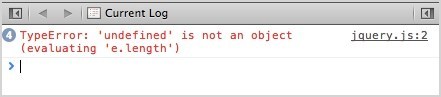
The image above shows the error to be in jquery.js on line 2.
Note: If you cannot see the error click the back button within the console.
Opera
Open the Console
Go to the screen where you are experiencing the error. In Chrome, navigate to Tools > Advanced > Error Console.
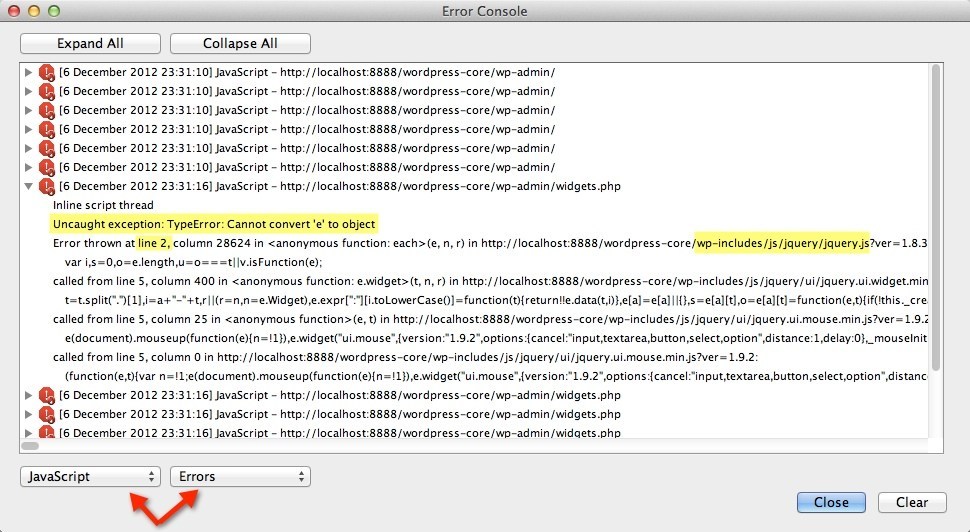
Identify the Error
The error console will open. Select JavaScript and Errors from the two drop downs. To find the error location, expand one of the errors. You’ll see the error and the location.