.png)
The Dashboard serves as a central hub for managers to monitor overall project progress, compare team performance, and evaluate key metrics such as scheduled hours, logged hours, off hours, planned Work Items, etc. With its multiple view modes, the Dashboard allows users to visualize and analyze project data in the most effective way for their needs.
Note: The board displays metrics based on the date range and member filters selected at the top of the page.
Overview view
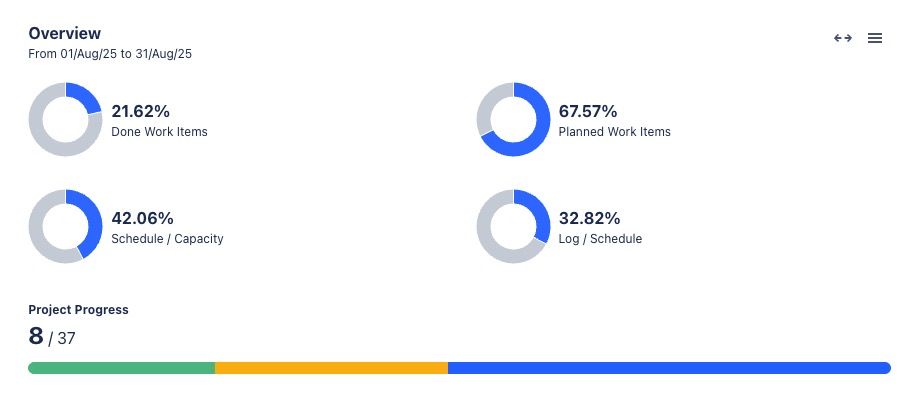
The Overview section provides a quick, visual summary of key project metrics using percentages and pie charts. This helps stakeholders quickly understand task completion, scheduled capacity, and overall project health at a glance.
Understanding metrics
|
Metric |
Description |
|---|---|
|
Done Work Items |
This metric indicates the percentage of tasks that have been resolved or completed compared to total tasks.
|
|
Planned Work Items |
This percentage shows the proportion of tasks that are planned compared to the total tasks.
|
|
Schedule / Capacity |
This metric compares the scheduled hours for tasks with the working capacity of team members. |
|
Log / Schedule |
This percentage compares the logged hours (actual hours worked) with the scheduled hours (planned hours for tasks). |
|
Project Progress bar |
The project progress bar visually represents the overall completion status of a project on the dashboard. |
Viewing chart details
Hold the pointer over the chart to show the detailed information for each metric.
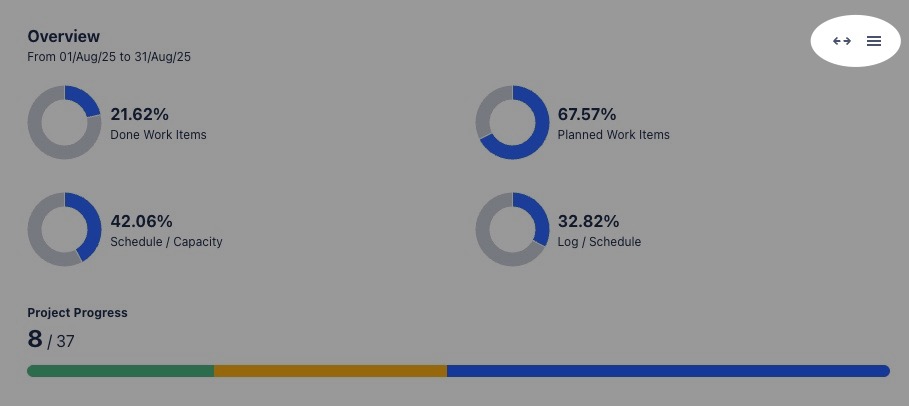
Expanding/Exporting
-
To open a view in full-screen mode, click

-
To export the Overview view to an image file, click

Statistics view
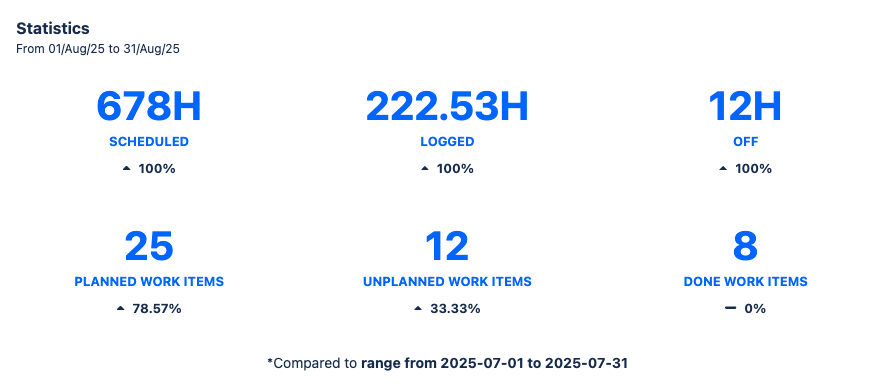
The Statistics section summarizes essential numerical data for the reporting period, including scheduled and logged hours, and the number of planned versus unplanned issues.
Understanding metrics
|
Metric |
Description |
|---|---|
|
Scheduled Hours |
The total number of hours that have been scheduled for the project. |
|
Logged Hours |
The total amount of actual hours worked on the project. |
|
Off Hours |
The total hours when the team members were not available or off work. |
|
Planned Work Items |
The total number of tasks that have been scheduled with defined start and end dates for the project. |
|
Unplanned Work Items |
The total number of tasks that were logged but were not initially scheduled with start and end dates. |
|
Done Work Items |
The total number of tasks that have been completed. |
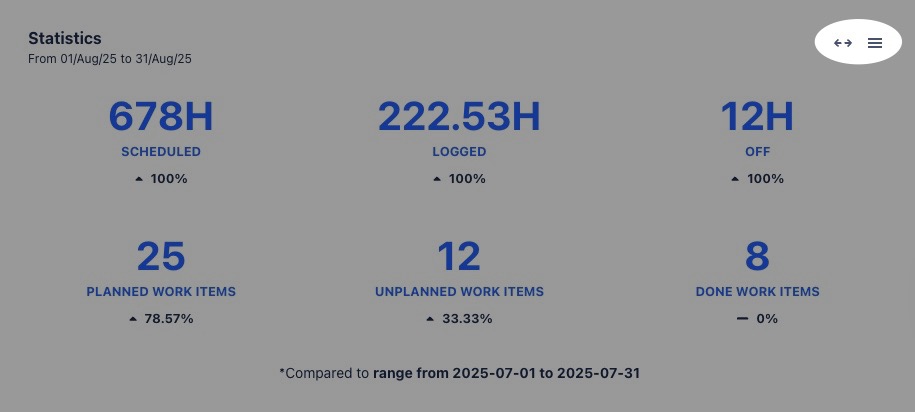
Expanding/Exporting
-
To open a view in full-screen mode, click
-
To export the Statistics view to an image file, click
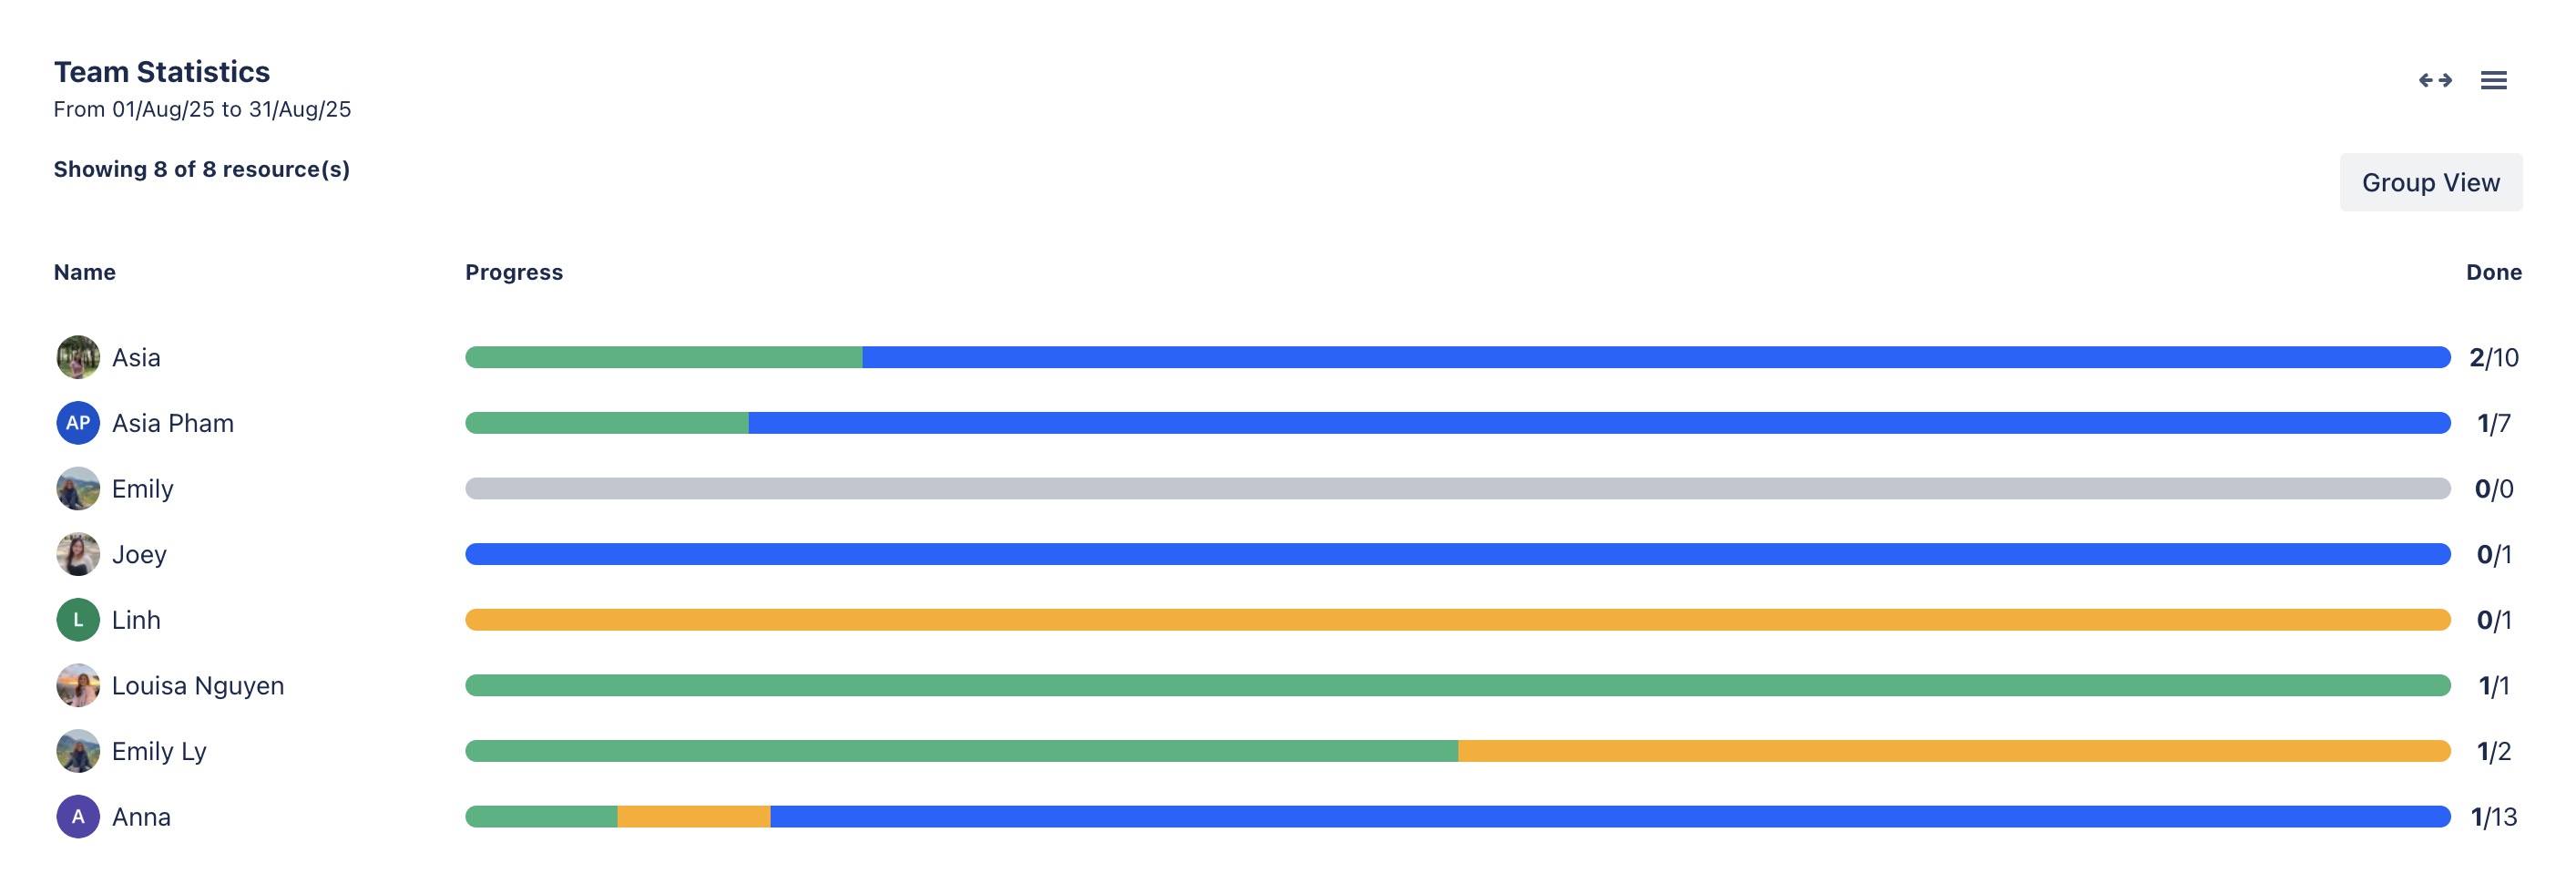
Team Statistics
The Team Statistics view provides an overview of how individual team members are progressing with their assigned tasks, using a color-coded progress bar:
-
Green: Completed tasks.
-
Orange: Tasks that are in progress.
-
Blue: Upcoming or planned tasks.
-
Grey: Tasks that have not yet been started.
Expanding/Exporting
-
To open a view in full-screen mode, click
-
To export the Statistics view to an image file, click
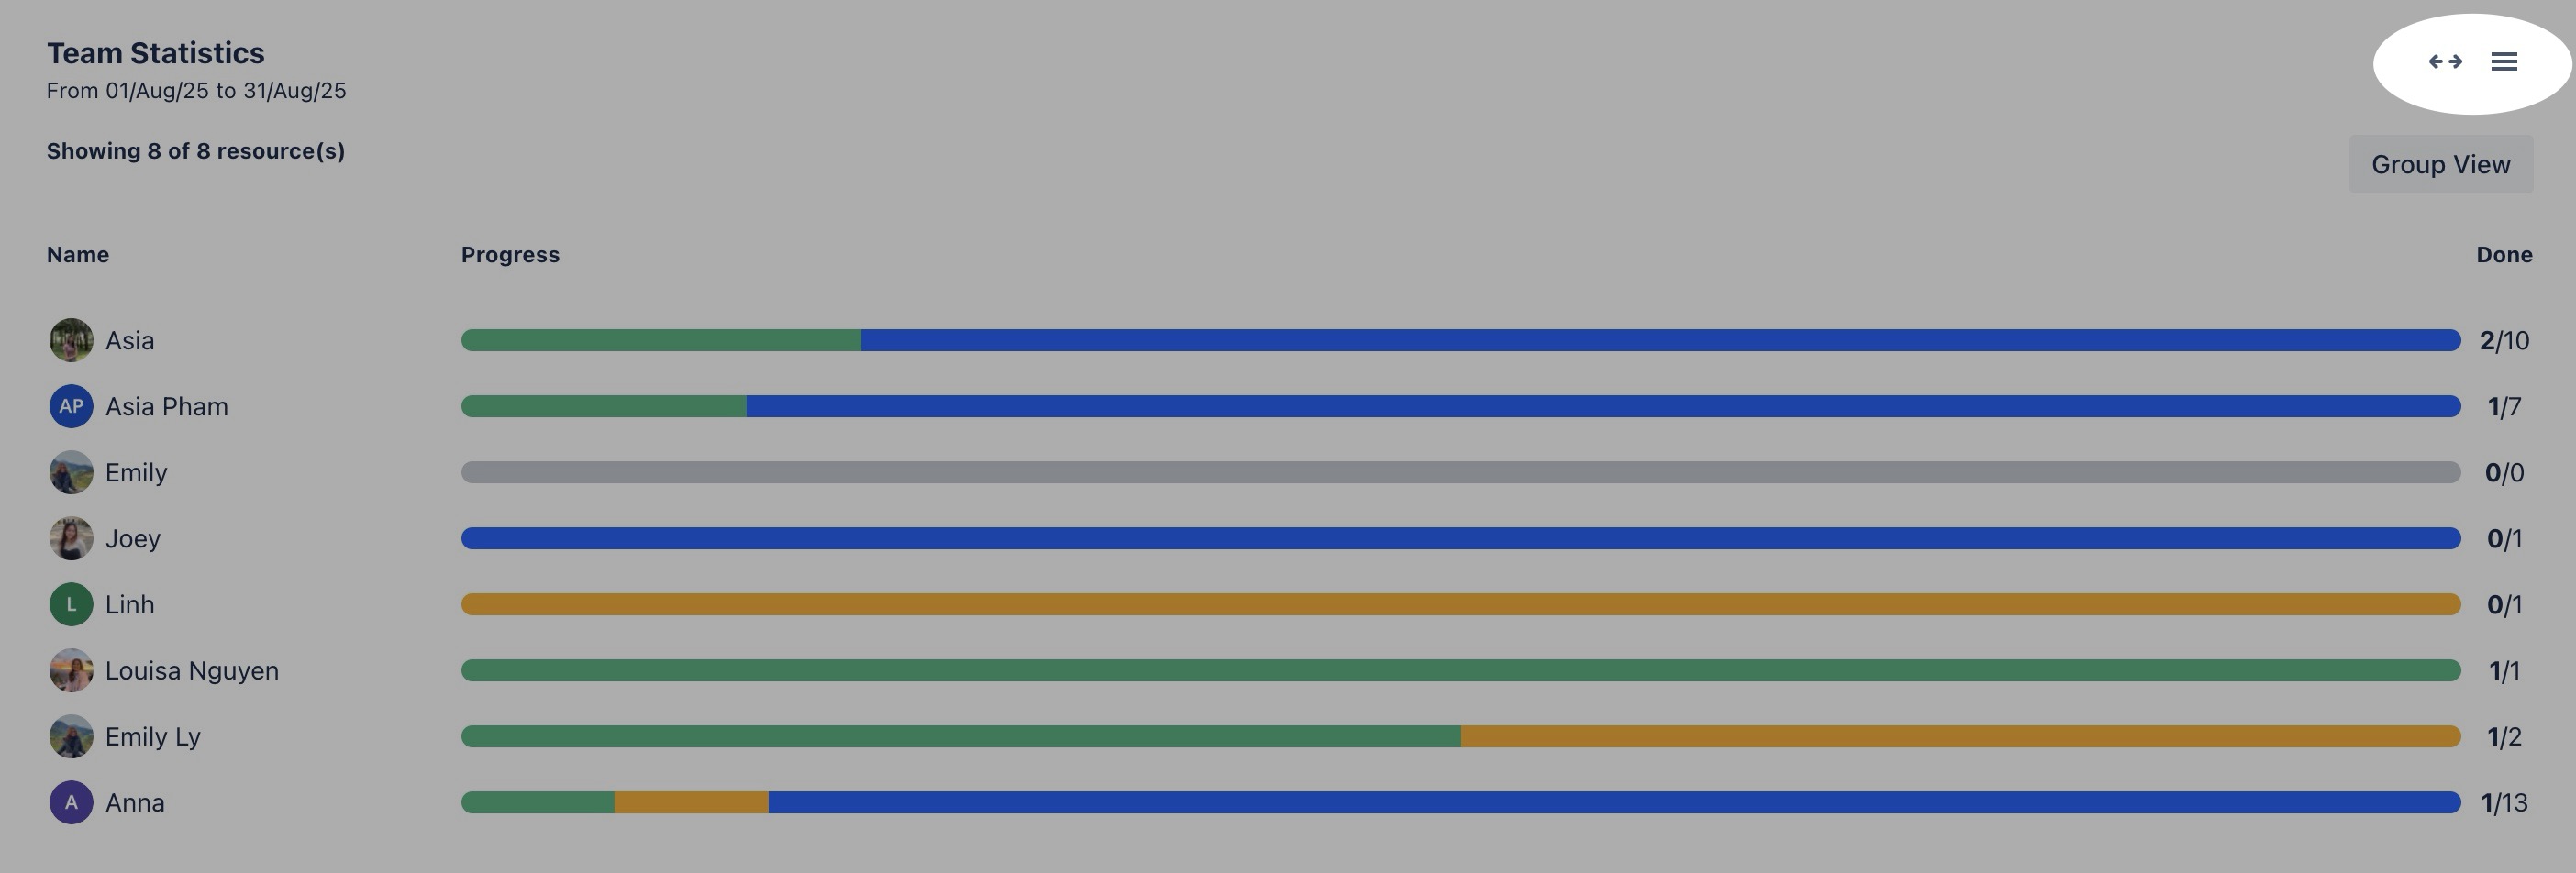
Switching View
You can switch between Member View and Group View by clicking ![]()
![]()
Viewing chart details
Hold the pointer over the chart to show the detailed information for each metric.
Report
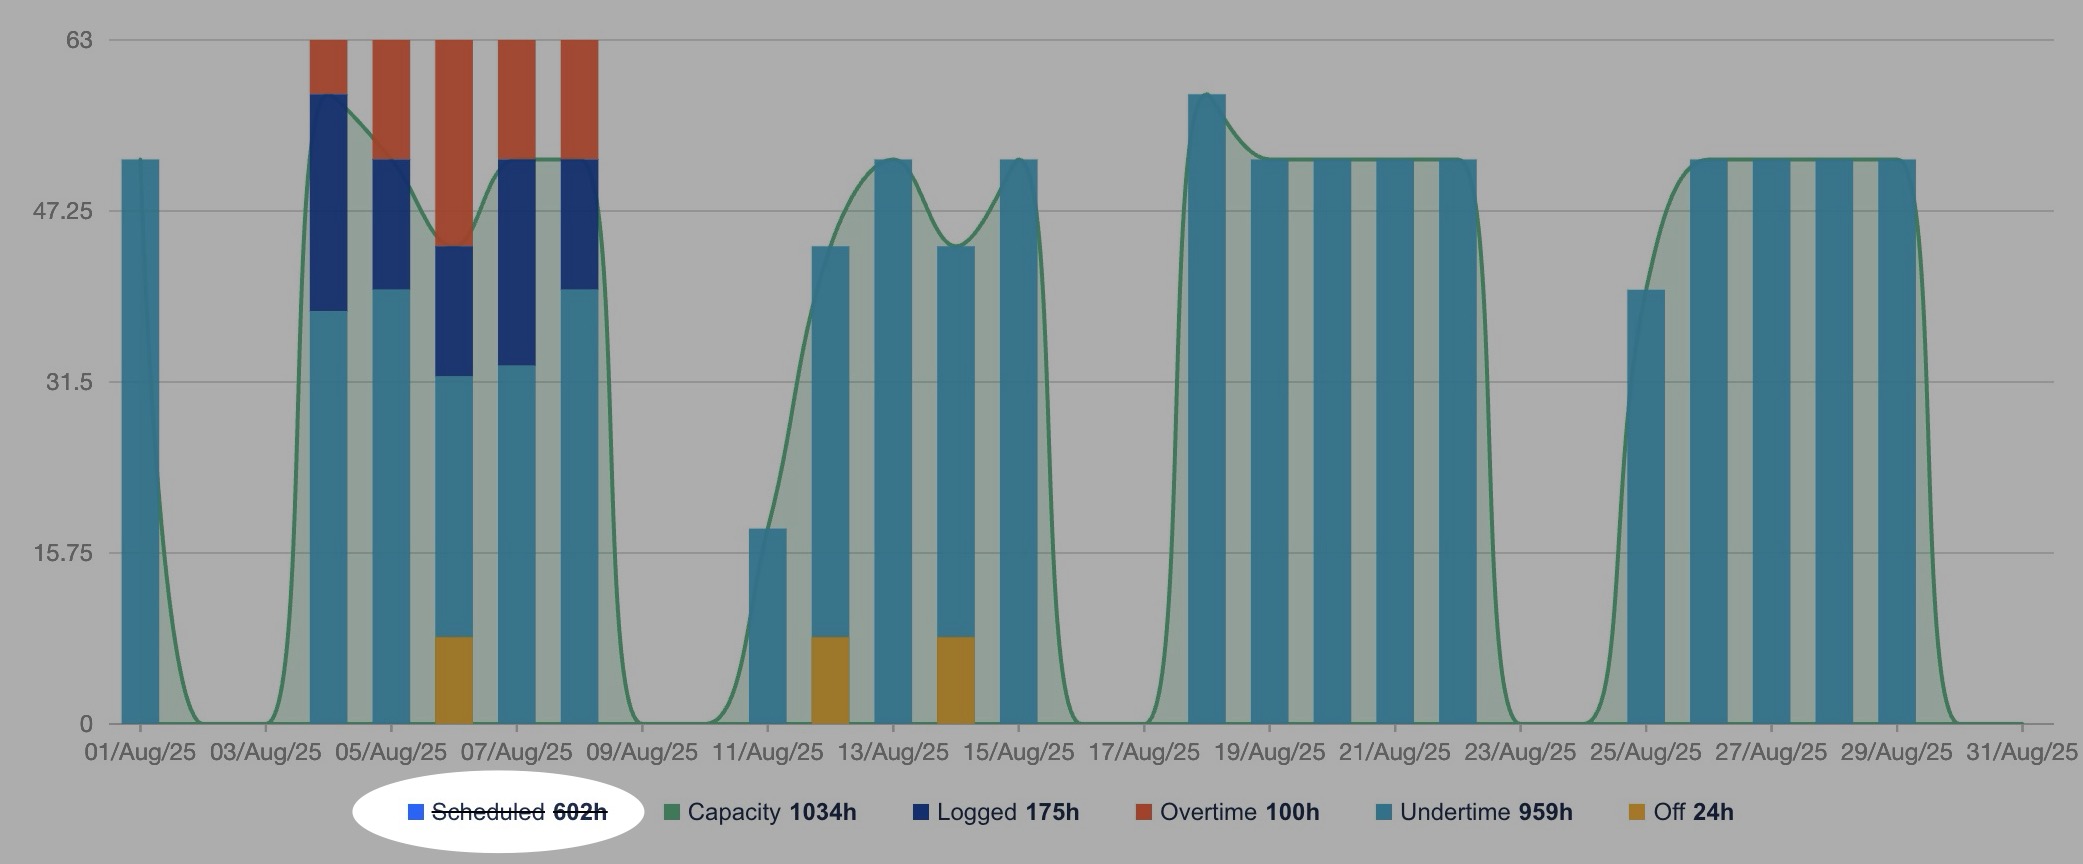
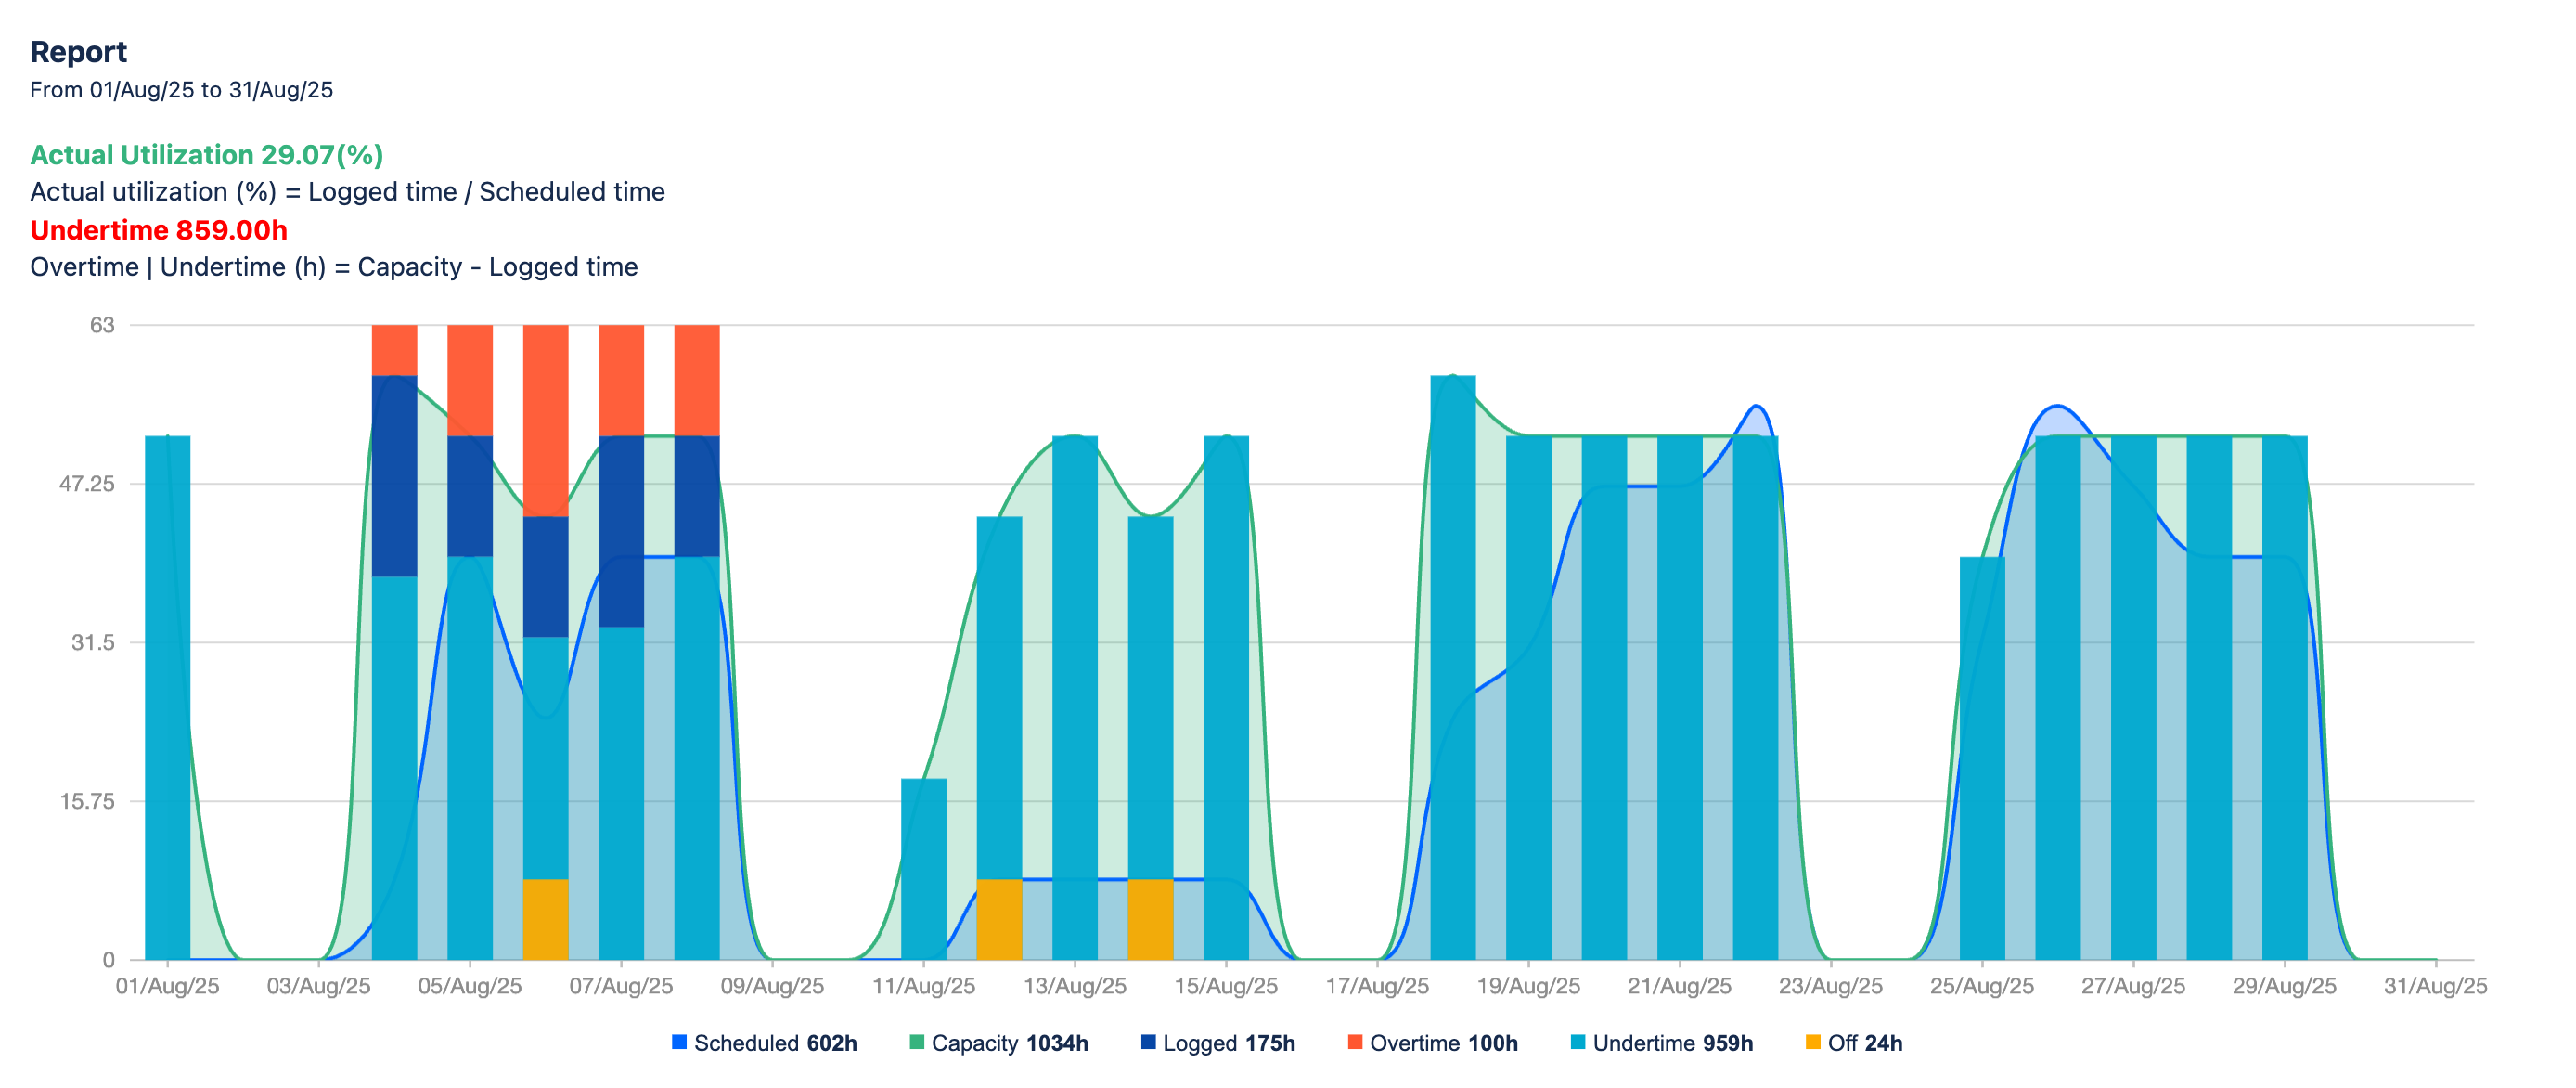
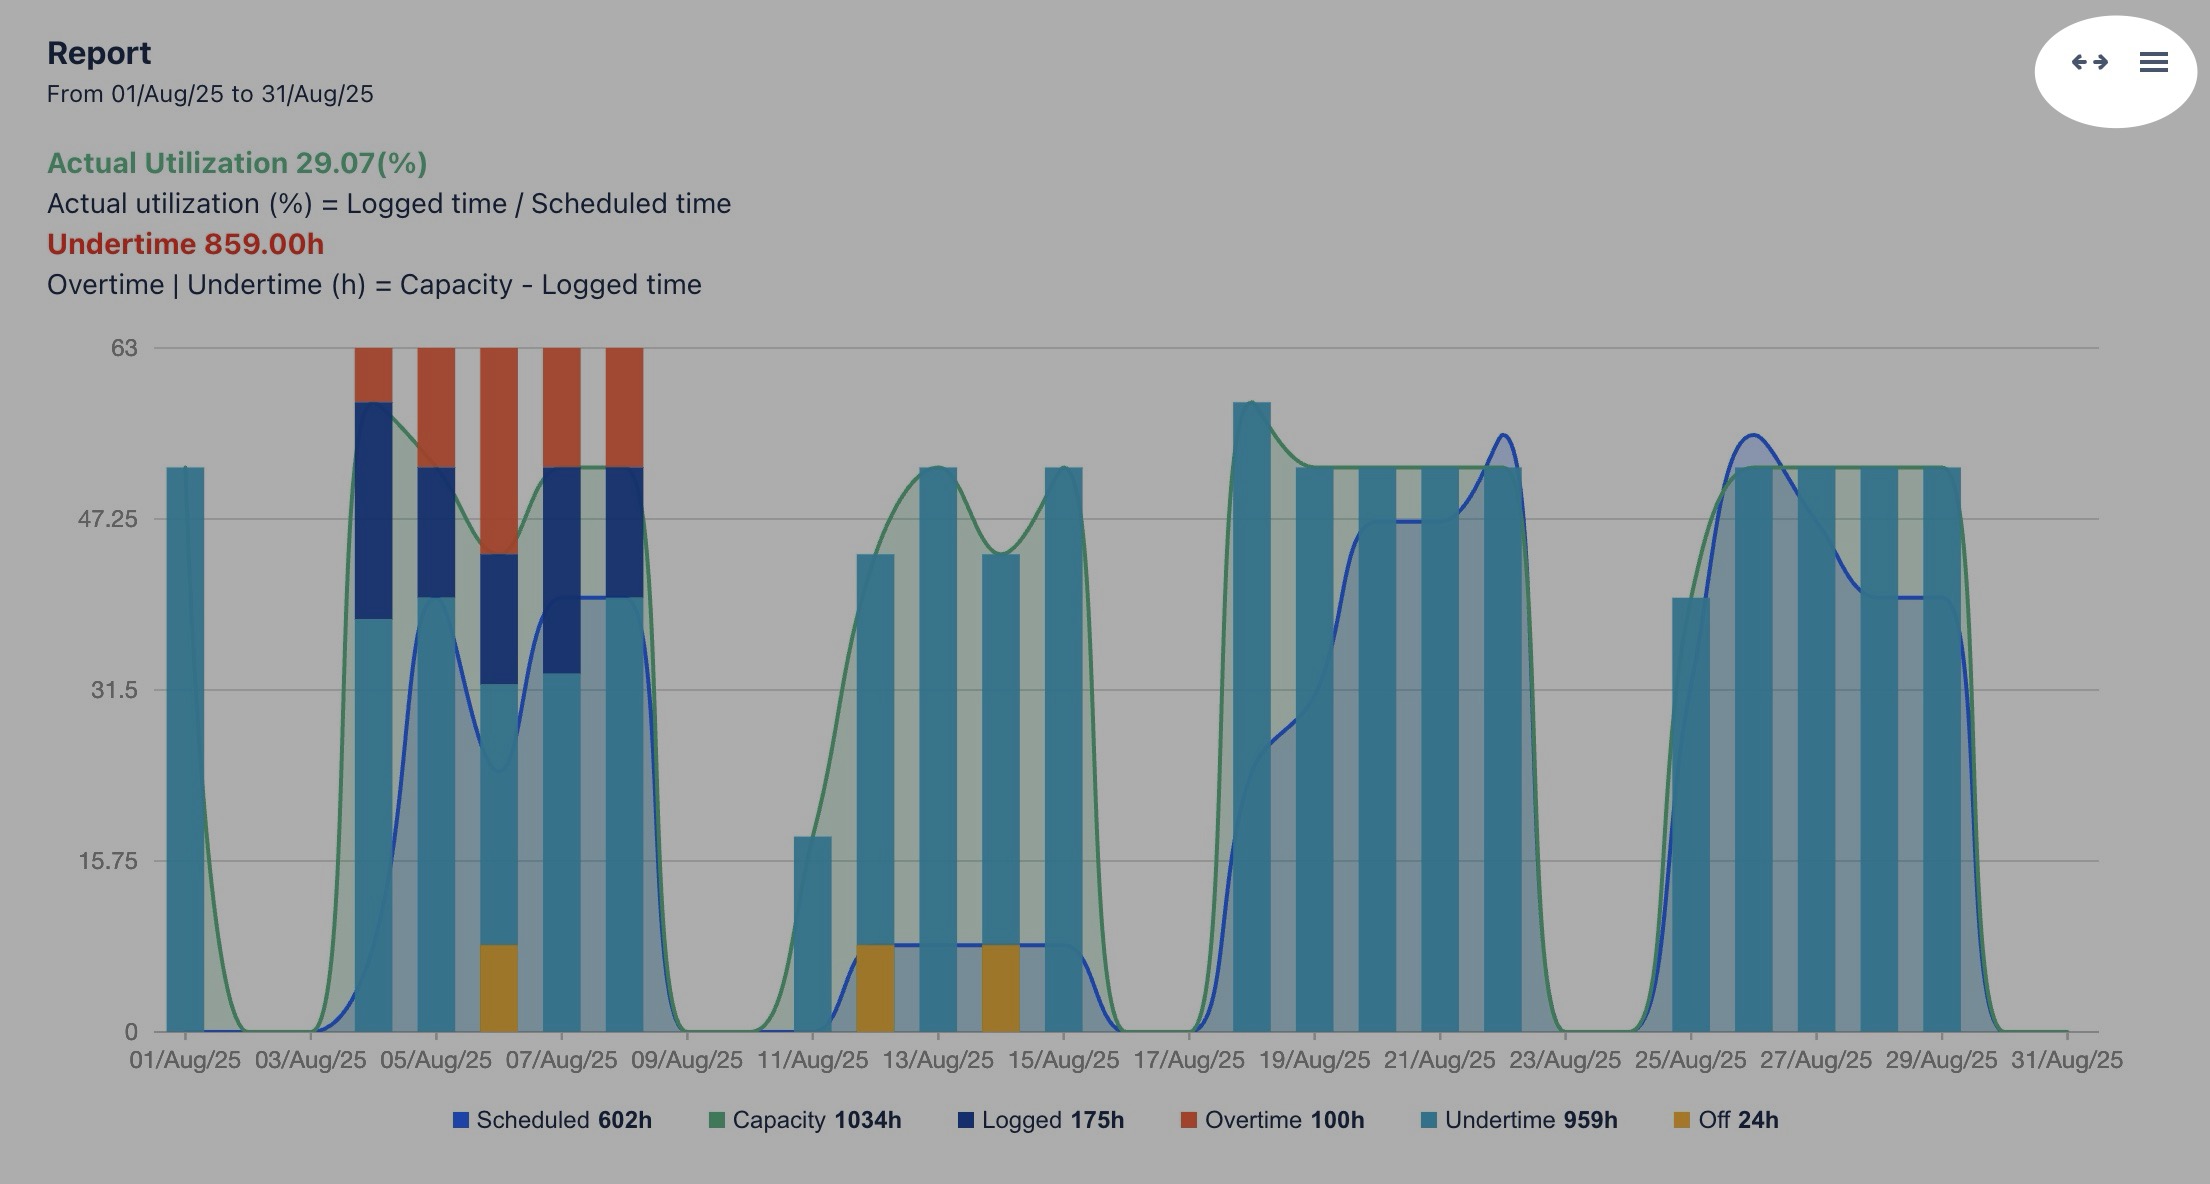
The Report view compares capacity, scheduled hours, and logged hours. This helps users quickly see how the team is performing compared to the planned schedule and available resources. It highlights overtime and undertime hours, offering a detailed view of how well the team adhered to the planned schedule.
Understanding metrics
|
Metric |
Description |
|---|---|
|
Scheduled |
Refers to the total estimated time allocated for completing all scheduled tasks across the entire project. |
|
Capacity |
This represents the total available time of resources that can be allocated across all tasks in a given period. |
|
Logged |
This shows the actual hours worked or logged by the team members. |
|
Overtime |
This represents the logged hours that are more than the capacity. |
|
Undertime |
This represents the logged hours that are less than the capacity |
|
Off |
The total hours when the team members were not available or off work. |
|
Actual utilization (%) = Logged time / Scheduled time |
This represents the percentage of actual hours worked relative to the scheduled time. |
|
Overtime | Undertime (h) = Capacity - Logged time |
If the result is positive, it represents Undertime (unused capacity). If the result is negative, it represents Overtime (extra hours worked beyond the available capacity). |
Expanding/Exporting
-
To open a view in full-screen mode, click
-
To export the Report, click
Viewing chart details
Hold the pointer over the chart to show the detailed information for each metric.
You can also disable metrics for the chart by just clicking on it: