.png)
Utilizing advanced Gantt chart features in TeamBoard ProScheduler can significantly enhance your project management capabilities within Jira. Here’s a detailed guide to help you make the most of these features:
Step-by-step Guide:
1. Setting Up Your Gantt Chart
Create a Project: Start by creating a new project or selecting an existing one. If you haven't already, create a project in Jira where you want to visualize the Gantt Chart. After installing ProScheduler, configure it according to your project needs. You may need to set up resources, task types, and other project-specific settings.
Add Tasks: Break down your project into manageable tasks. Each task should have a clear objective and include all necessary details such as task name, start date, end date, assignee, and dependencies.
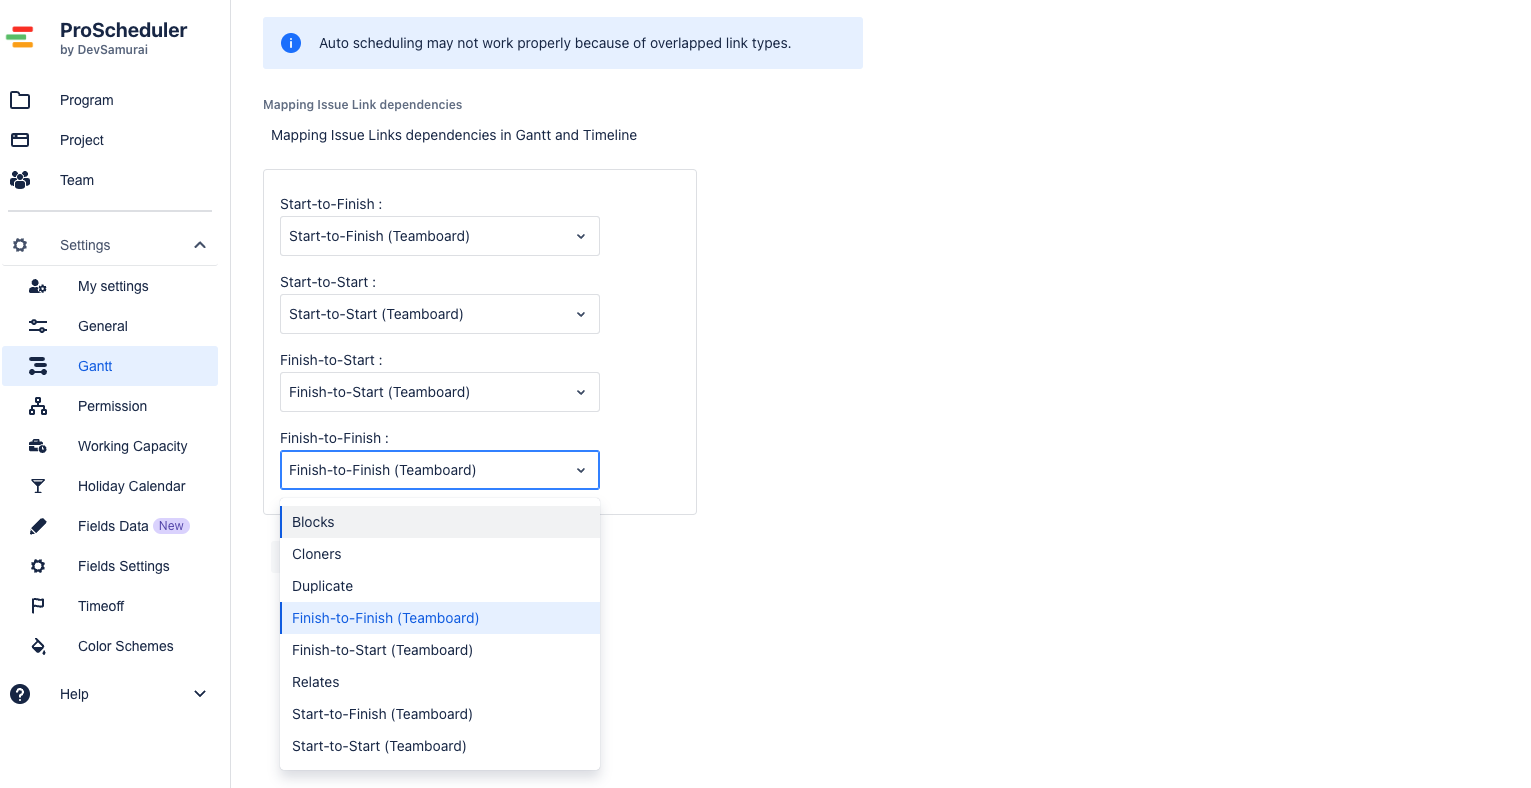
Set Dependencies: Establish relationships between tasks (e.g., finish-to-start, start-to-start) to ensure proper sequencing.
2. Advanced Scheduling Features
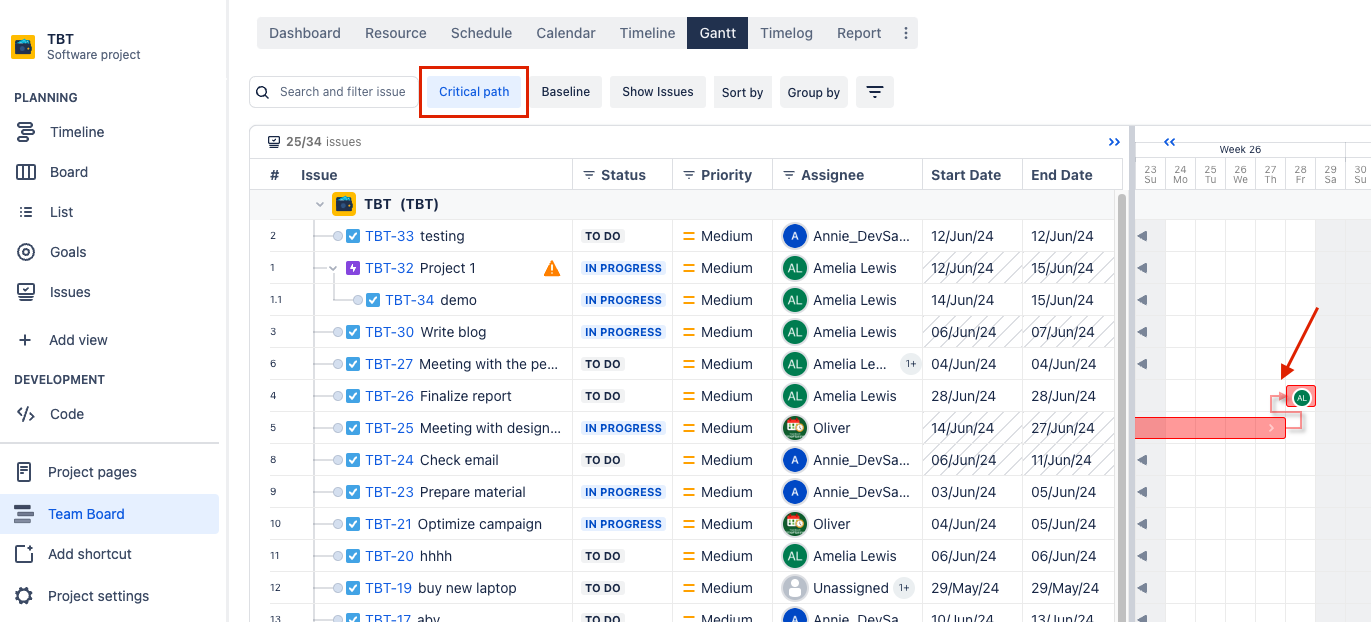
Critical Path Analysis: Identify the critical path to determine the task sequence that directly impacts the project completion date. Focus resources on these tasks to avoid delays.
Milestones: Set milestones to mark significant project events or checkpoints. This helps in tracking progress and ensuring the project stays on track.
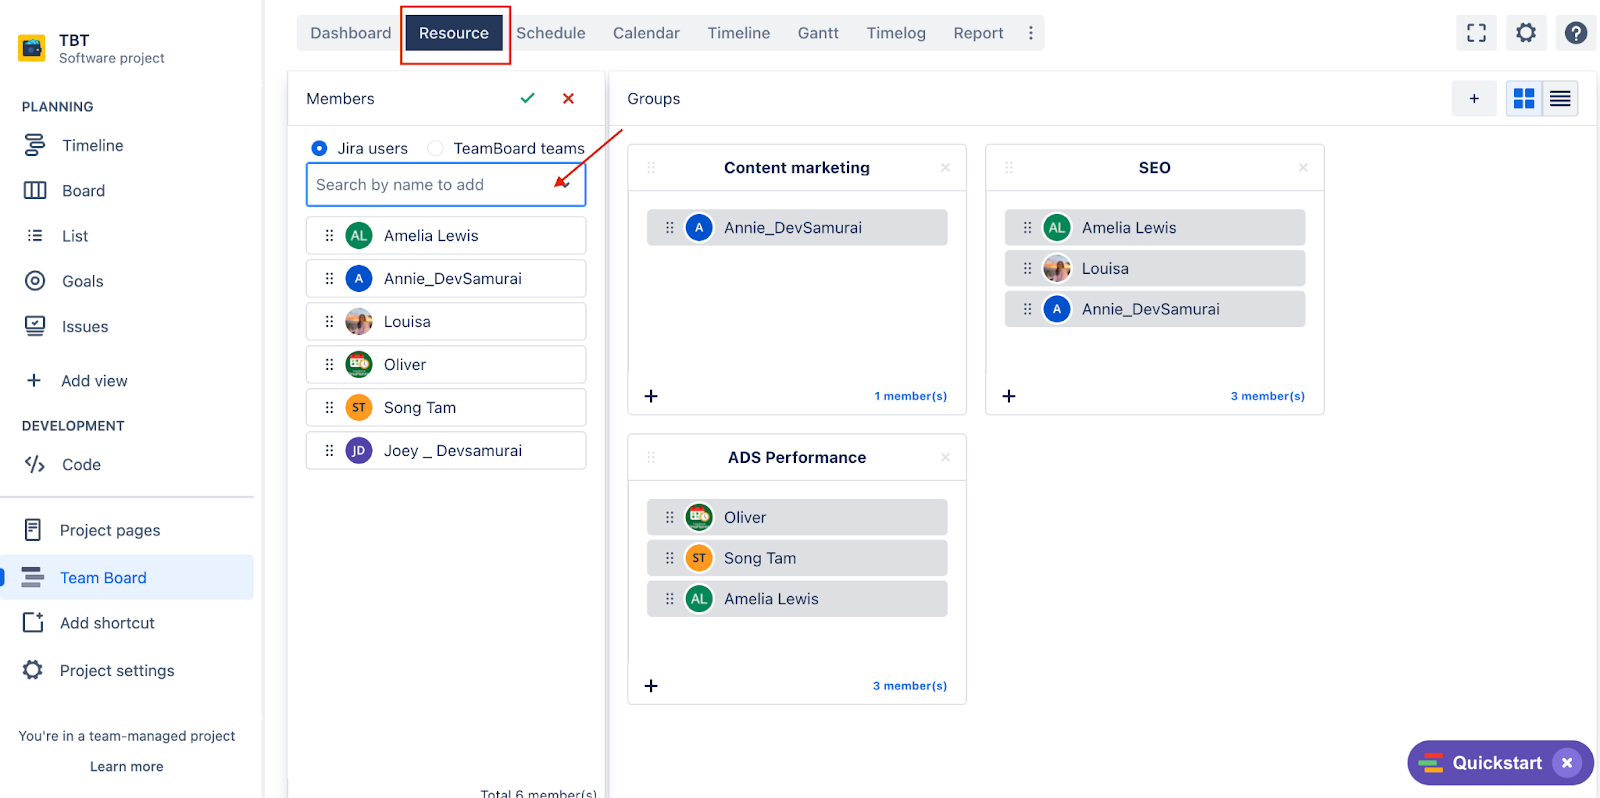
Resource Allocation: Assign resources to tasks based on availability and skill sets. Use the resource view to avoid over-allocation and ensure optimal use of resources.
3. Customization and Filters
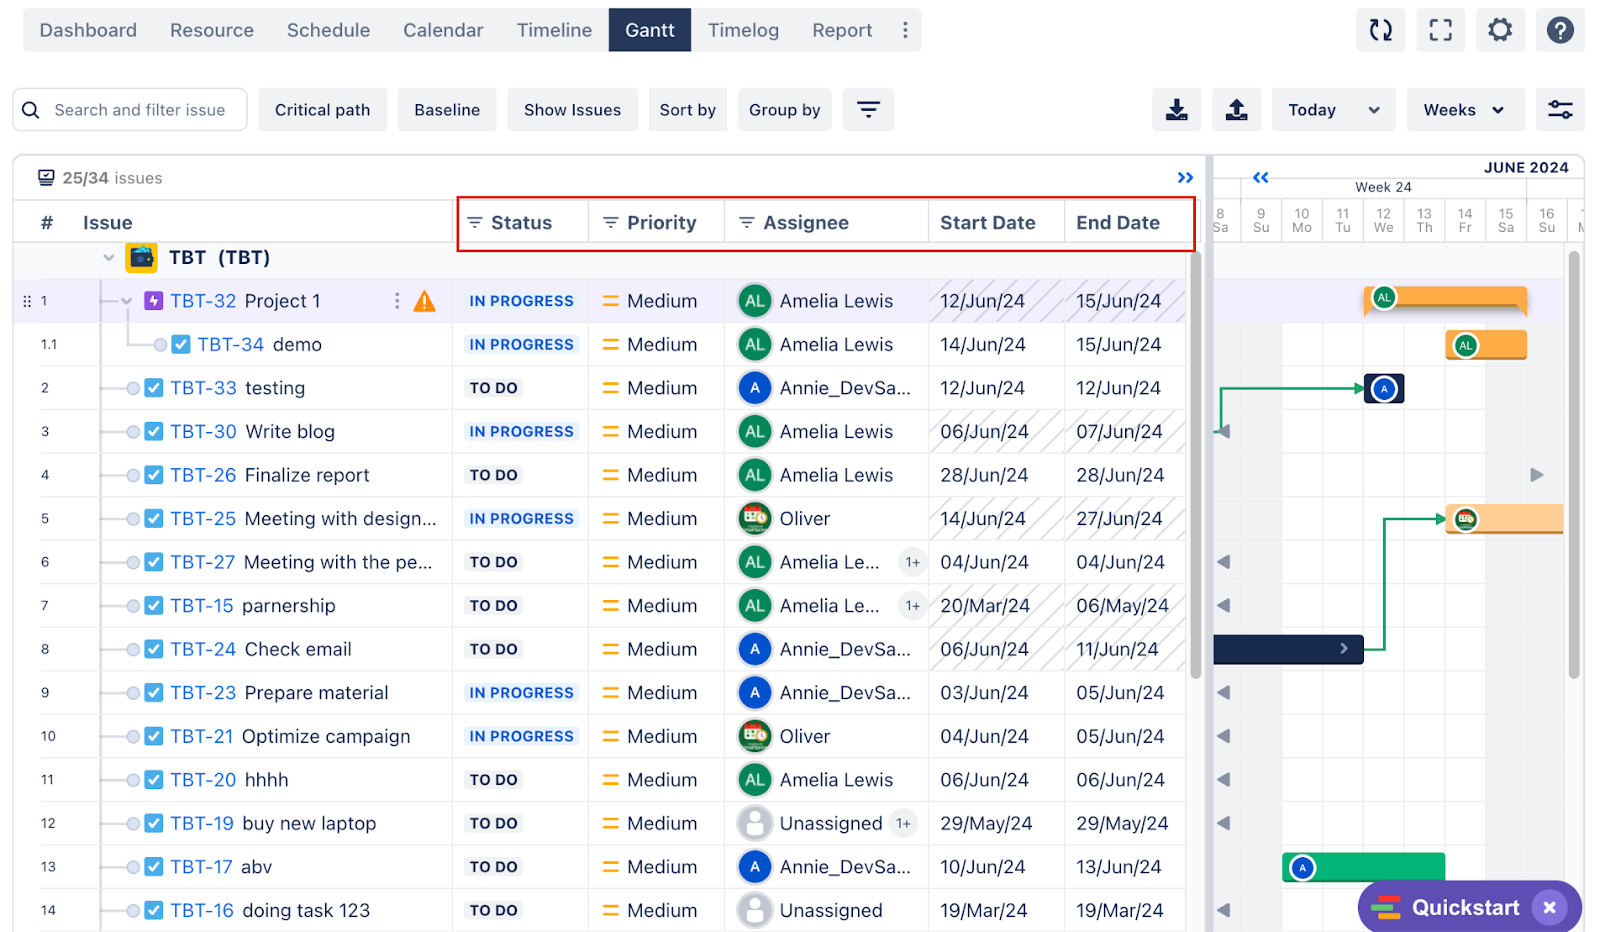
Custom Fields: Add custom fields to capture additional information relevant to your tasks, such as priority, or custom statuses.
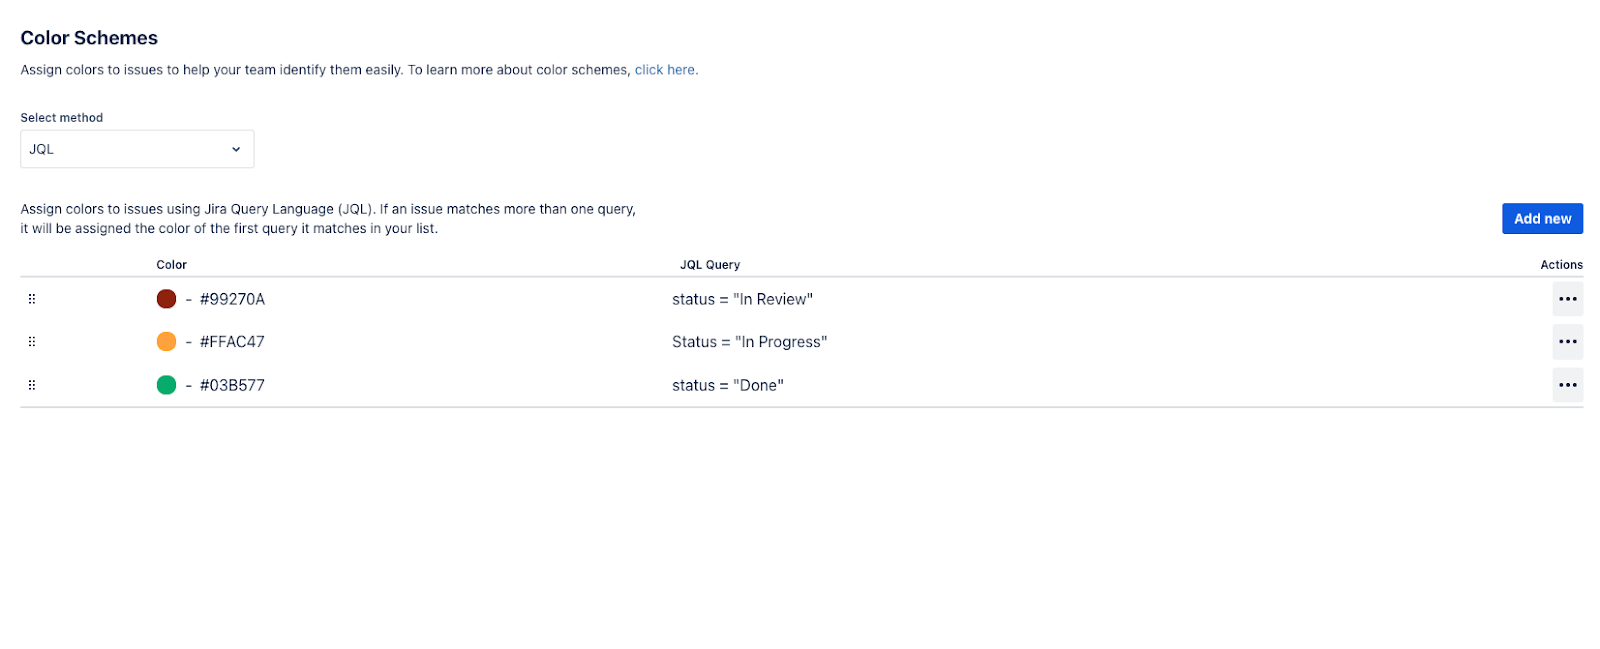
Color Coding via JQL: Use color coding to differentiate between task types, priority levels, or project phases for better visual clarity.
4. Progress Tracking and Baselines
Track Progress: Regularly update task statuses and completion percentages. Use the Gantt chart to visualize progress against planned timelines.
Set Baselines: Establish baselines to capture the original project plan. Compare current progress with the baseline to identify deviations and take corrective actions.

5. Collaboration and Communication
Comments and Attachments: Utilize the comments section to add notes, updates, or feedback on tasks. Attach relevant documents or files for easy reference.
Notifications: Set up notifications and alerts to keep team members informed about task assignments, deadlines, and changes.
Shared Views: Share the Gantt chart with stakeholders to provide visibility into project progress and ensure alignment.
6. Reporting and Exporting
Generate Reports: Create detailed reports on project status, resource utilization, and task completion. Customize reports based on your audience and their specific needs.
Export Options: Export the Gantt chart in various formats (PDF, Excel, etc.) for presentations, meetings, or offline review.
If you have any questions, please feel free to reach out to our support team or schedule a demo call to get personalized assistance.
⏩ Watch 10-minute demo video
🆕 Try it now on Sandbox
📍 Development roadmap
🙋 Contact Support
🌐 Visit teamboard.cloud