.png)
Reports allow users to gather and analyze key data, such as capacity, scheduled hours, logged hours, etc., from various plans, including team, project, and program levels. These insights help track performance, monitor workloads, and support better decision-making.
Reports can be customized with filters to focus on the most relevant information, and the data can be managed or exported to Excel for further analysis and sharing.
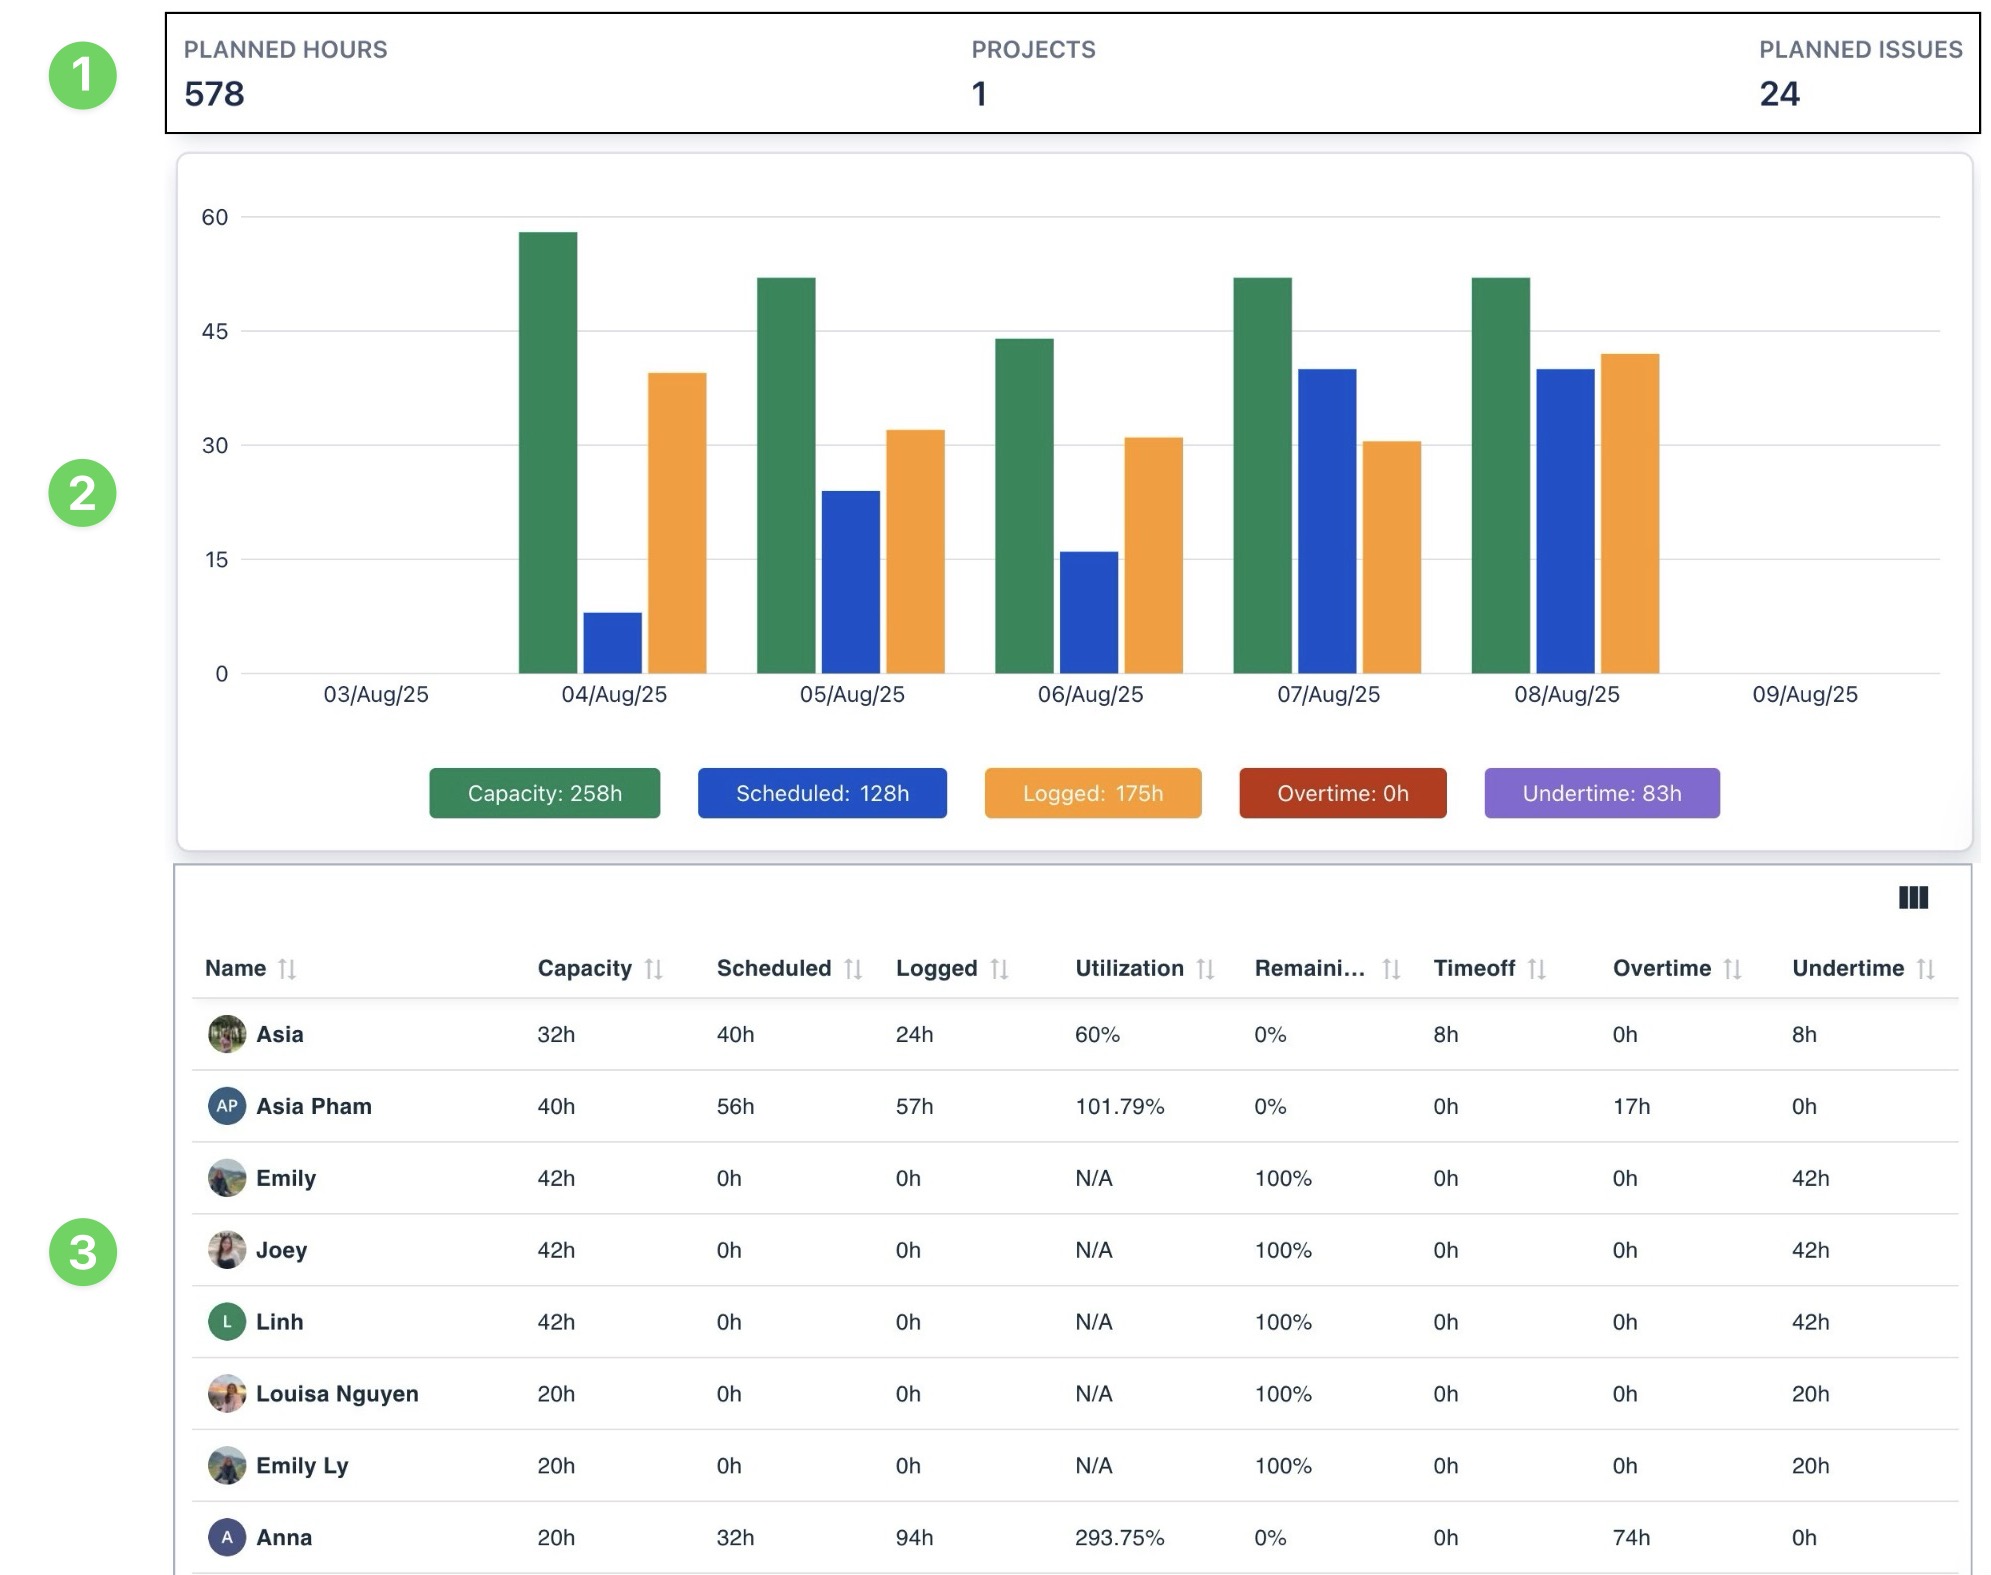
The Report Board offers three distinct sections for data reports: Summary, Chart, and Table.
-
Summary Reports: Provide a high-level overview, focusing on key insights and essential data.
-
Chart Reports: Use column charts to visually present key metrics like capacity, scheduled, and logged hours, enabling quick comparisons across categories or time periods.
-
Table Reports: Display detailed data in a structured, row-and-column format, offering an in-depth view.
Filter options
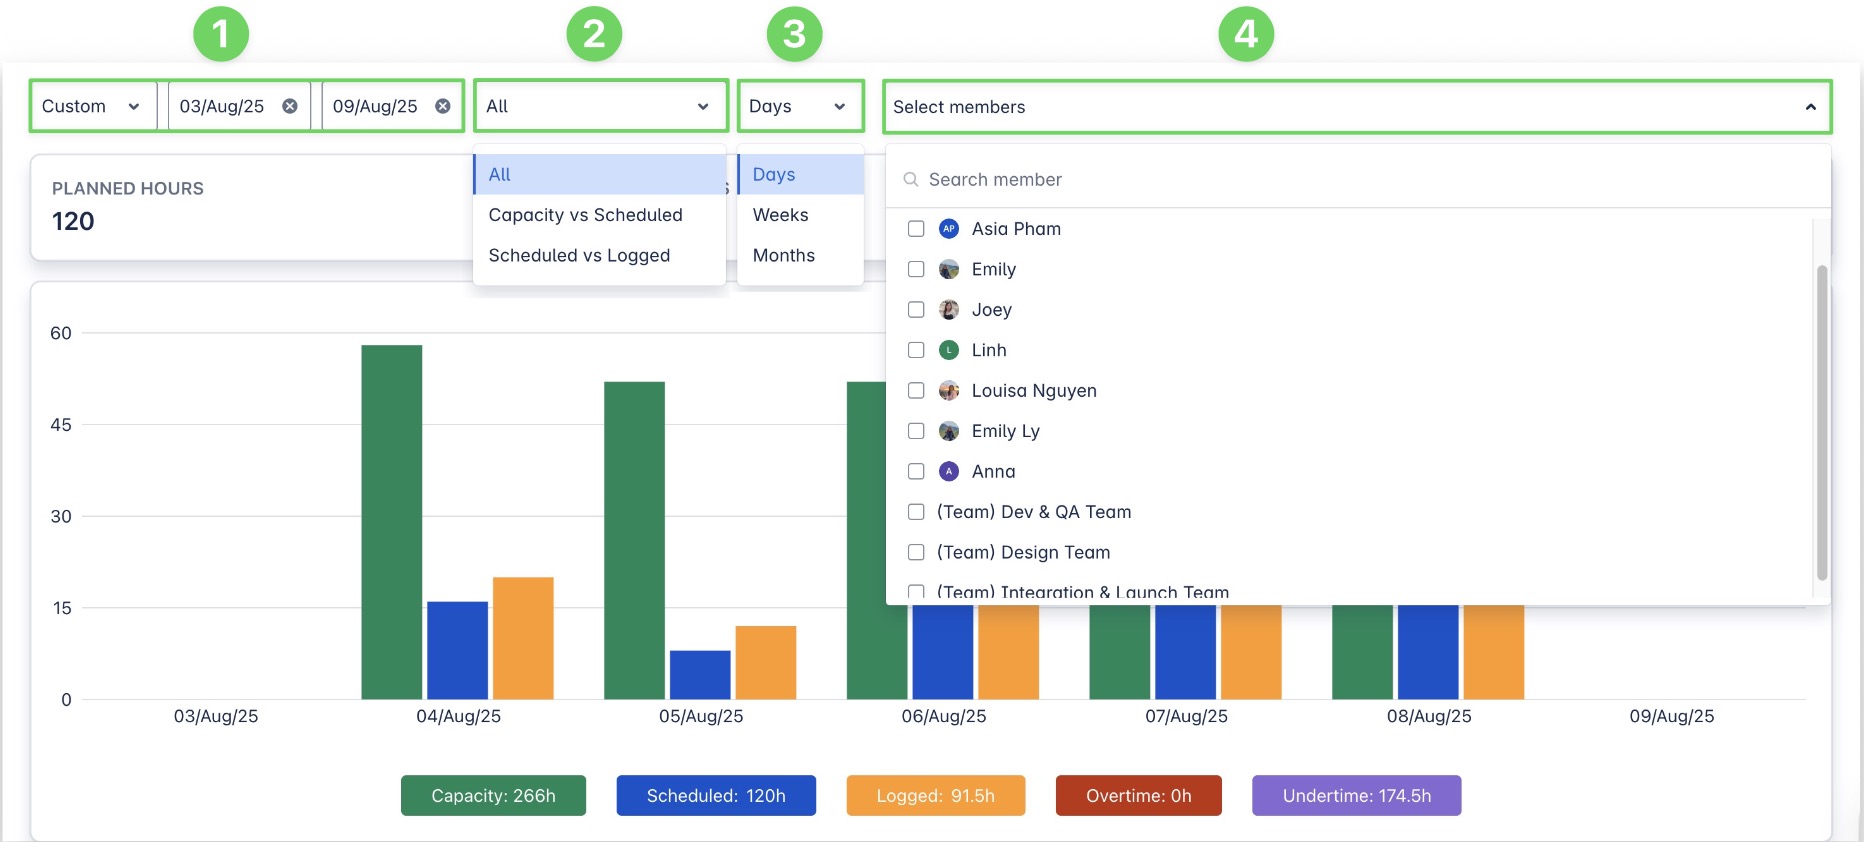
The following filters allow you to customize the data displayed in the Report:
|
Options |
Description |
|---|---|
|
Dynamic range: Select a relative time frame (e.g., This week, Last 30 days). The range updates automatically over time. Fixed range: Set a custom date range by selecting a specific start and end date. |
|
🟩 🟦 🟧 All: Shows capacity, scheduled, and logged hours together for full visibility. 🟩 🟦 Capacity vs Scheduled: Compares how much time was available (capacity) vs. how much was planned (scheduled). 🟦 🟧 Scheduled vs Logged: Compares planned hours against actual time spent. |
|
📅 Days: View data broken down by each day. 📆 Weeks: View weekly summaries. 🗓️ Months: View monthly totals. |
|
🔍 Search by name 👤 Select individual members 👥 Select entire teams |
Summary Report
The Summary Report offers a concise yet comprehensive overview of key project metrics. It serves as a snapshot of critical data, helping project managers and stakeholders quickly assess the status and scope of ongoing efforts.
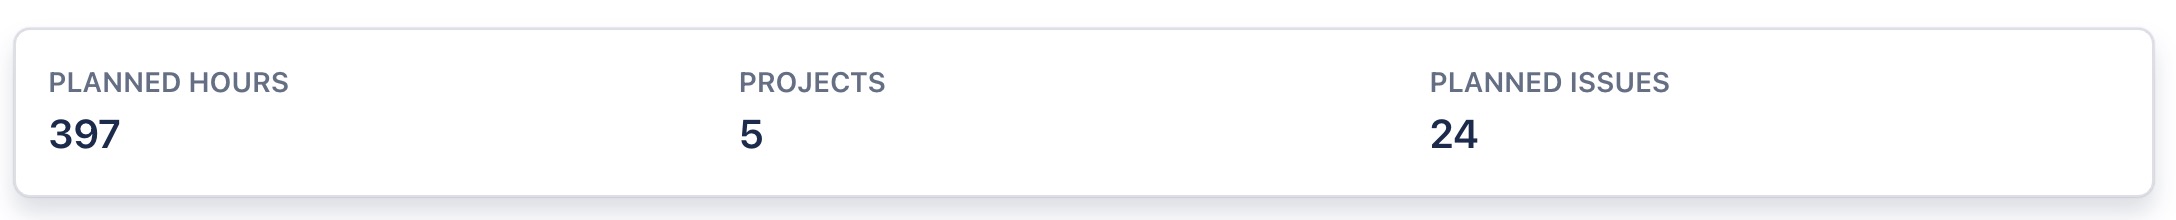
This report includes important metrics such as:
-
Planned hours: Refers to the total estimated time allocated for completing all scheduled tasks across the entire project.
-
Projects: In the context of the program or team, this metric indicates the total number of projects included in the report.
-
Planned issues: Refers to the number of tasks that have been planned for completion within the project.
Chart Report
The Chart Report provides a visual overview of key metrics such as capacity, scheduled hours, and logged hours, using column charts for easy comparison across categories or time periods. It also highlights overtime and undertime to help identify resource utilization imbalances and optimize workload management.
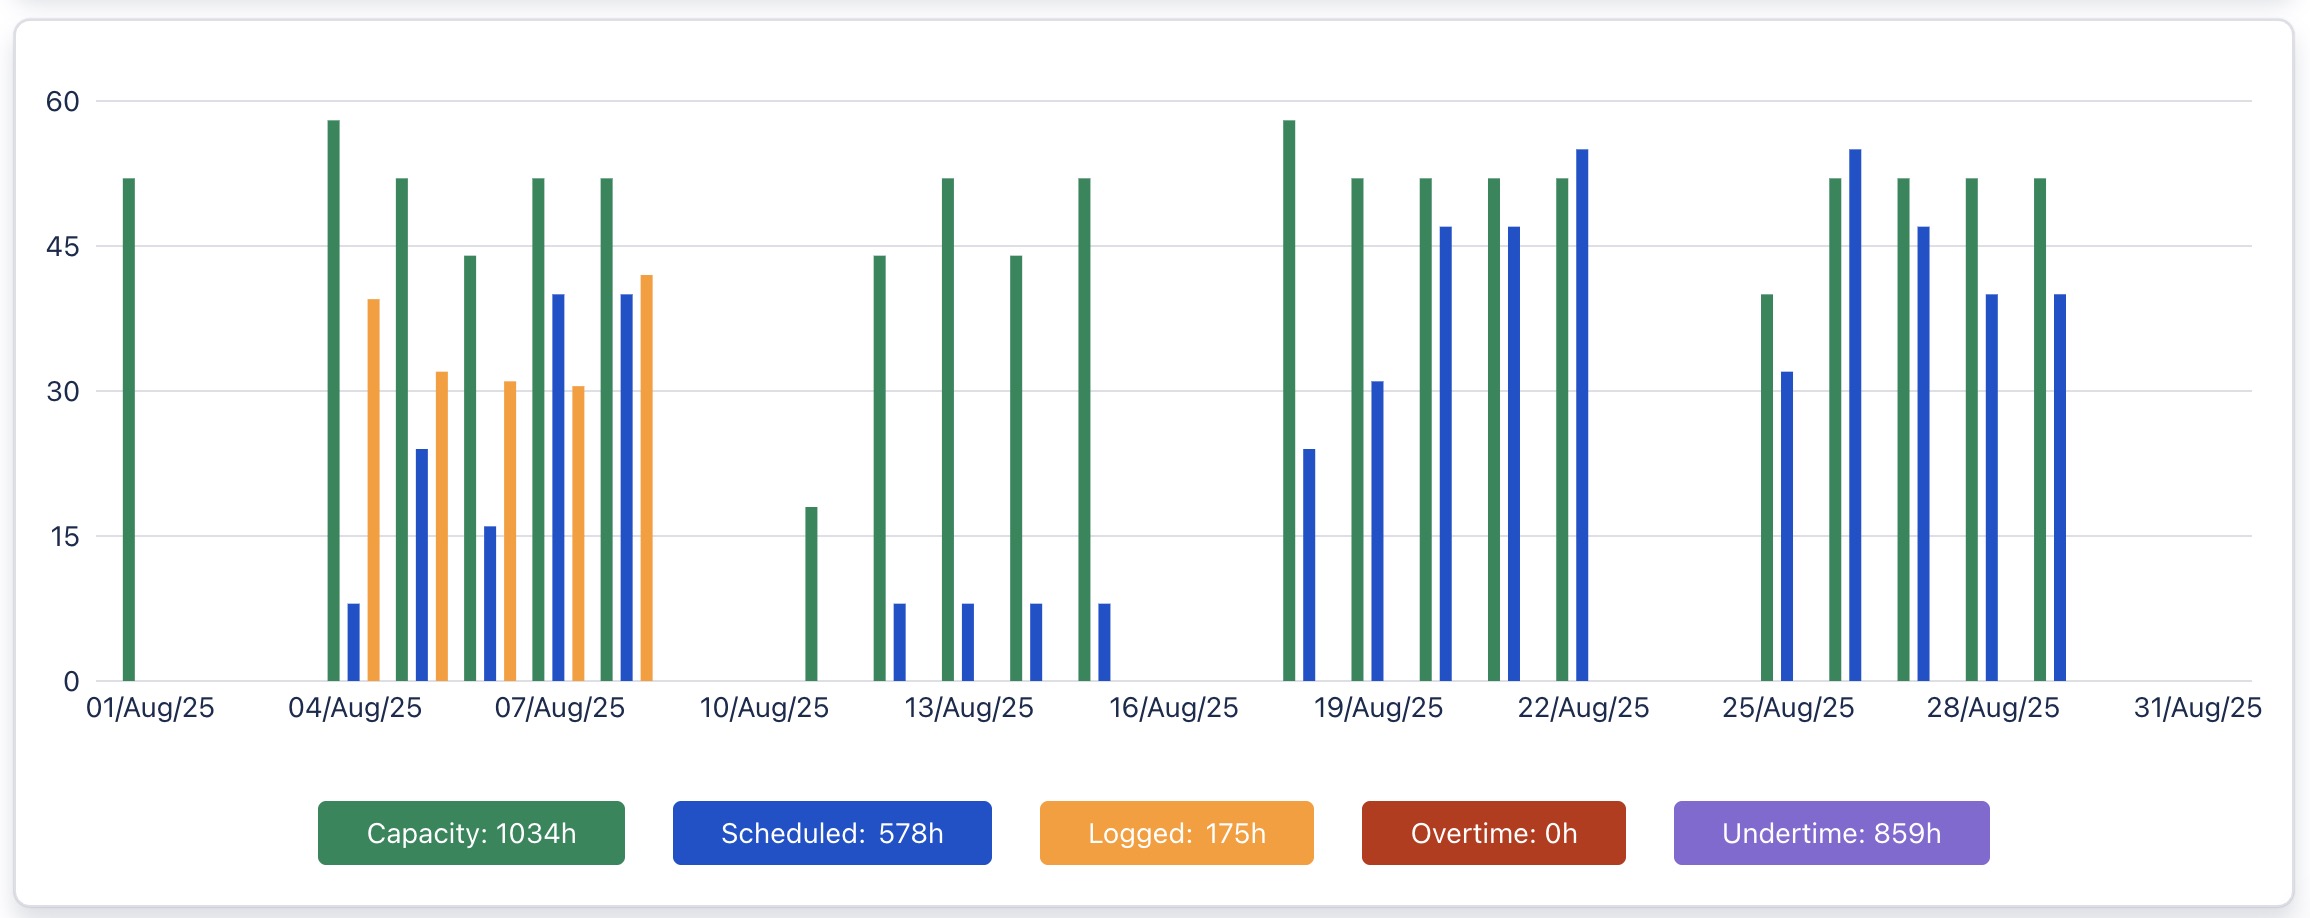
This report includes important metrics such as:
-
Capacity: This represents the total available time of resources that can be allocated across all tasks in a given period.
-
Scheduled: Refers to the total estimated time allocated for completing all scheduled tasks across the entire project.
-
Logged: This shows the actual hours worked or logged by the team members.
-
Overtime: This represents the logged hours are more than the capacity.
-
Undertime: This represents the logged hours are less than the capacity.
Overtime | Undertime (h) = Capacity - Logged time
Viewing detailed charts
Hold the pointer over the chart to show the detailed information for each metric.
Table Report
The Table Report provides detailed, tabular views of data, with options for tracking specific aspects like tasks, projects, or assignees.
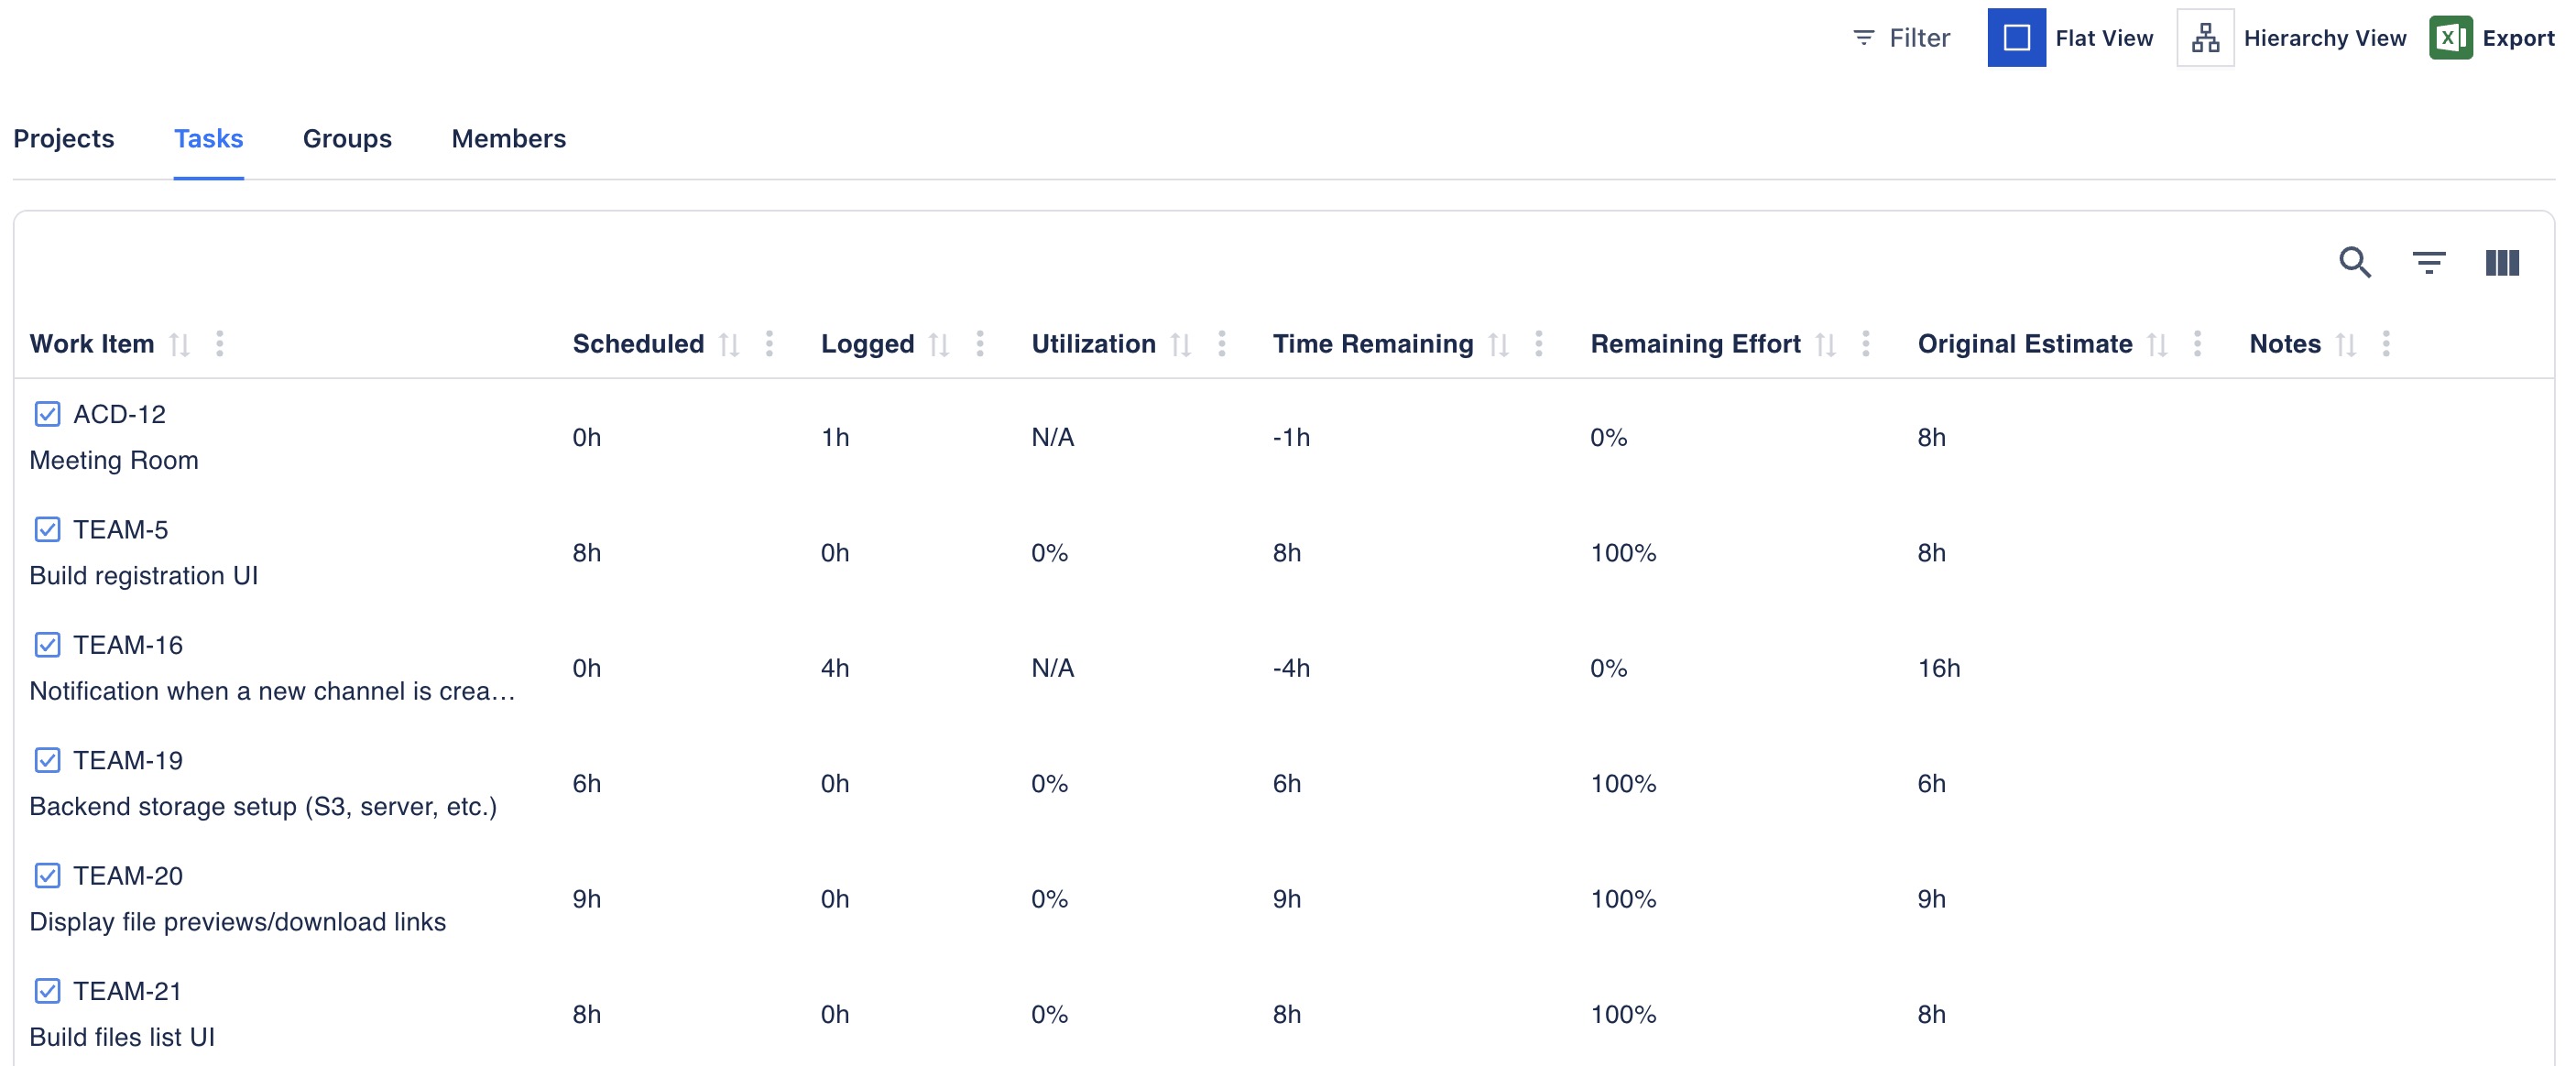
Tasks
The Tasks tab displays detailed metrics for each work item.
|
Metric |
Description |
|---|---|
|
Scheduled |
Total hours scheduled for the work item within the selected period. |
|
Logged |
Total hours logged for the work item. |
|
Utilization |
Percentage of scheduled time already logged:
|
|
Time Remaining |
Scheduled time that has not yet been logged:
|
|
Remaining Effort |
Percentage of scheduled work still remaining:
|
|
Original Estimate |
The original estimated effort from Jira. |
|
Notes |
Notes added to the work item. |
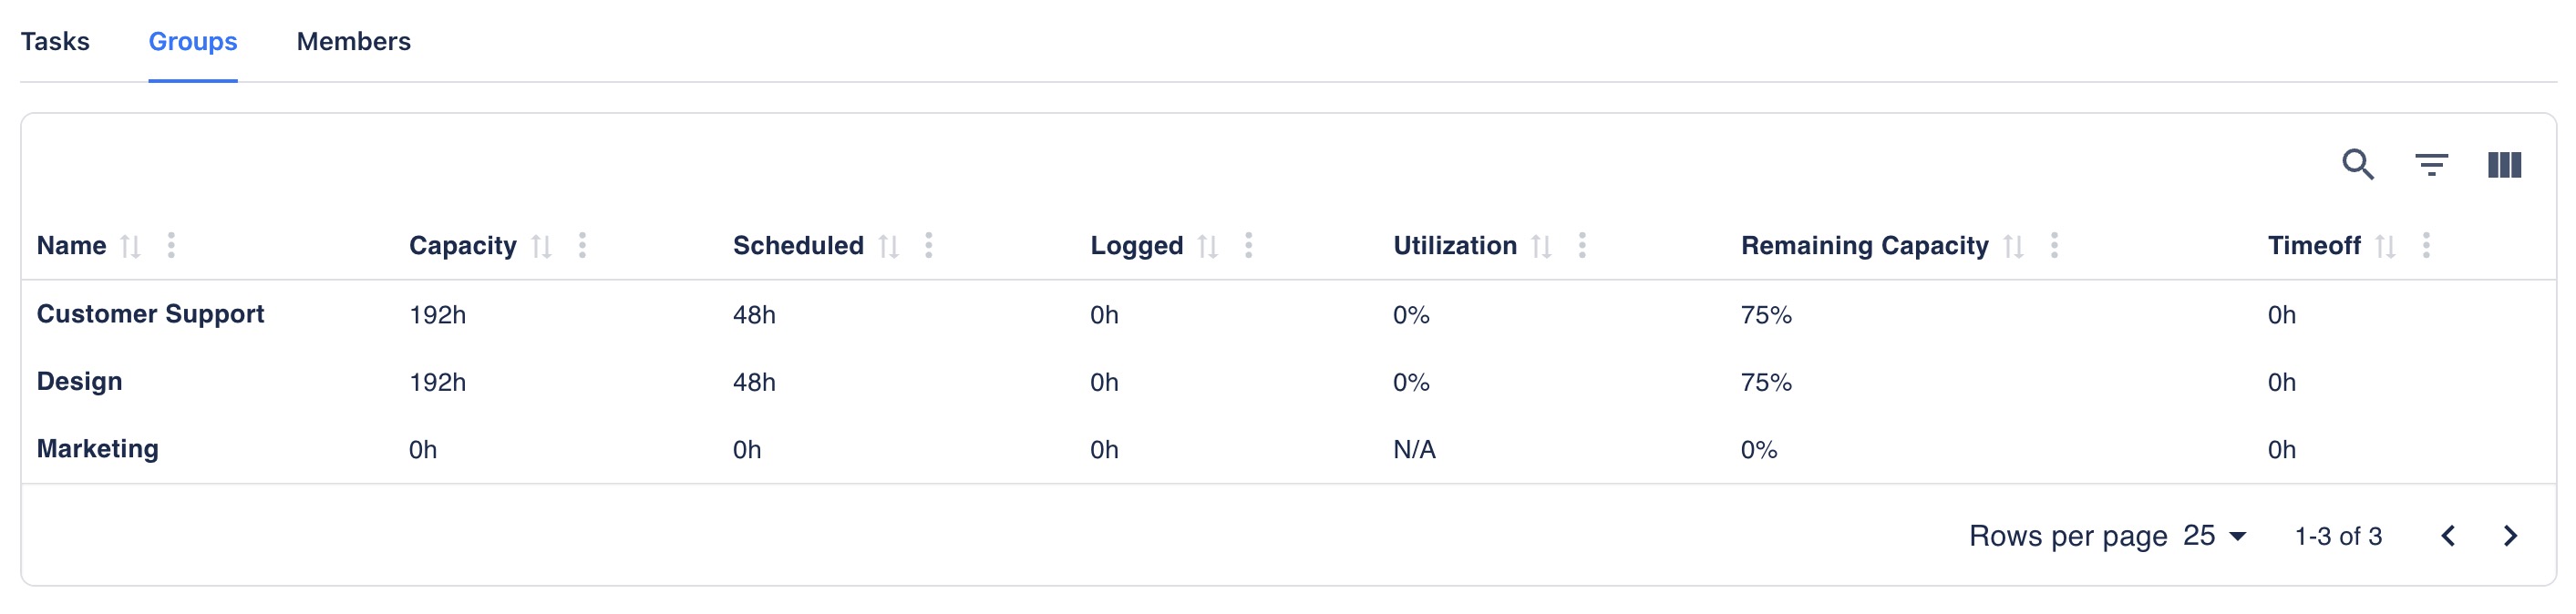
Groups
The Groups tab summarizes workload and utilization for each resource group.
|
Metric |
Description |
|---|---|
|
Capacity |
Total available working hours for all members in the group. |
|
Scheduled |
Total scheduled hours assigned to members in the group. |
|
Logged |
Total hours logged by members in the group. |
|
Utilization |
Percentage of scheduled time already logged:
|
|
Remaining Capacity |
Percentage of group capacity still available:
|
|
Time Off |
Total time-off hours recorded for members in the group. |
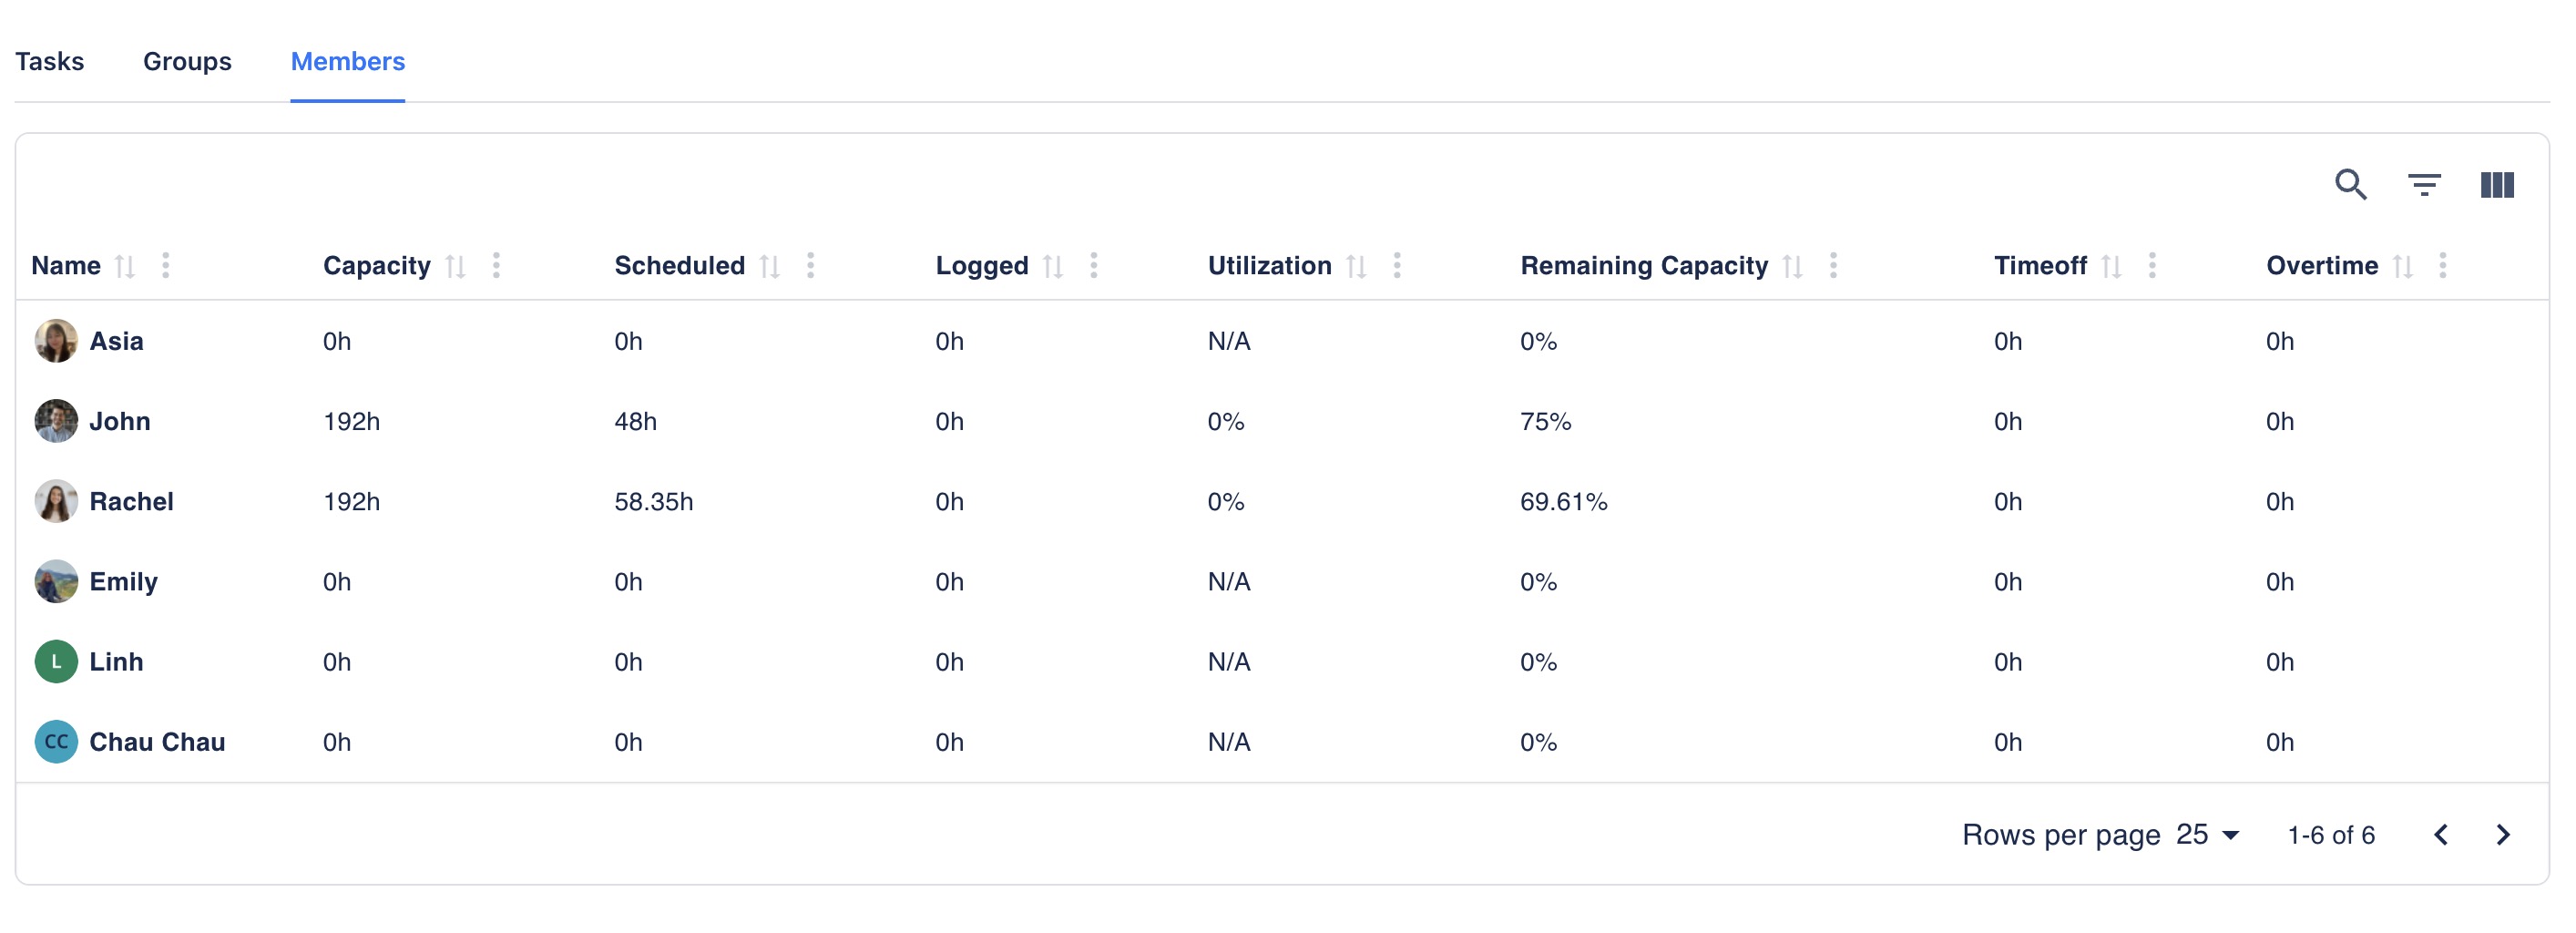
Members
The Members tab displays workload statistics for each individual team member.
|
Metric |
Description |
|---|---|
|
Capacity |
Total available working hours for the member during the selected period. |
|
Scheduled |
Total scheduled hours assigned to the member. |
|
Logged |
Total hours logged by the member. |
|
Utilization |
Percentage of scheduled time already logged:
|
|
Remaining Capacity |
Percentage of the member’s capacity still available:
|
|
Time Off |
Total time-off hours recorded for the member. |
|
Overtime |
Logged hours beyond the member’s capacity: |