Dashboard
1. Overview
The AgileTest Dashboard is a customizable space that displays the metrics and results from your testing process. These data from core AgileTest features, such as requirements, test cases, test plans, test executions, and defects, have been visualized into AgileTest widgets.
The dashboard helps teams track testing progress, monitor quality trends, and understand how test results and defects impact requirements. Each dashboard can be tailored with widgets that reflect the metrics most relevant to your project or team, ensuring alignment with your testing workflow.
To find Requirements in AgileTest, go to the Dashboard section on the left-hand side menu bar.

2. Locate & Create Dashboard
You can use the AgileTest Dashboard in 2 areas: the AgileTest Dashboard Section and the Jira Dashboard.
2.1 Dashboard in AgileTest
This option is more convenient for QA teams who work primarily within AgileTest. It provides quick access to testing data, easier widget configuration, and a focused testing-centric environment for daily quality monitoring.
To find the Dashboard in the AgileTest app, you can navigate to the Dashboard section in the left menu sidebar.
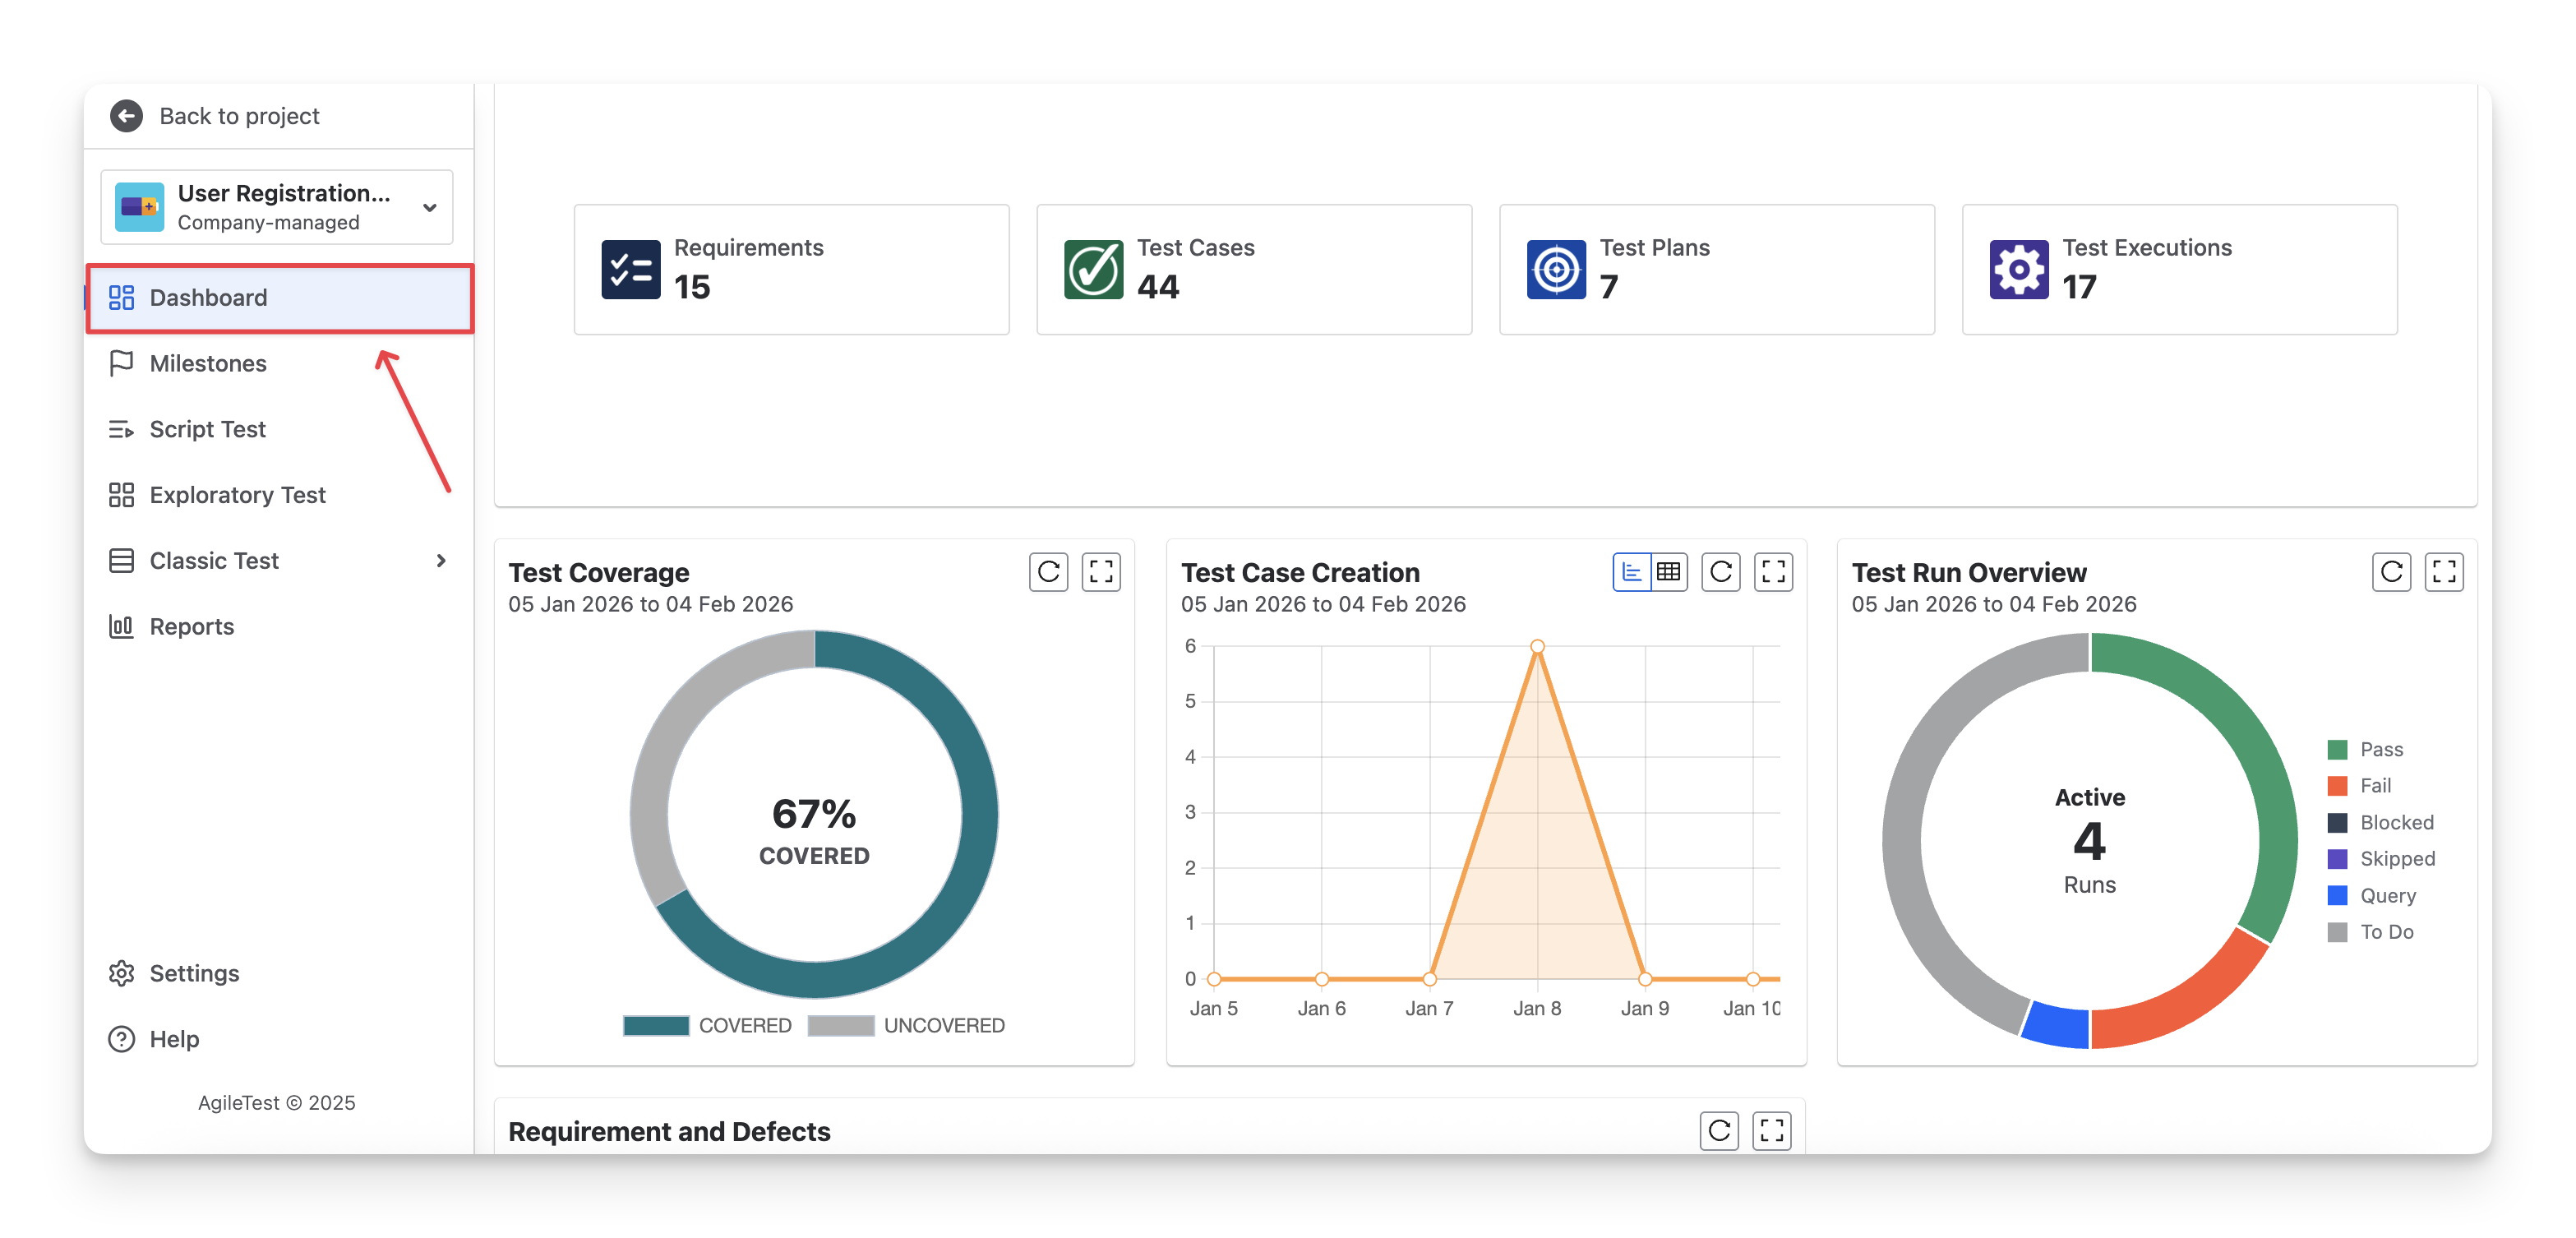
In this section, you can add the AgileTest widgets to customize your personal dashboard. Here's how:
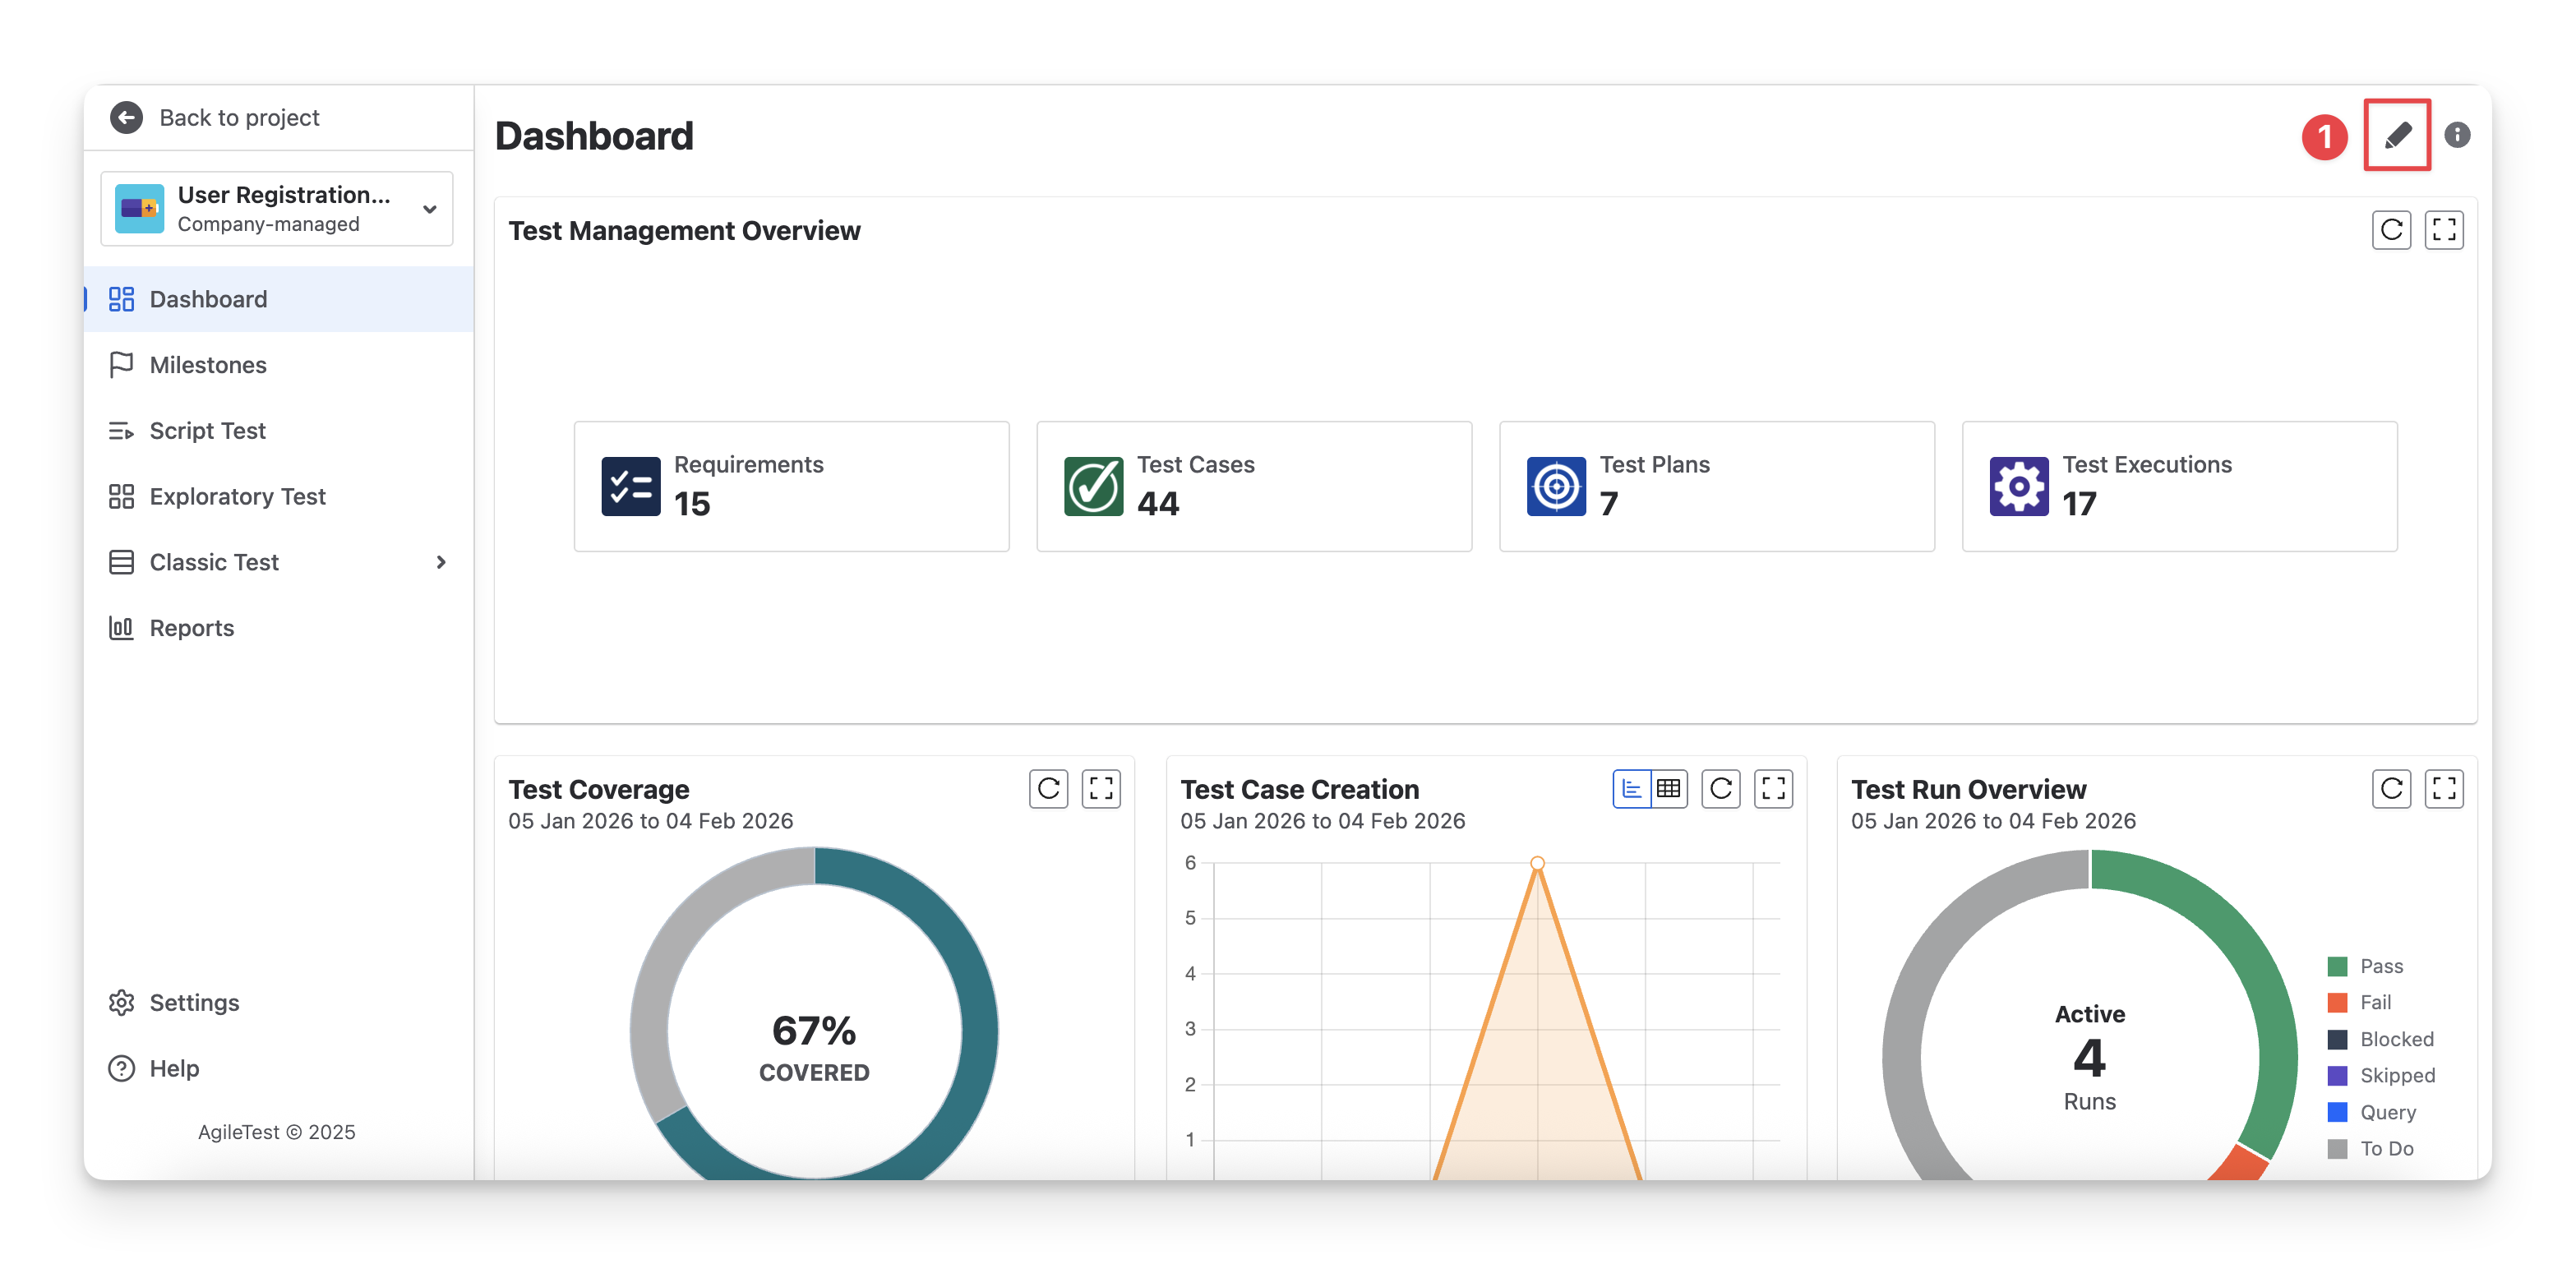
In the AgileTest Dashboard Screen, click on the “Edit” button.
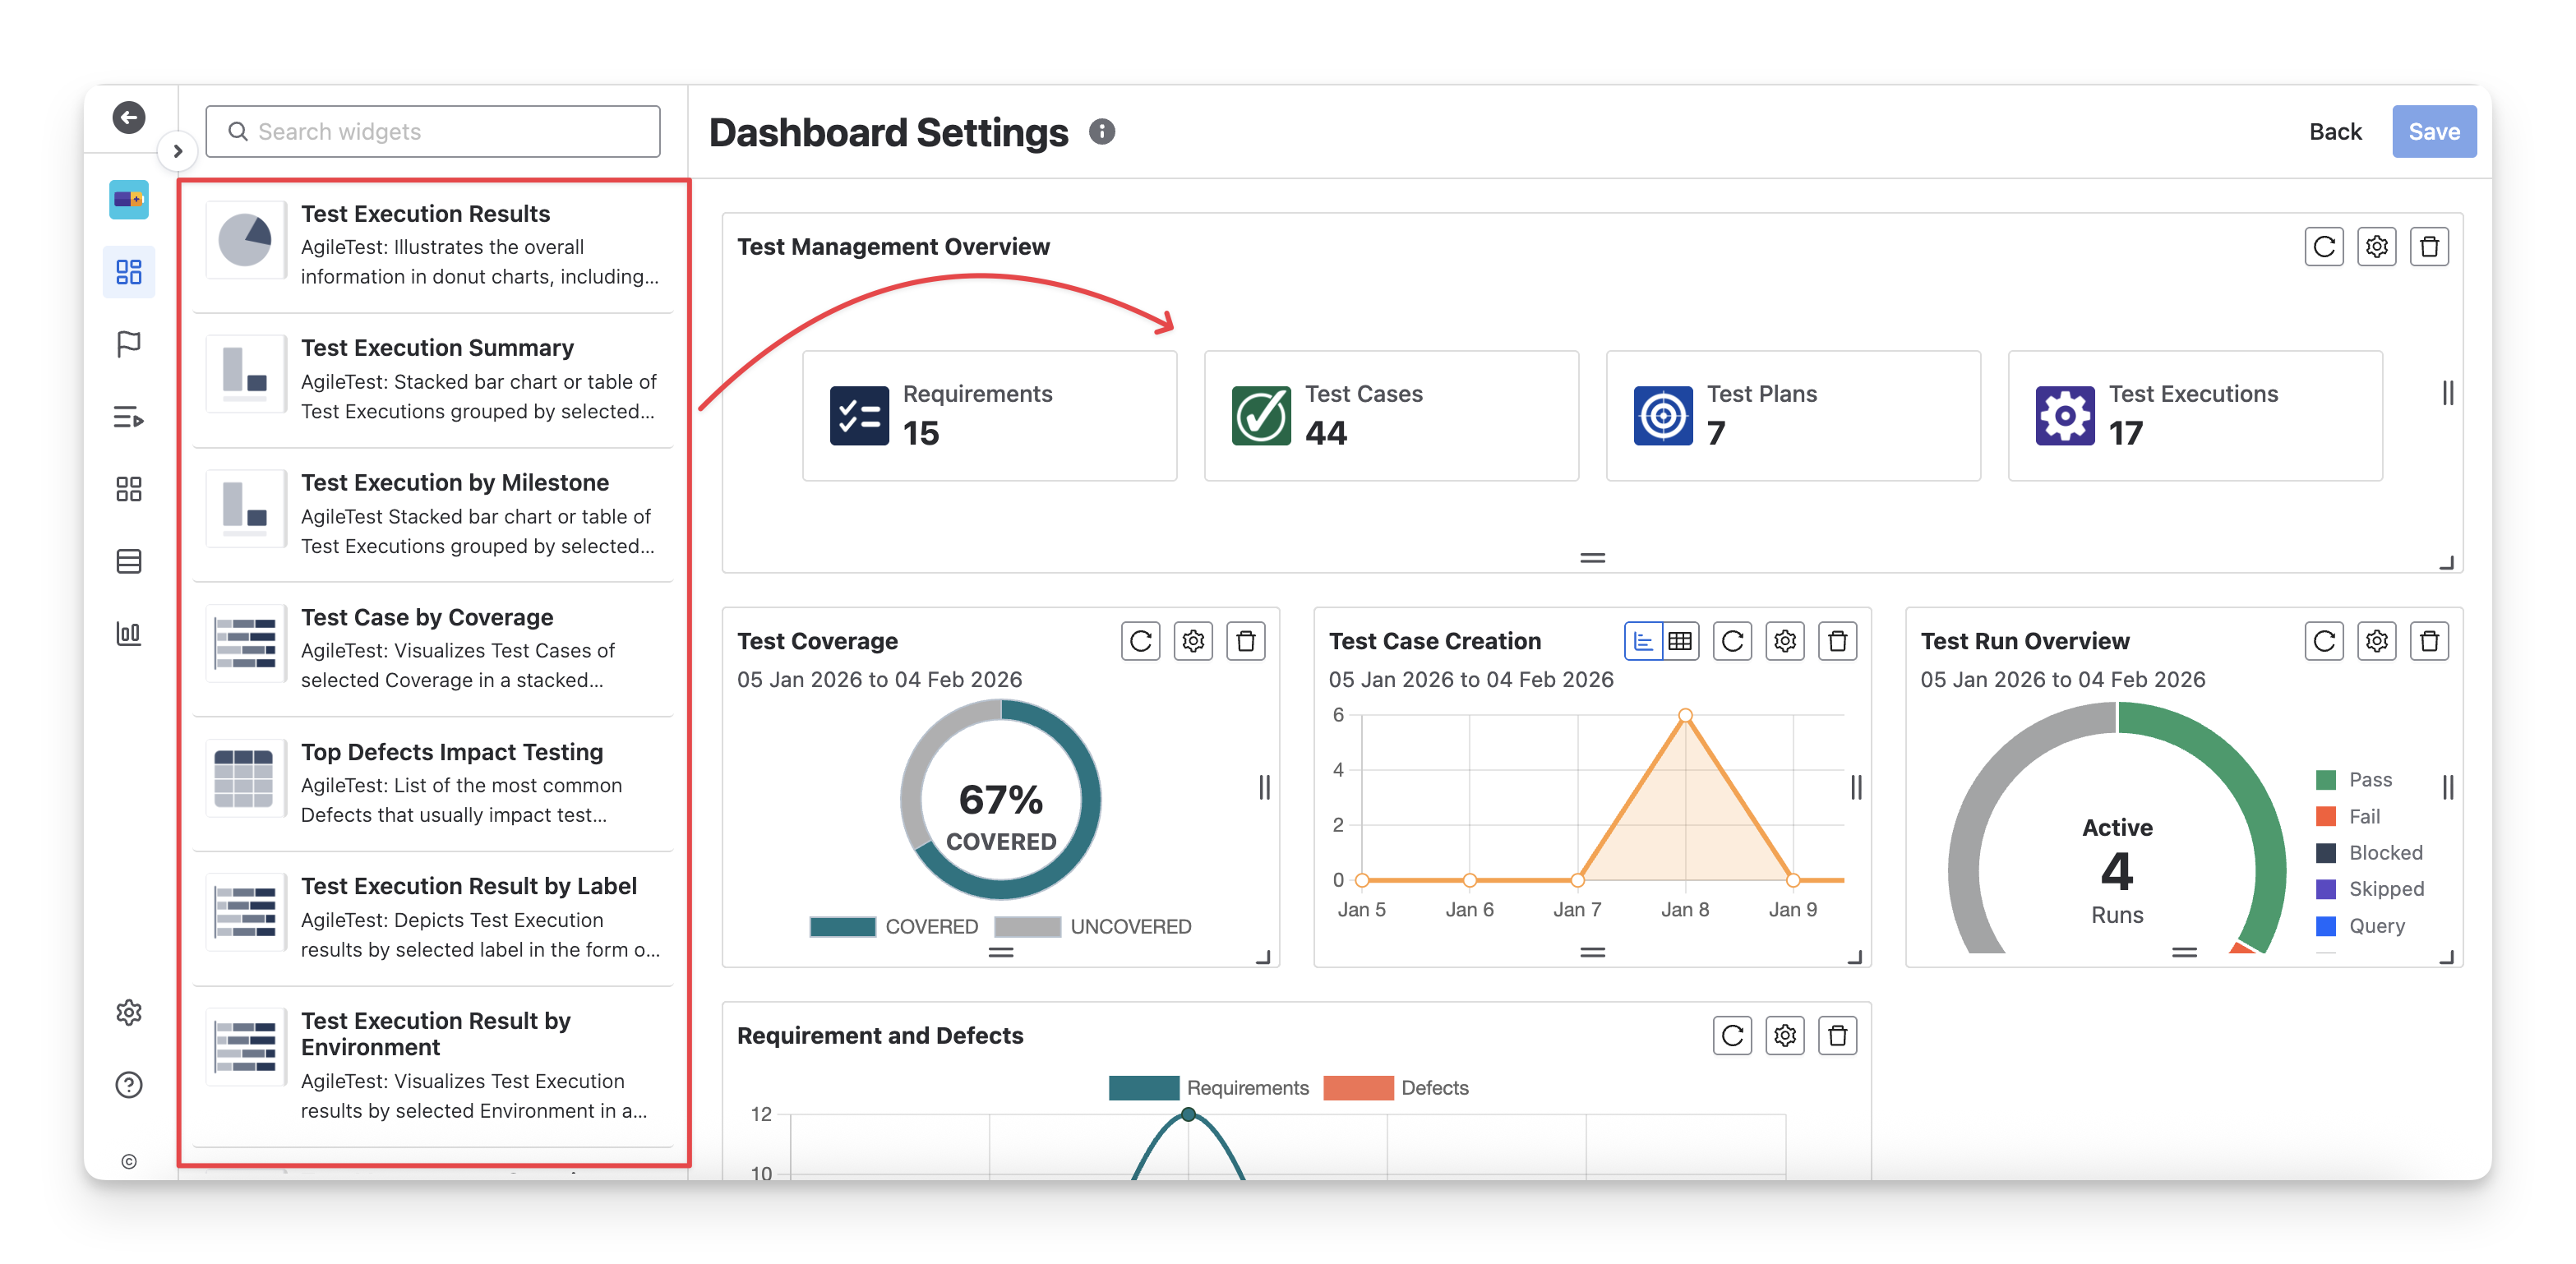
You can view a list of widgets on the left-hand side. Drag and drop the widgets you want onto the dashboard to build a view that fits your workflow.
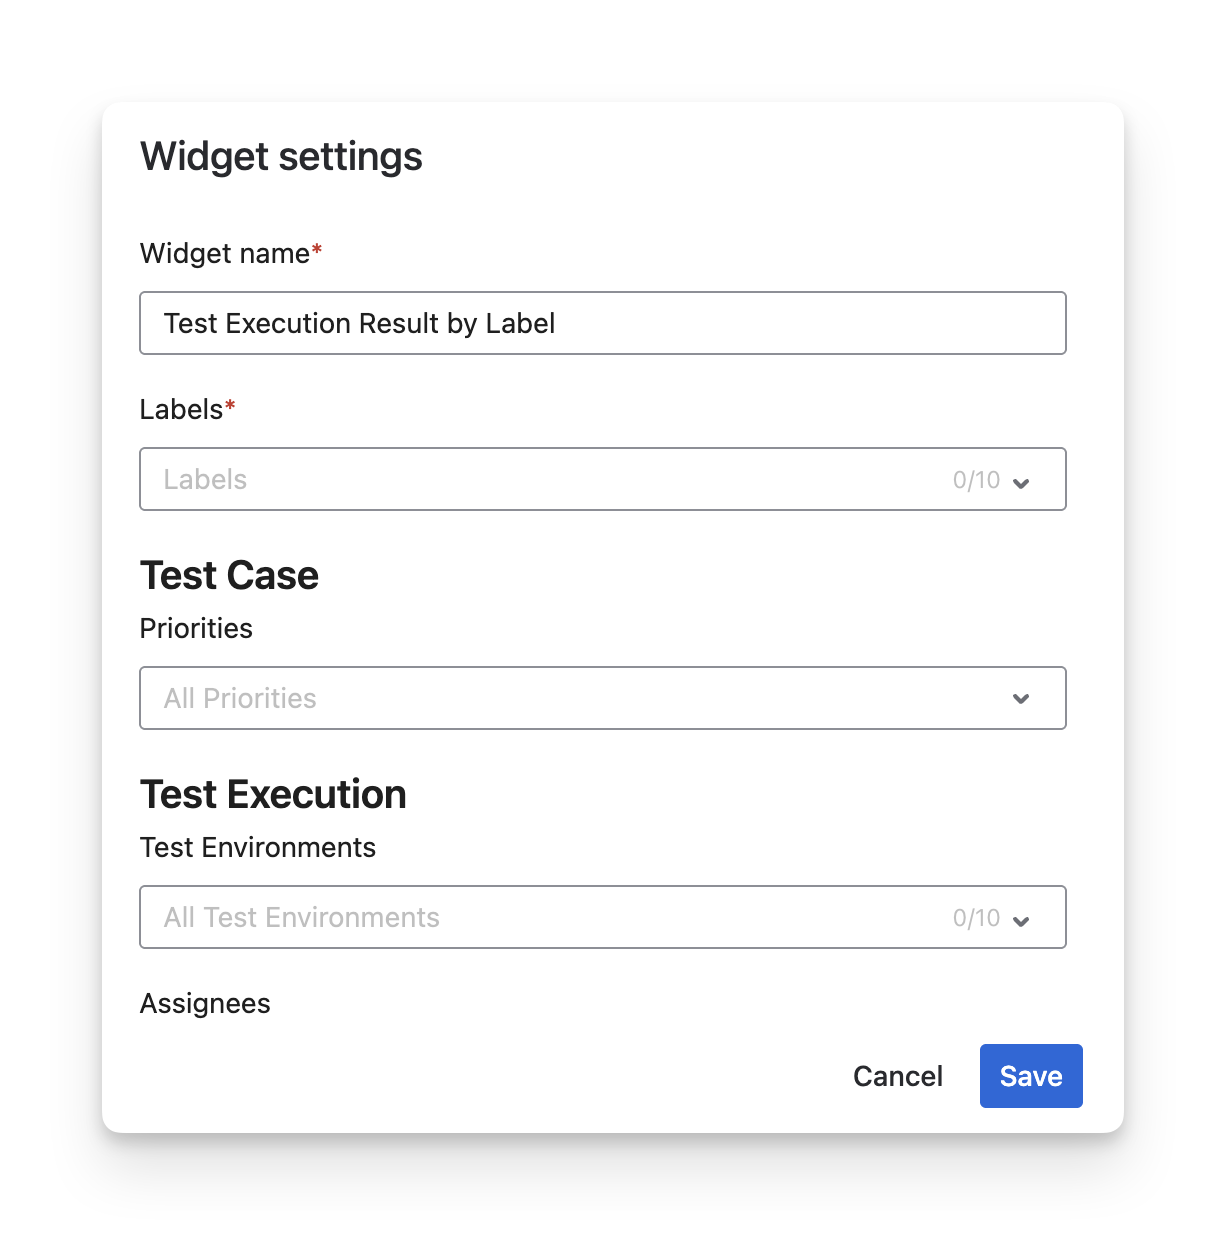
Each widget has its own configuration options. Complete the setup for each widget to ensure it displays the data and metrics you need.
The dashboard in AgileTest is for personal usage and cannot be shared with others.
2.2 Dashboard in Jira
This option is ideal for sharing purposes with broader stakeholders, such as product managers or developers. By embedding AgileTest widgets into Jira dashboards, testing metrics become more visible across teams outside the AgileTest app.
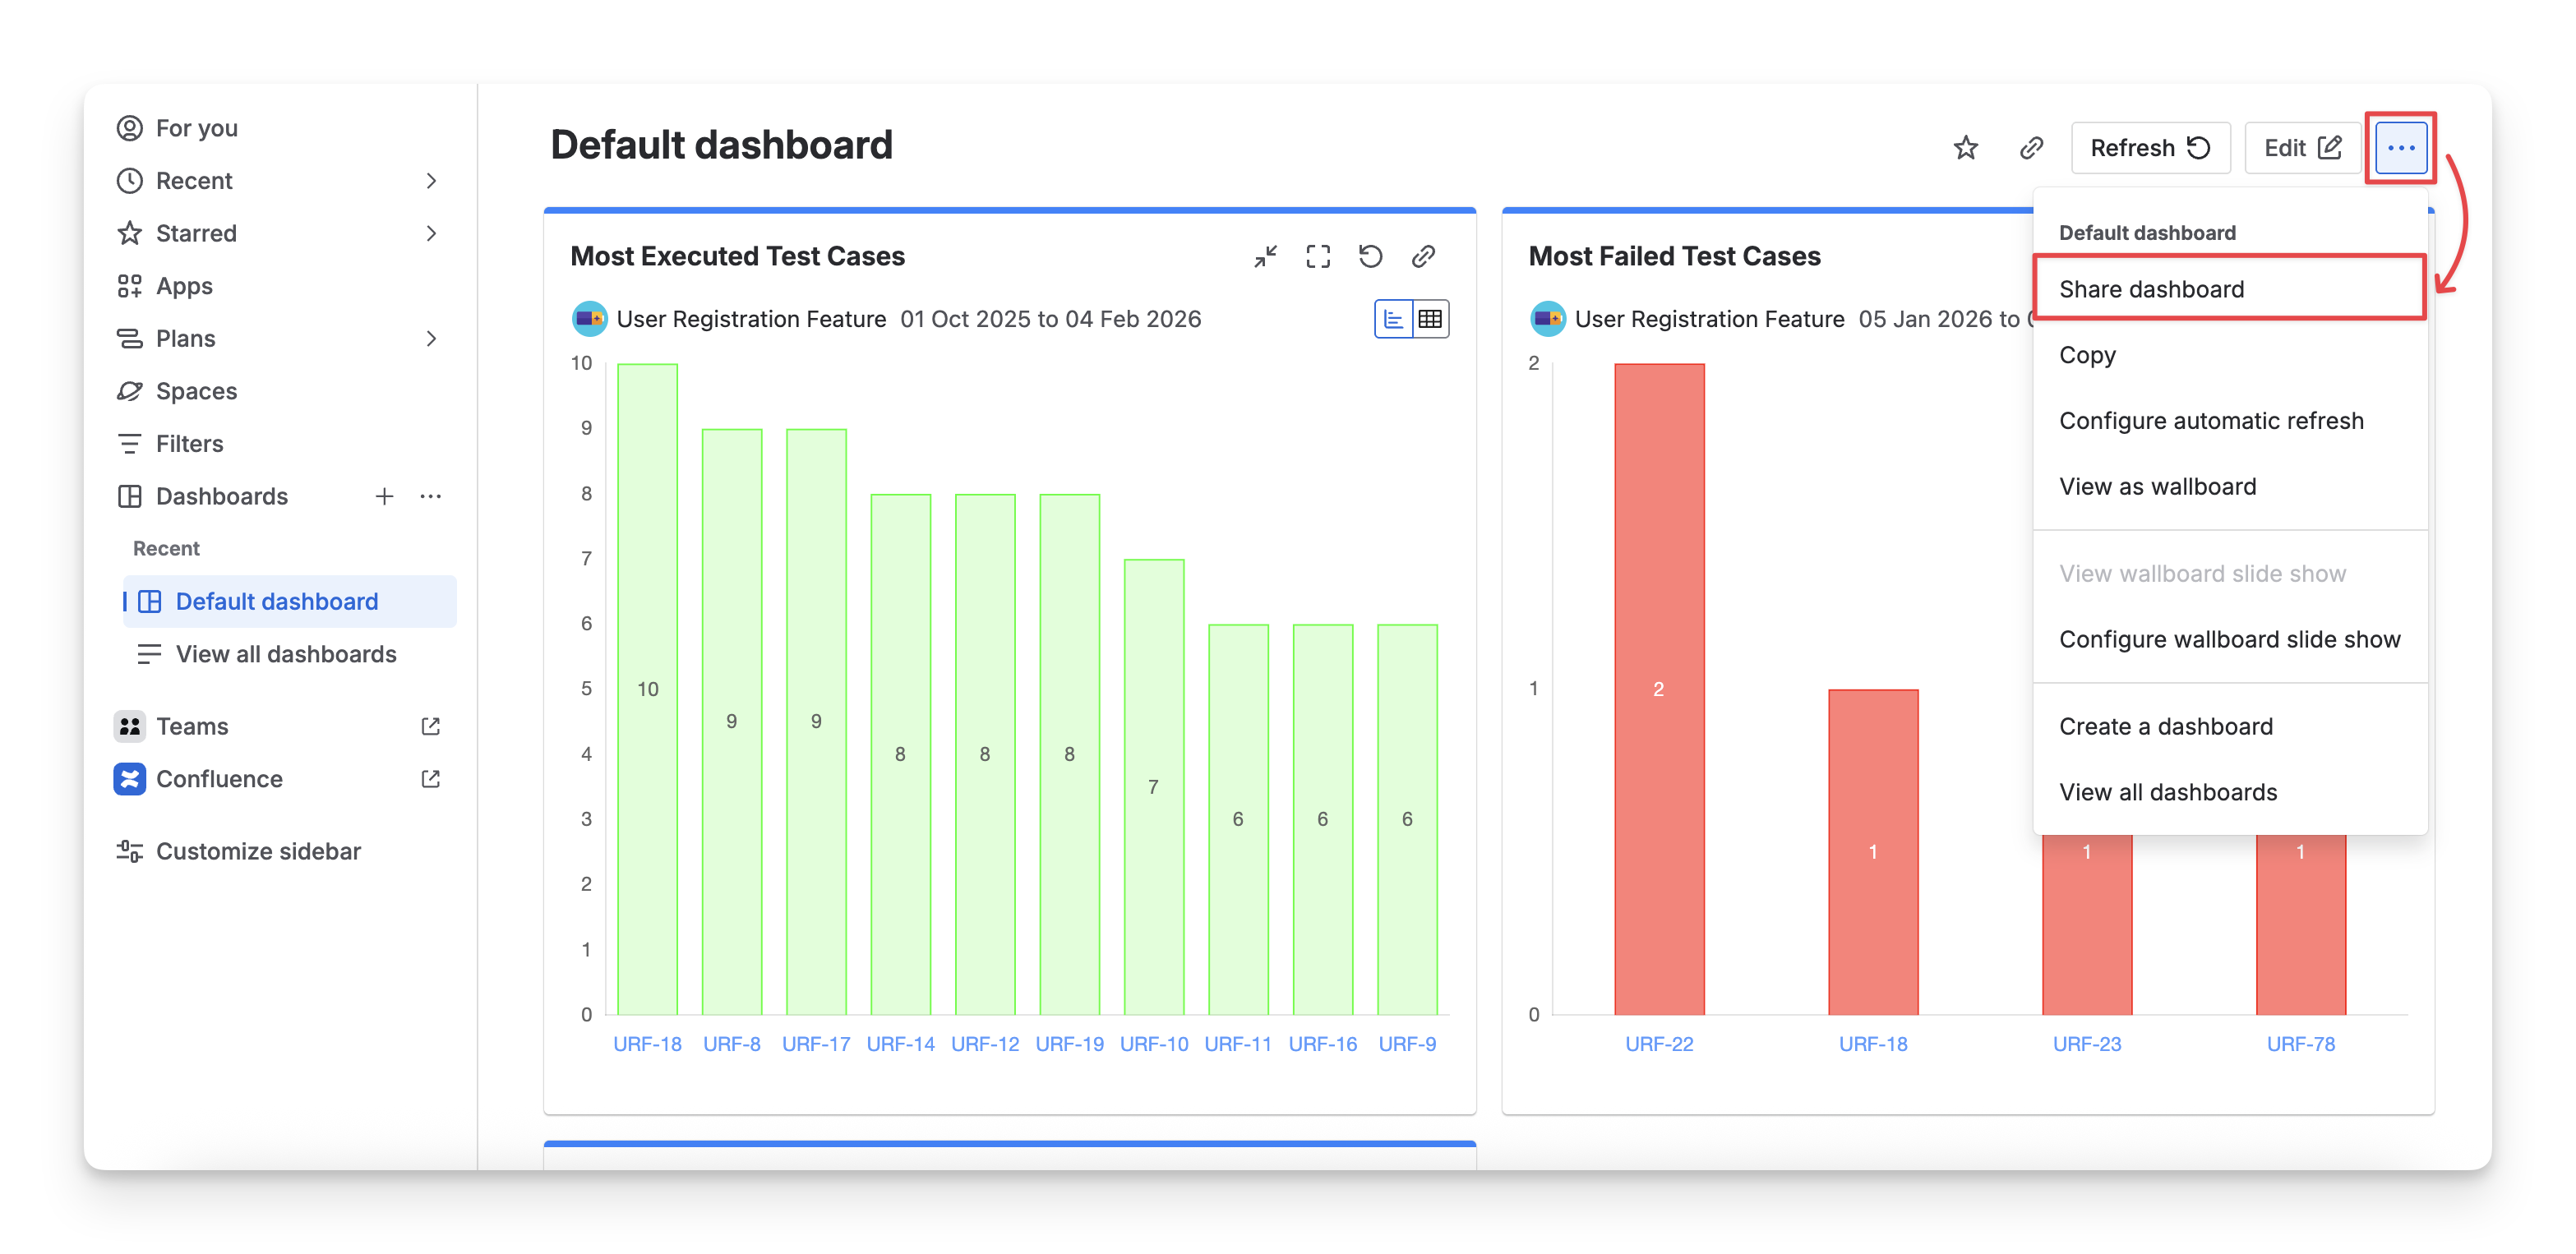
To find the Dashboard in Jira, you can navigate to the Dashboard section in the left menu sidebar.
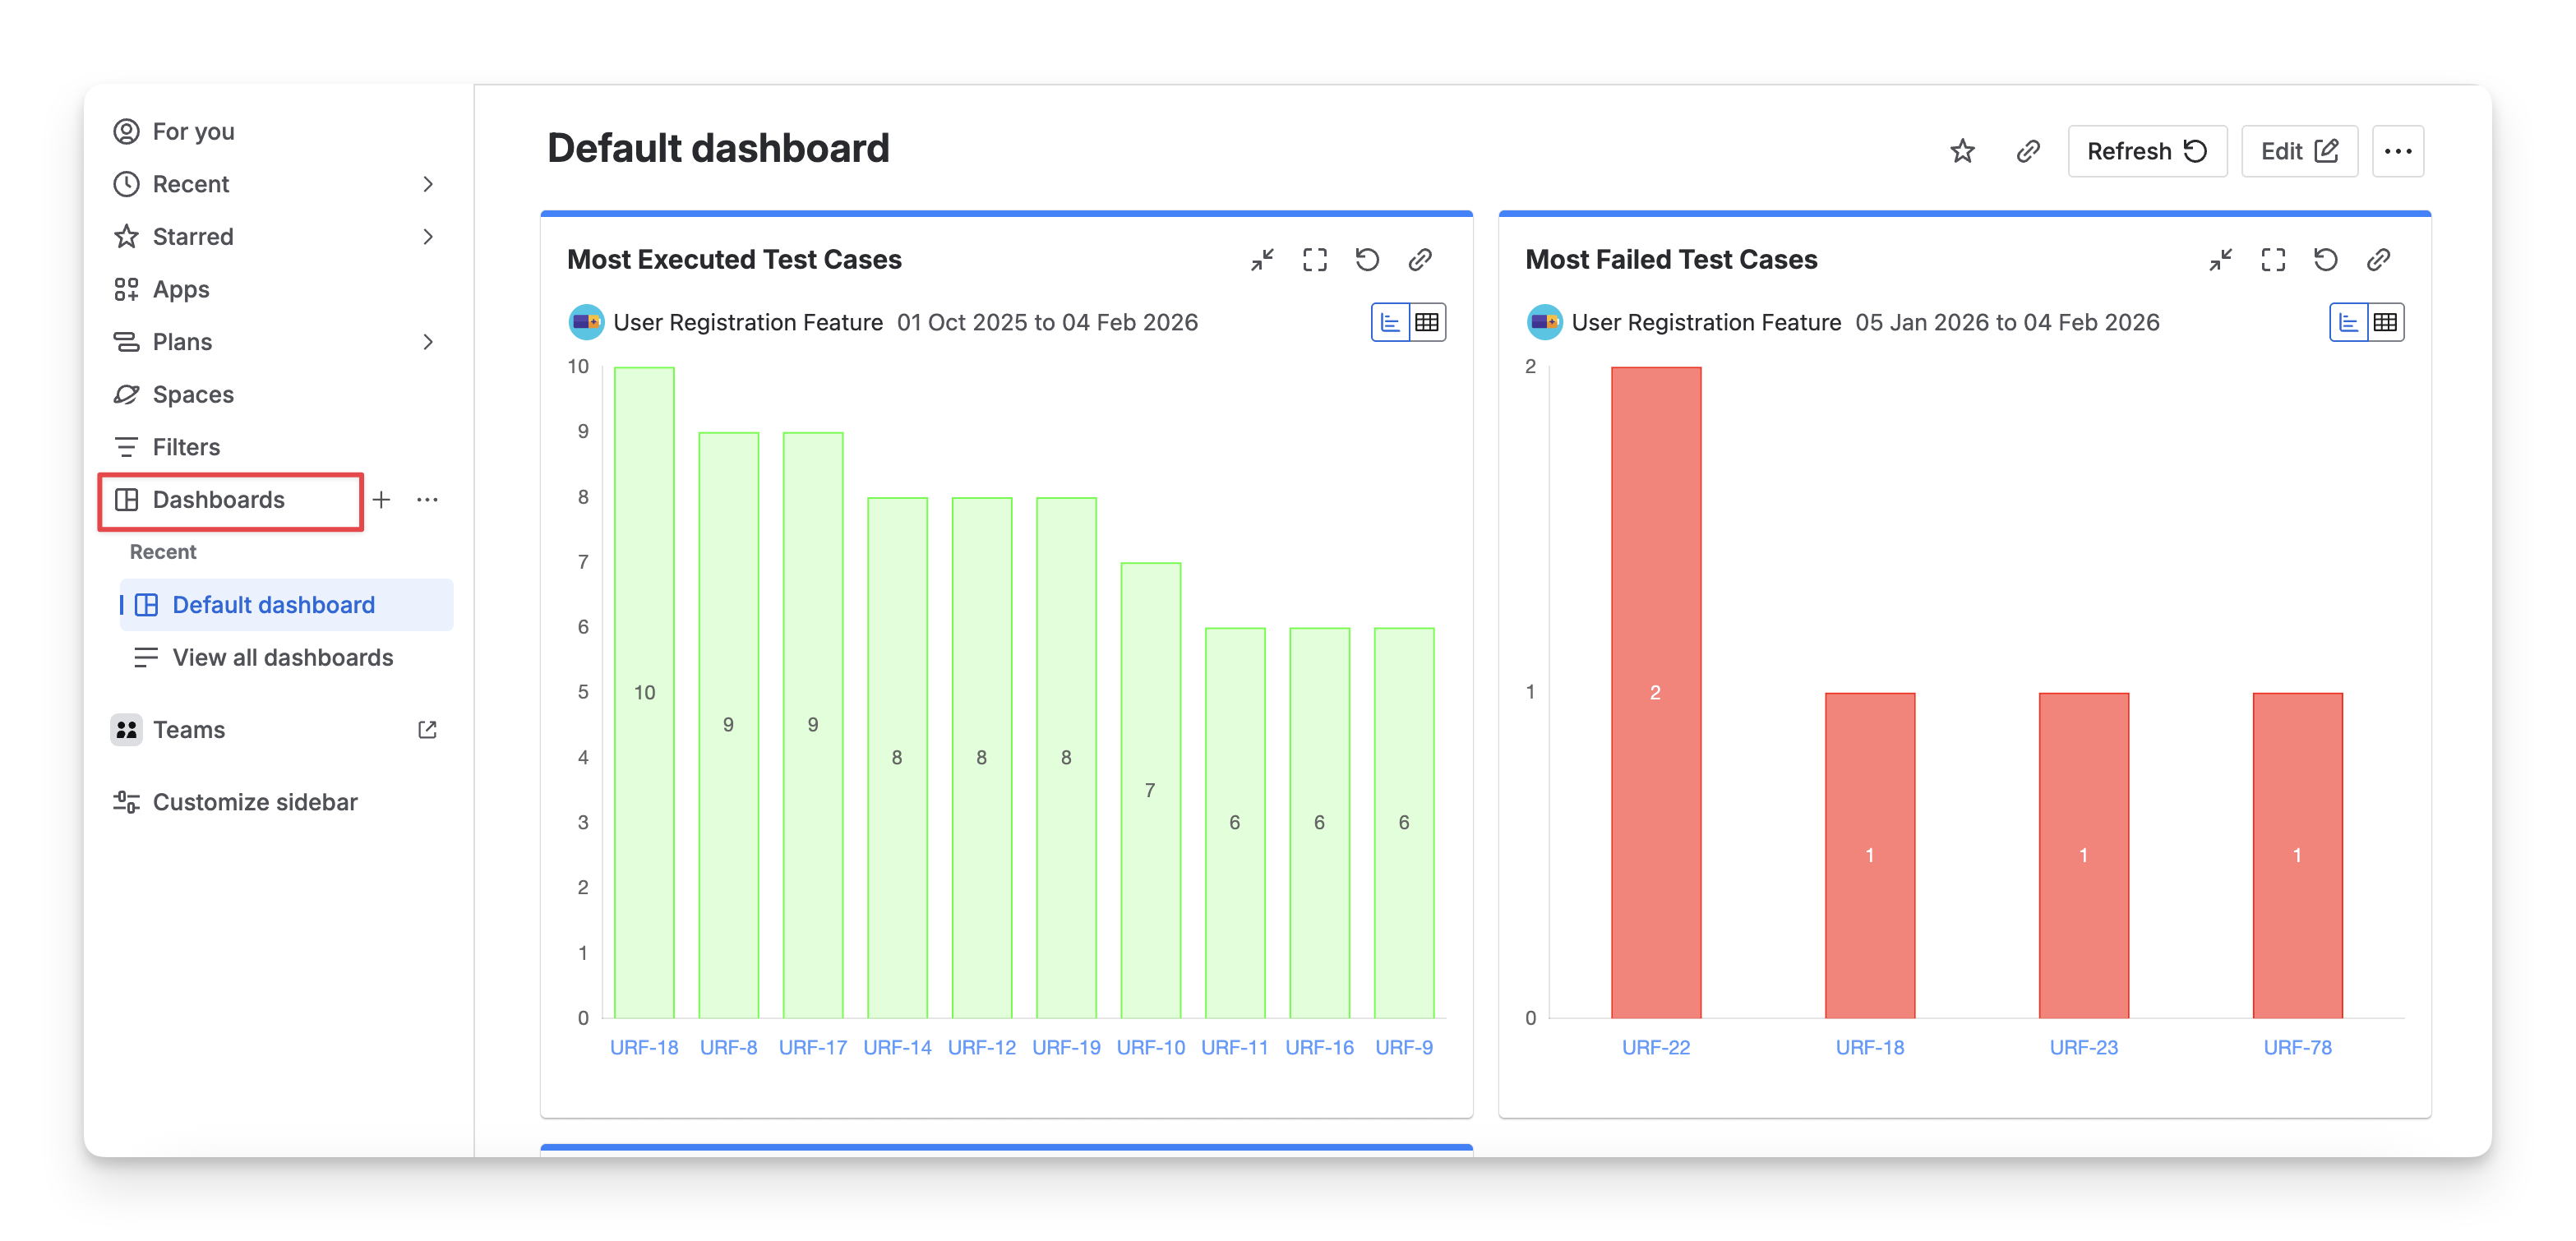
In this area, you can search for AgileTest widgets and add them to this board. Here's how:
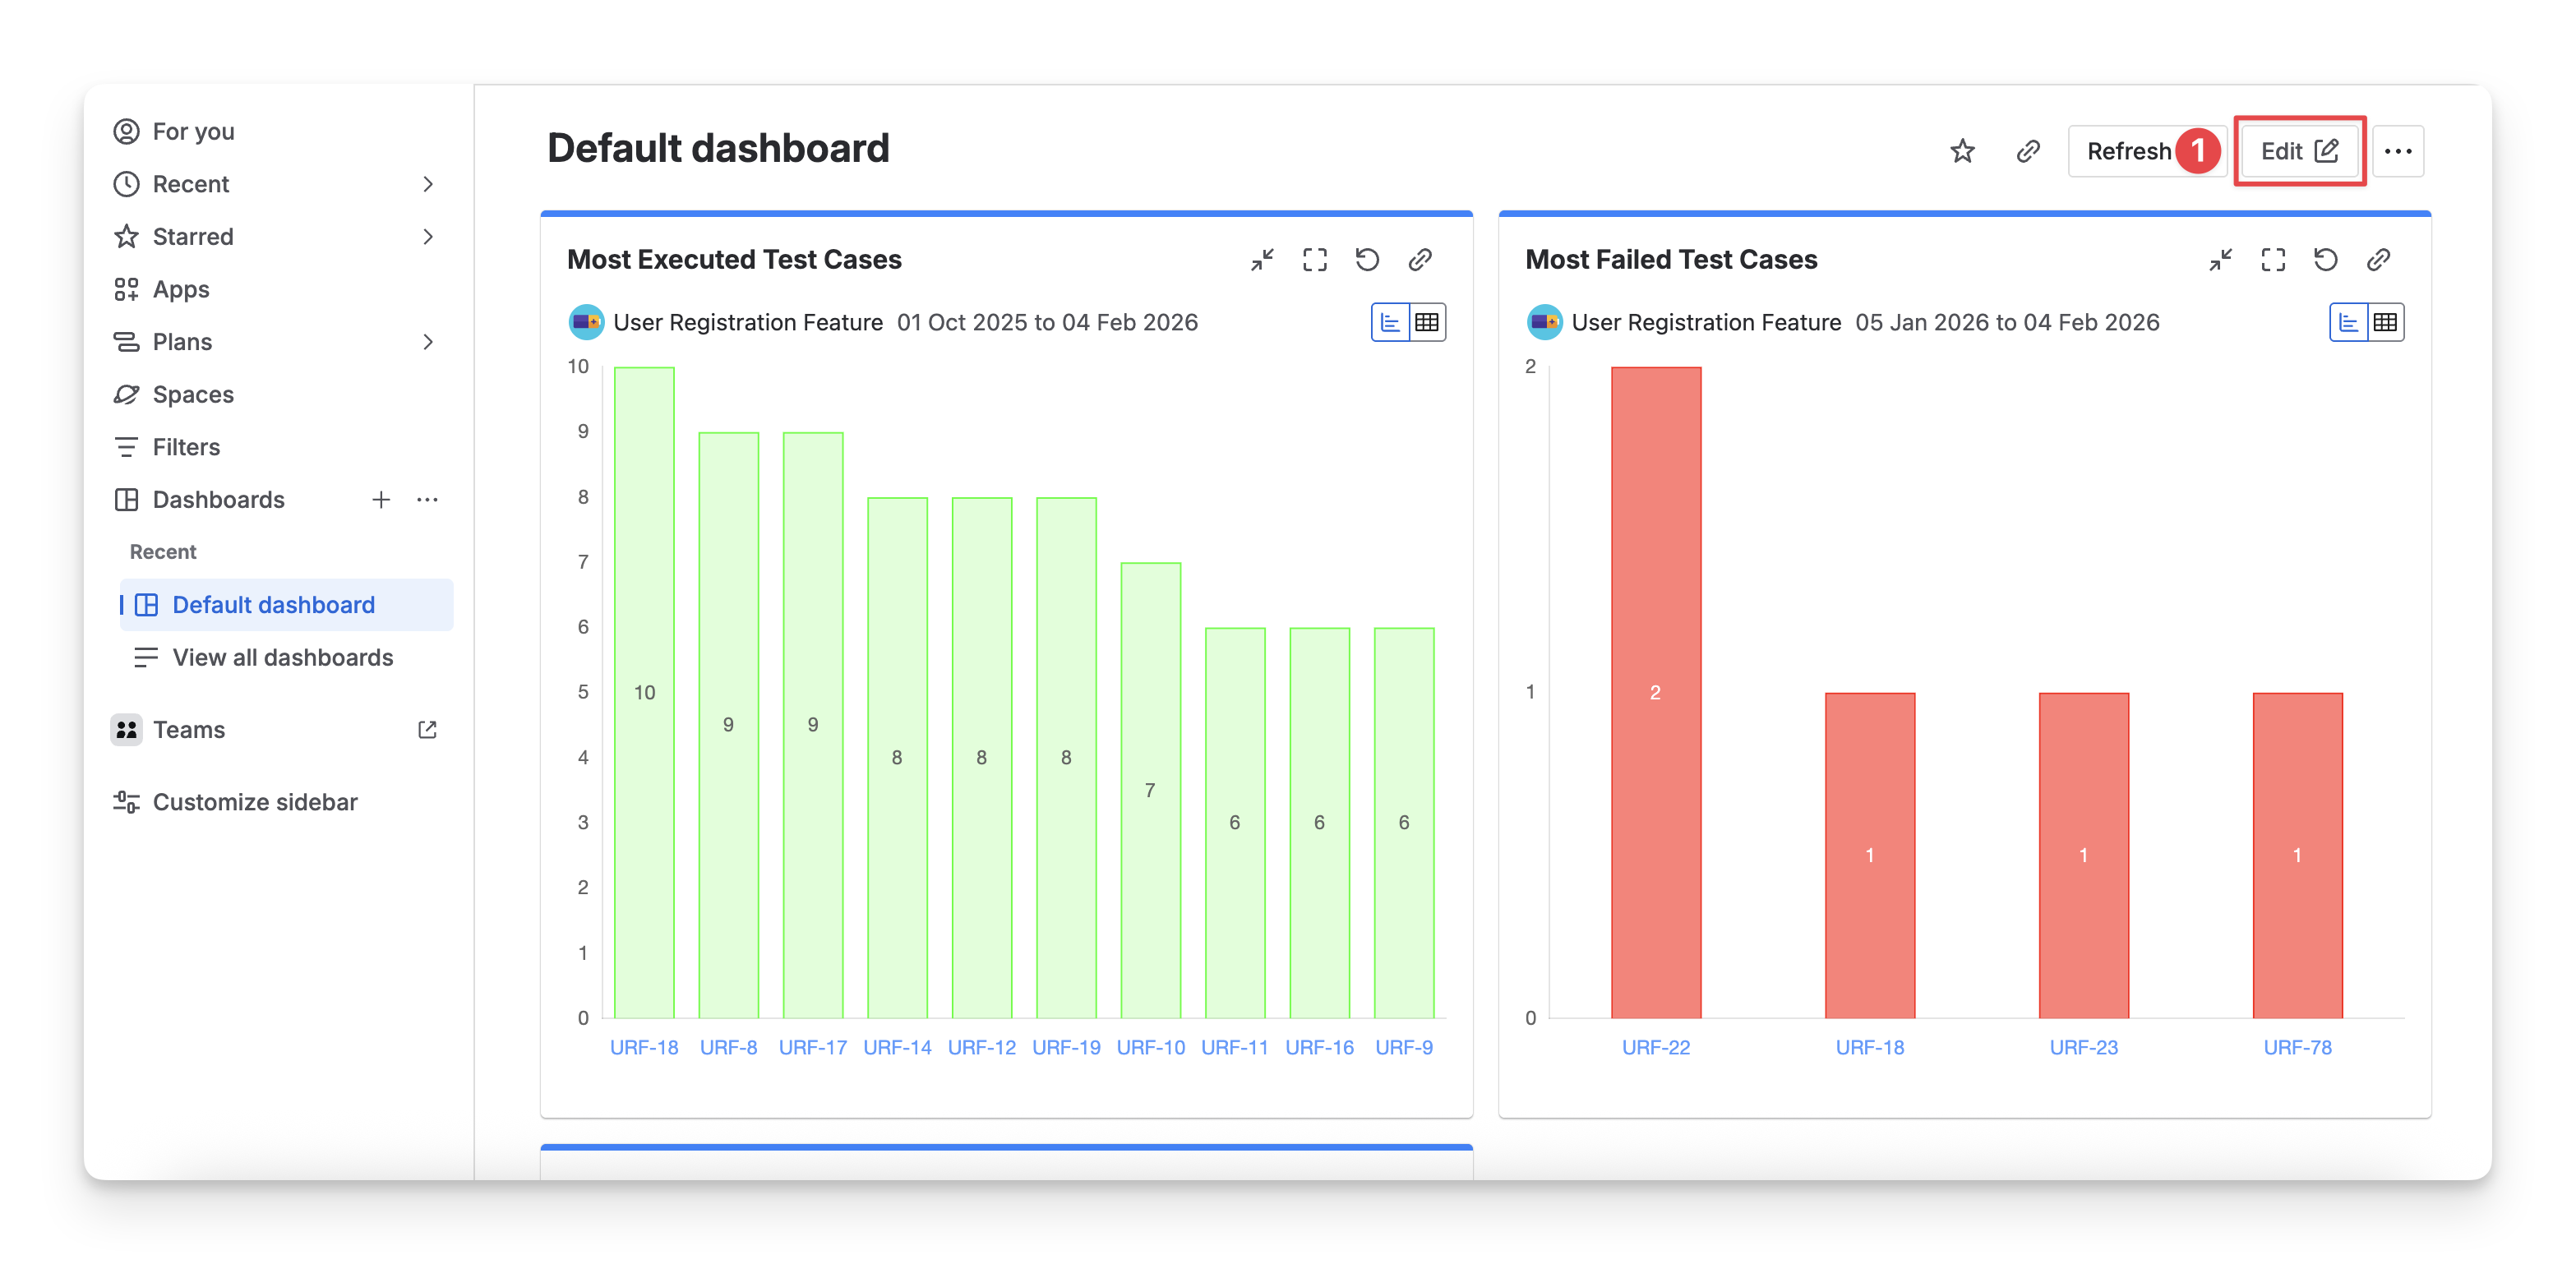
In the Jira Dashboard Screen, click on the “Edit” button.
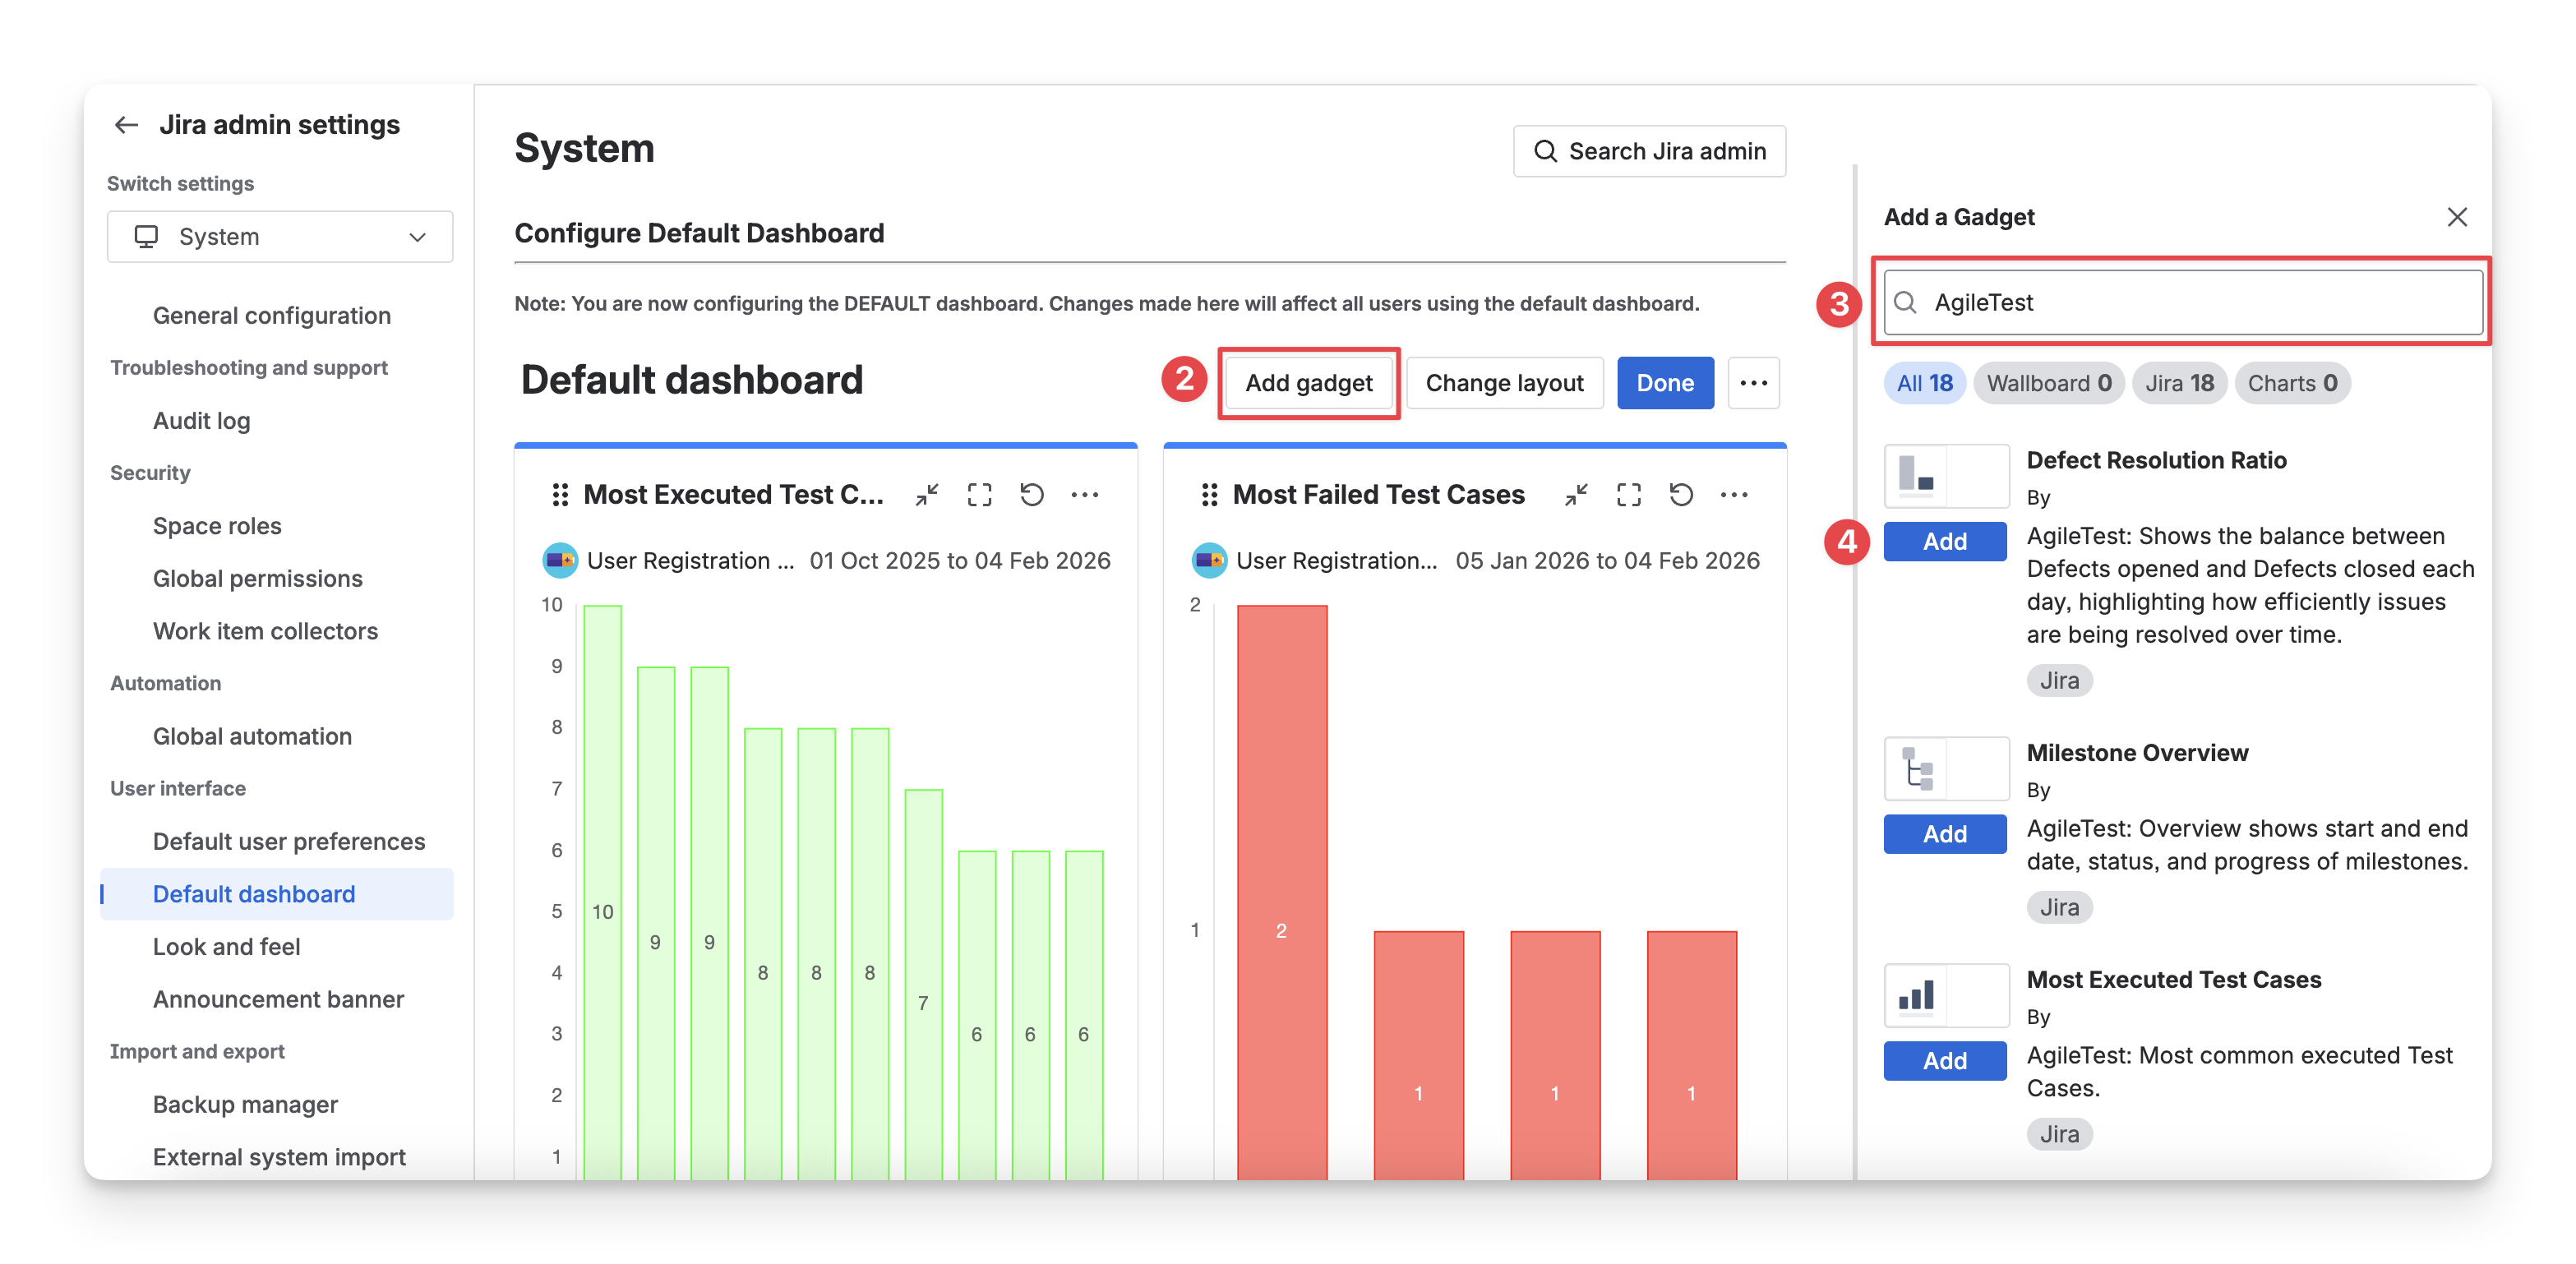
Select the “Add gadget” button.
A list of widgets will appear on your right-hand side. You can search for those supported by AgileTest.
Click the “Add” button for those widgets you want to use in the dashboard.
Each widget has its own configuration options. Complete the setup for each widget to ensure it displays the data and metrics you need.
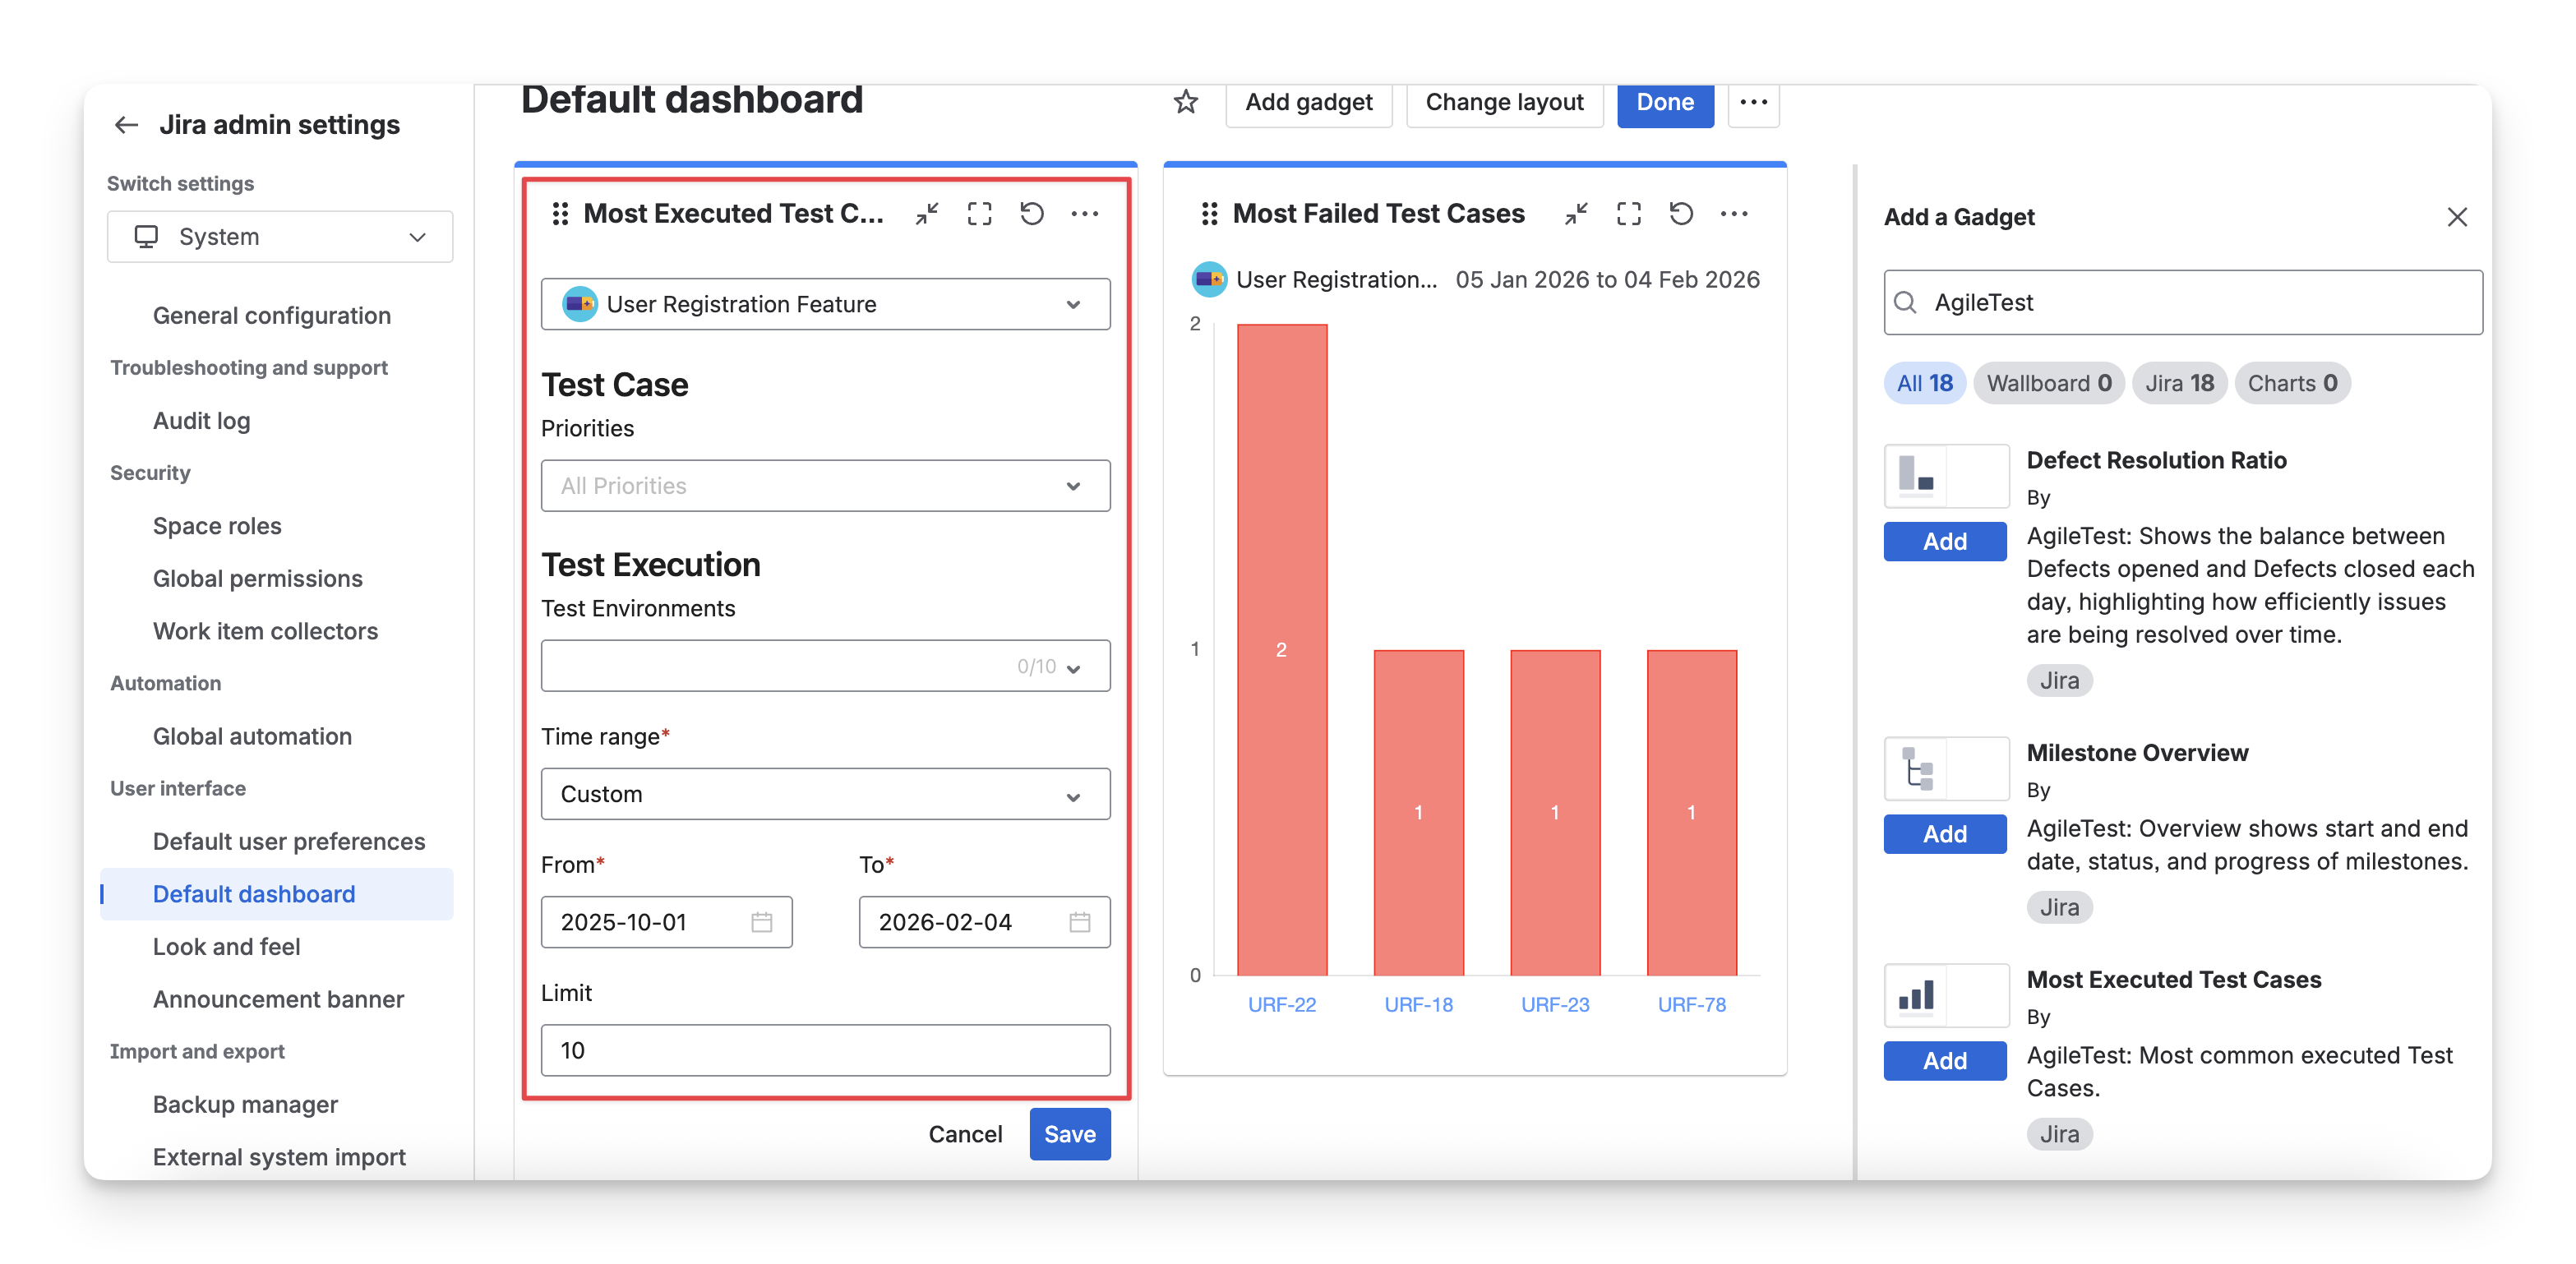
All configurations for the gadgets in AgileTest and Jira are almost identical. However, for the Jira dashboard, you must select the project to apply to each widget.
3. Manage Dashboard
In the AgileTest Dashboard, you can perform the following actions with widgets:
3.1 Edit Widget
You can reconfigure the widget settings by clicking on the :setting: icon on the top right-hand side of the widget.

3.2 Resize and Move Widget
You can also resize and move the widget in the AgileTest dashboard to adjust the widget space and arrange the overall structure of the dashboard.
3.3 Switch Widget From Chart to Table
Some widgets allow you to switch the display format from chart -> table and table → chart.
Chart Display Format: Best for visual analysis and trend tracking. Charts help you quickly understand patterns, comparisons, and overall status at a glance.
Table Display Format: Best for detailed review and data inspection. Tables allow you to see exact values, compare individual records, and scan detailed information.
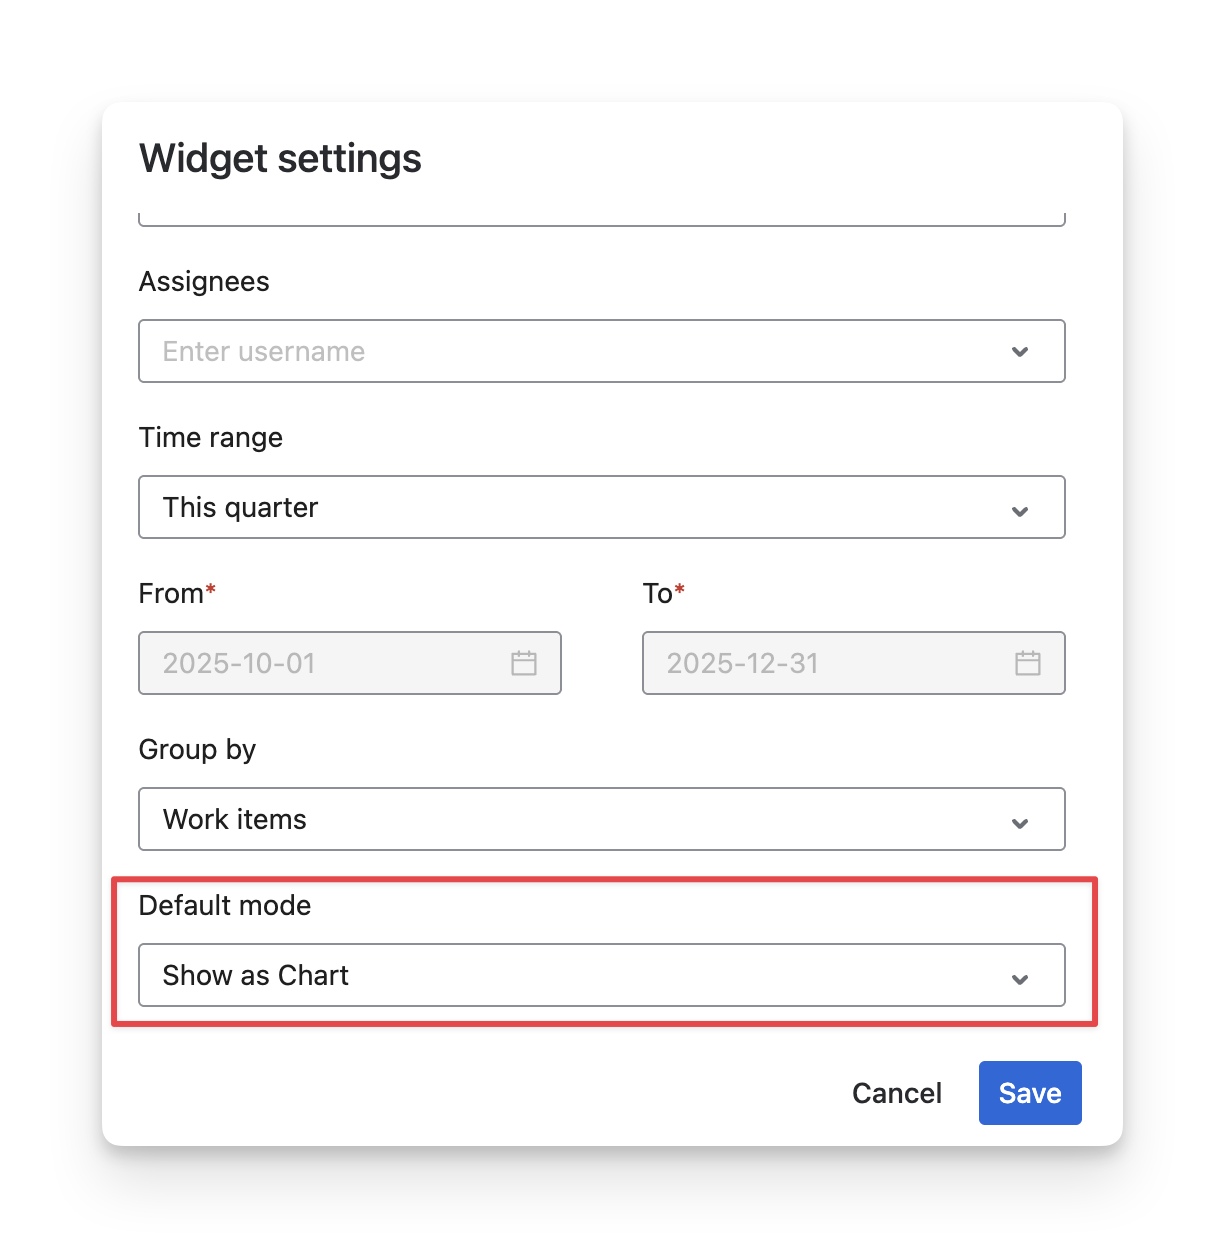
To do this, select the options Show as Chart/Table in the Default mode dropdown in the settings of these widgets.
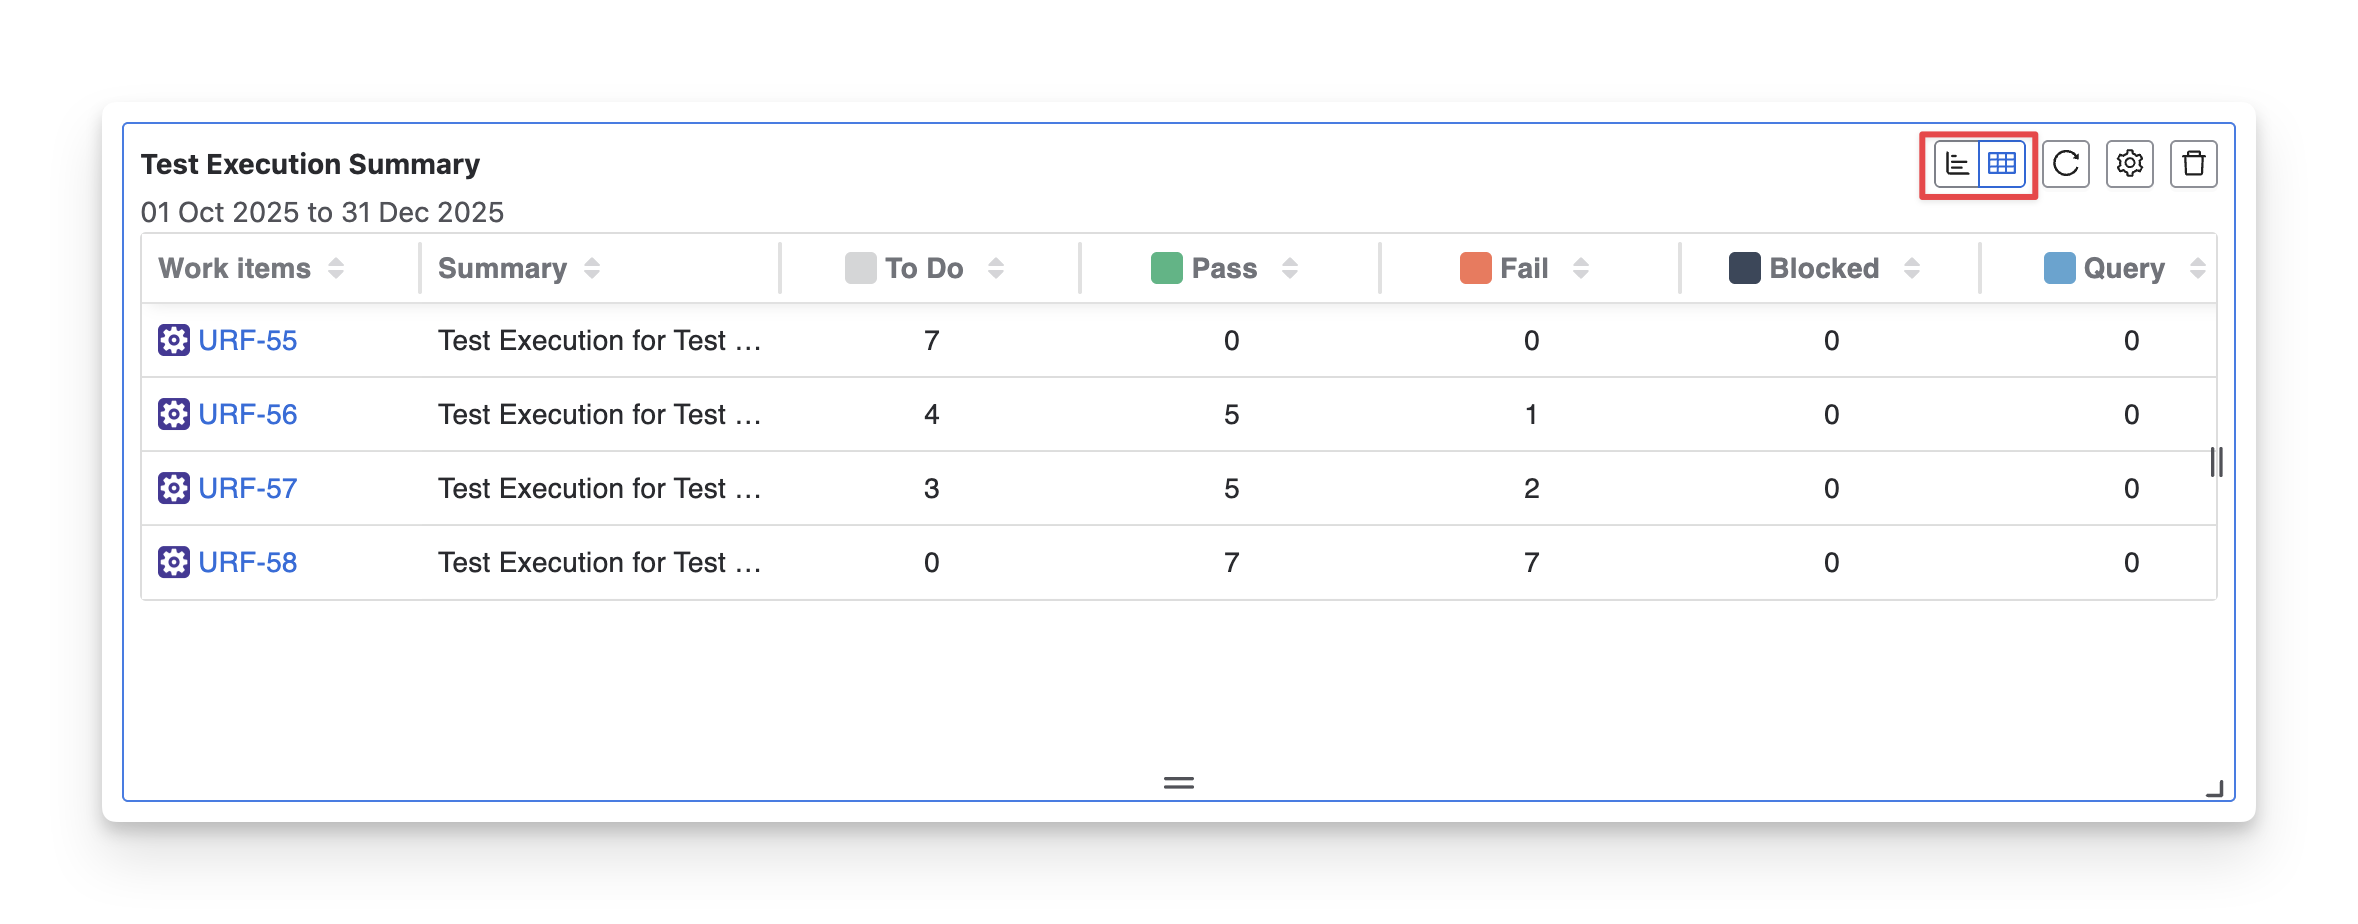
Or, you can also quickly change the format with the Switching button on the top right-hand side of the gadget.
3.4 Delete Widget
To delete the widget, you can click on the :delete_icon: icon on the top right-hand side of the widget.

Currently, AgileTest supports you with the following widgets:
Should you need any assistance or further AgileTest inquiries, contact our 24/7 Support Desk!
.png)