.png)
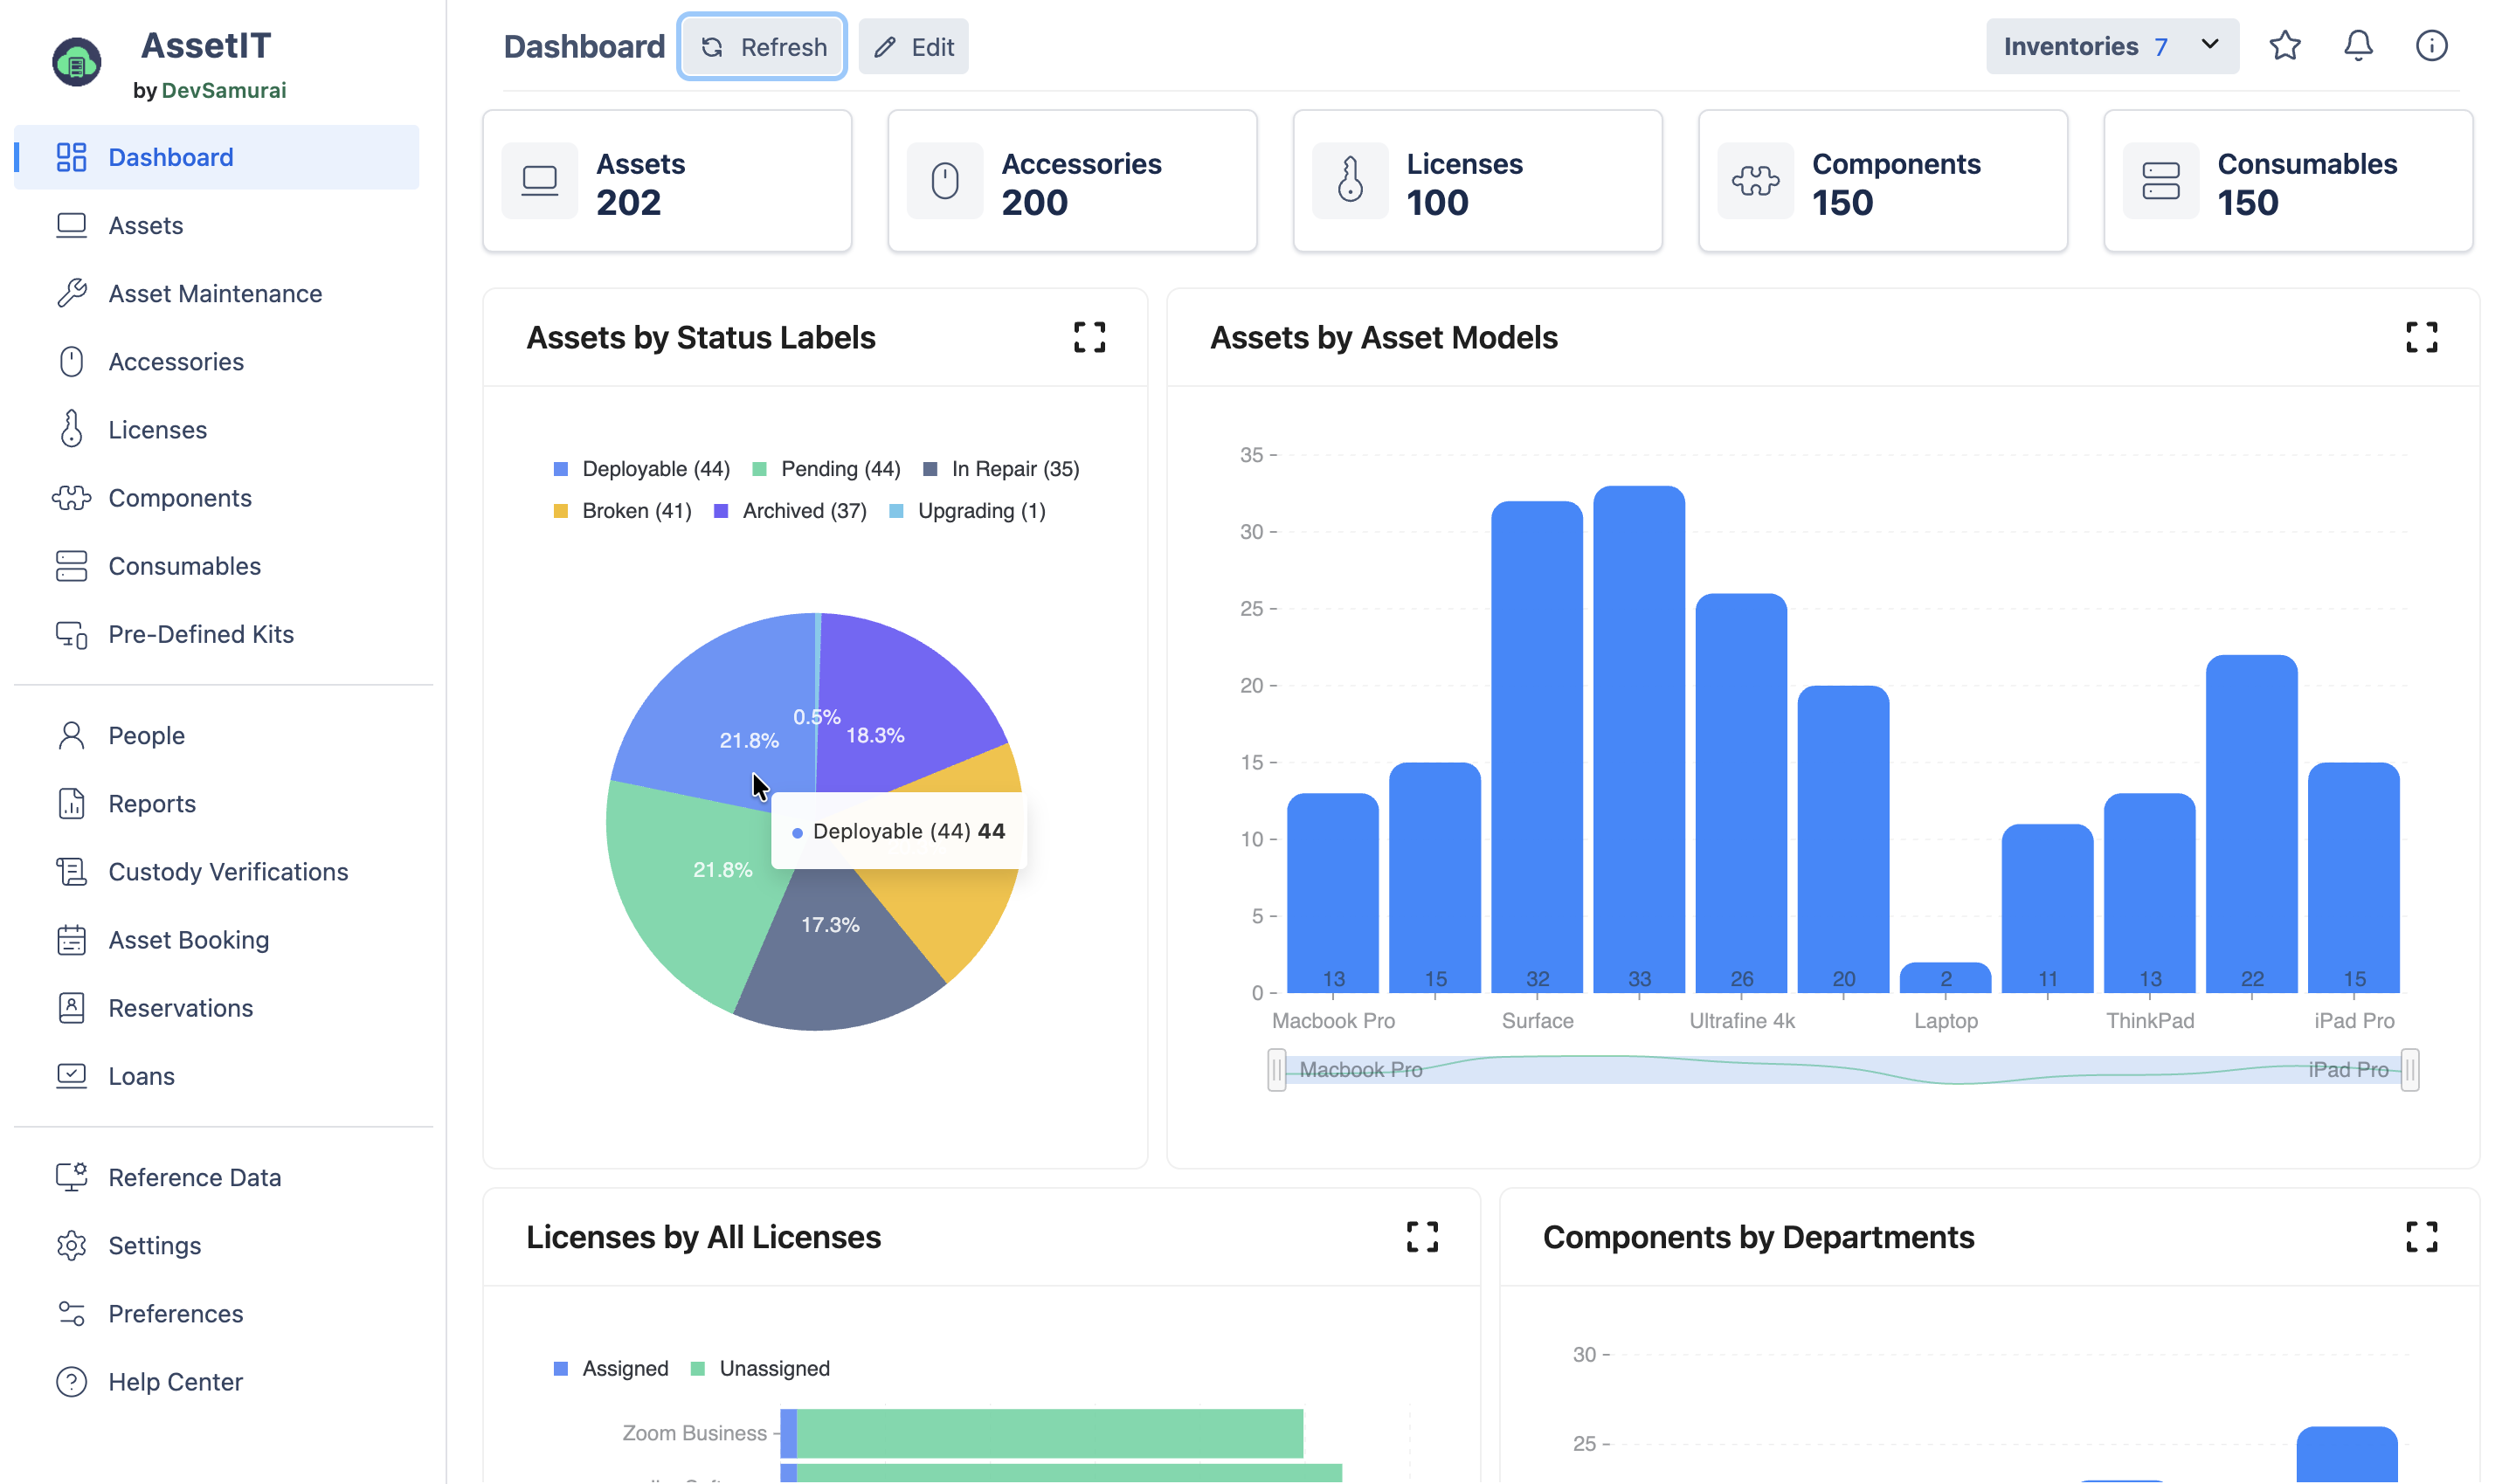
The AssetIT Dashboard helps you monitor asset status, visualize key metrics, and identify trends for analysis and forecasting.
You can create and manage dashboards in two ways: by using the built-in Dashboard in AssetIT or by adding the AssetIT Gadget to a Jira dashboard.
Dashboard in AssetIT
The Dashboard in AssetIT gives you a clear overview of key asset data. You can customize charts and layouts to focus on the metrics that matter most to your team.
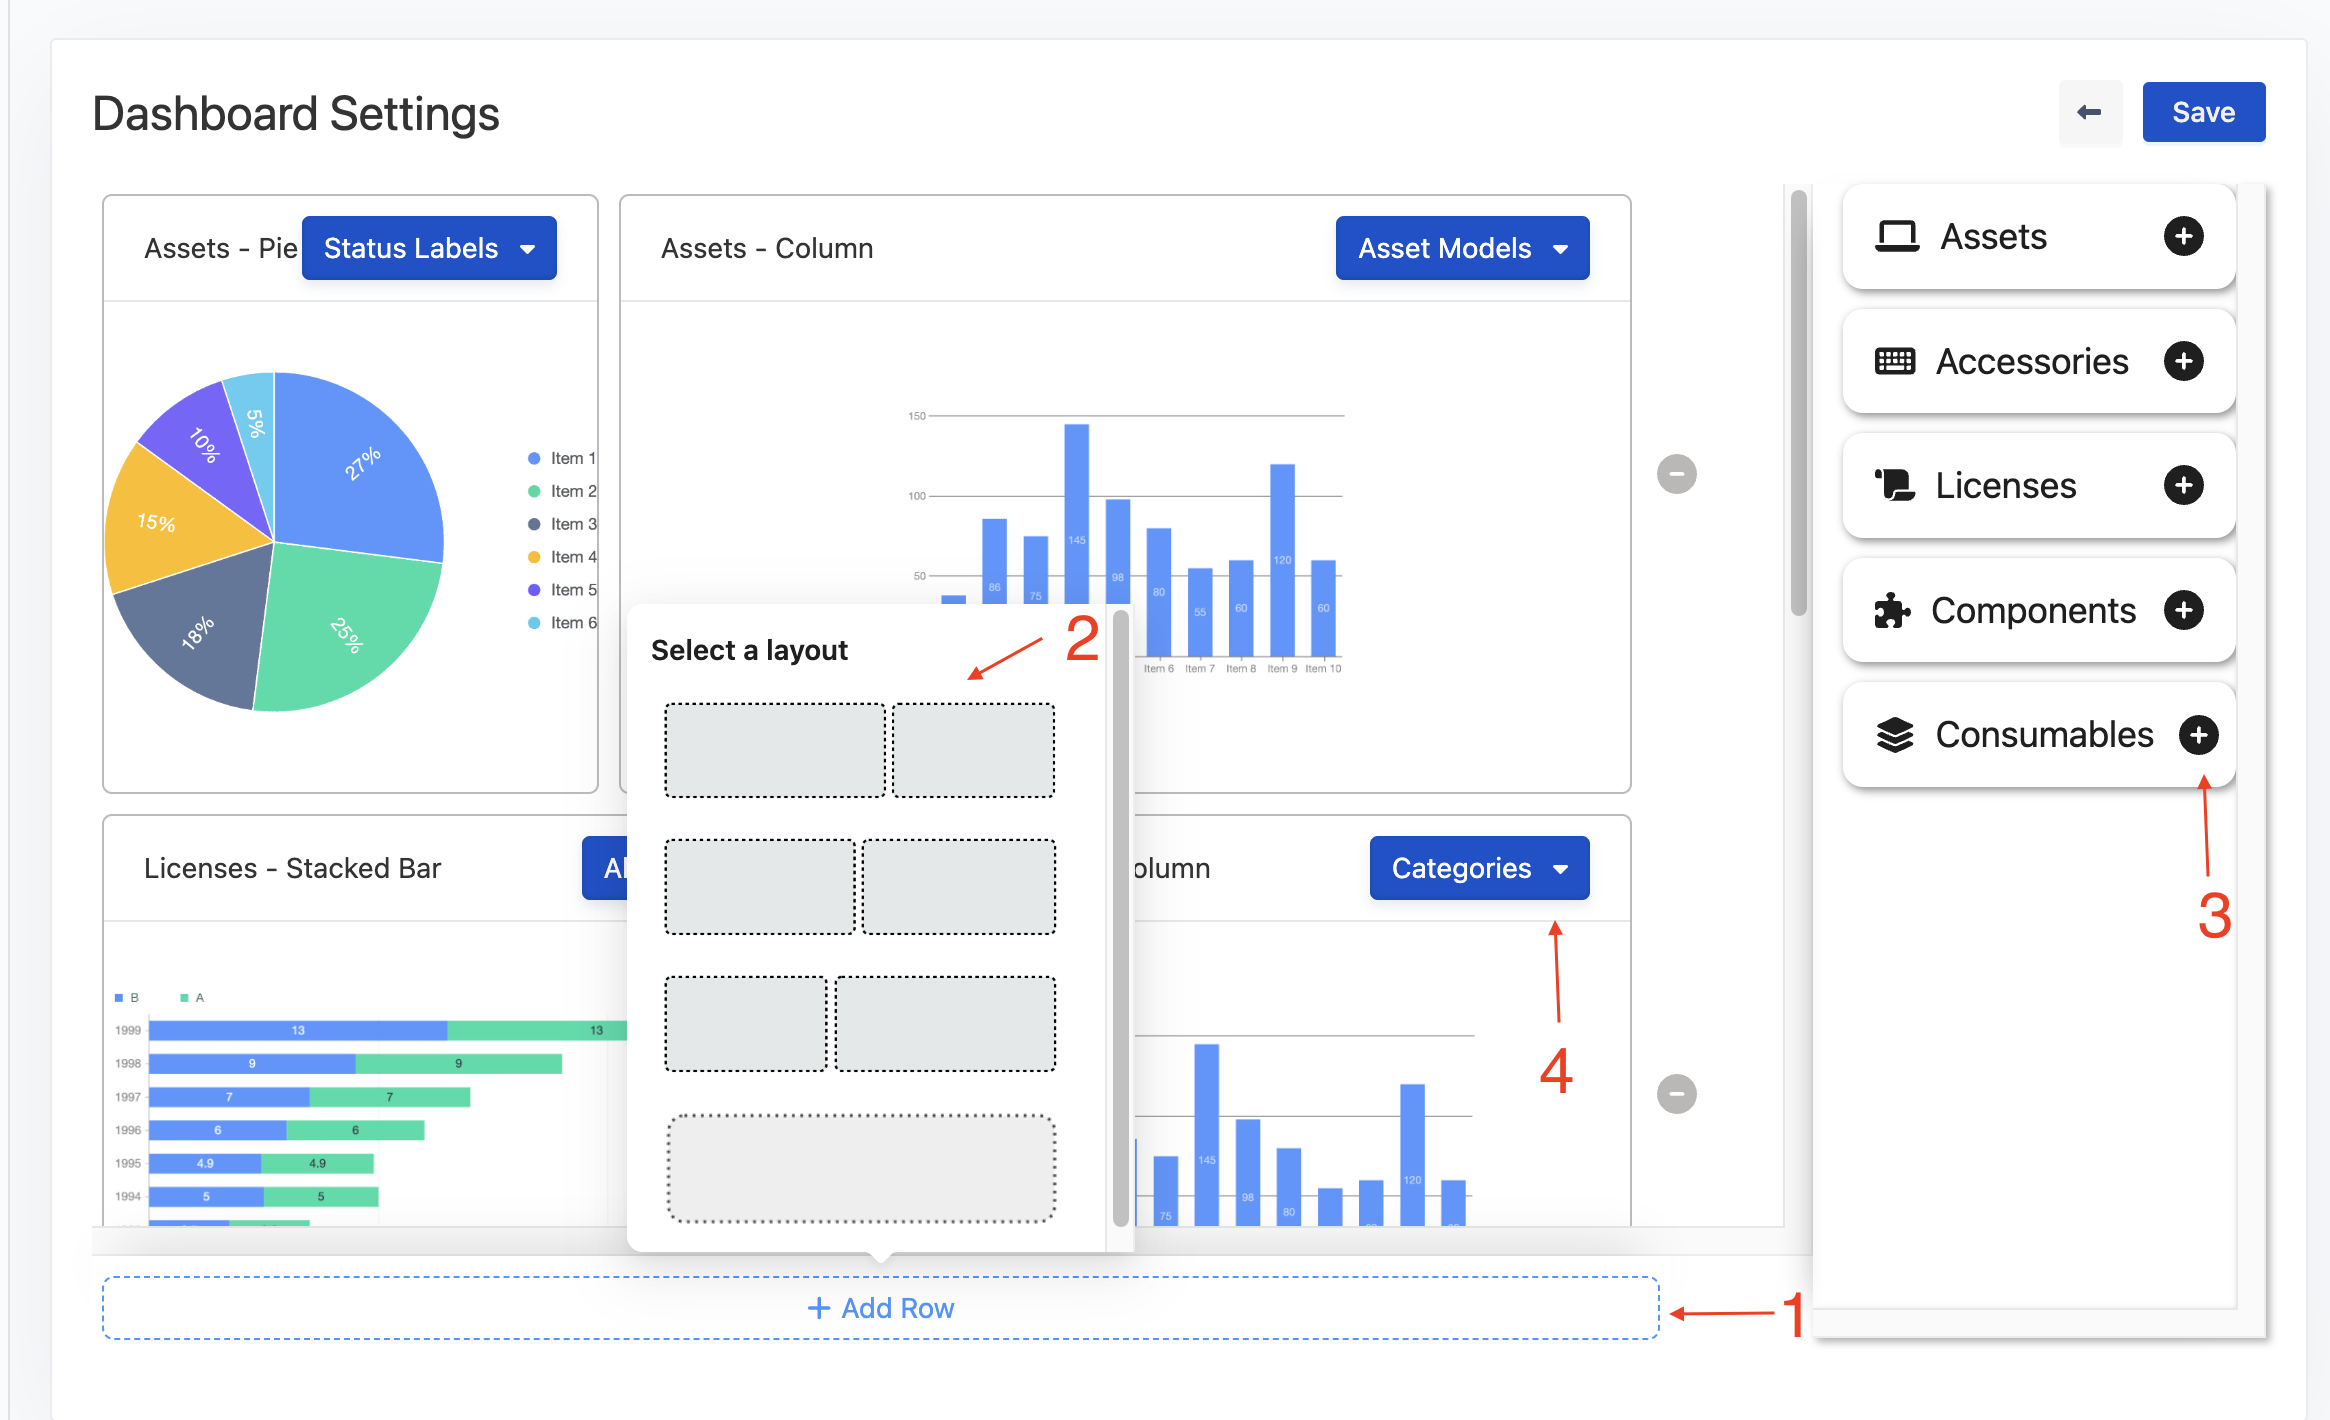
How to customize the Dashboard in AssetIT
Click on the :pen_: Edit button to access the dashboard settings.
-
Click Add Row at the bottom of the dashboard.
-
Select your preferred layout from the list.
-
In the right sidebar, choose the resource you want to display, such as
Assets,Accessories,Licenses,Components, orConsumables. -
Drag and drop a chart type onto the dashboard, such as pie, bar, column, stacked bar, or table.
-
For each chart, select the data attribute you want to show. Available attributes may include
Asset Models,Categories,Departments,Locations,Linked Issues,Status Labels, andSuppliers.
AssetIT Gadget in Jira Dashboard
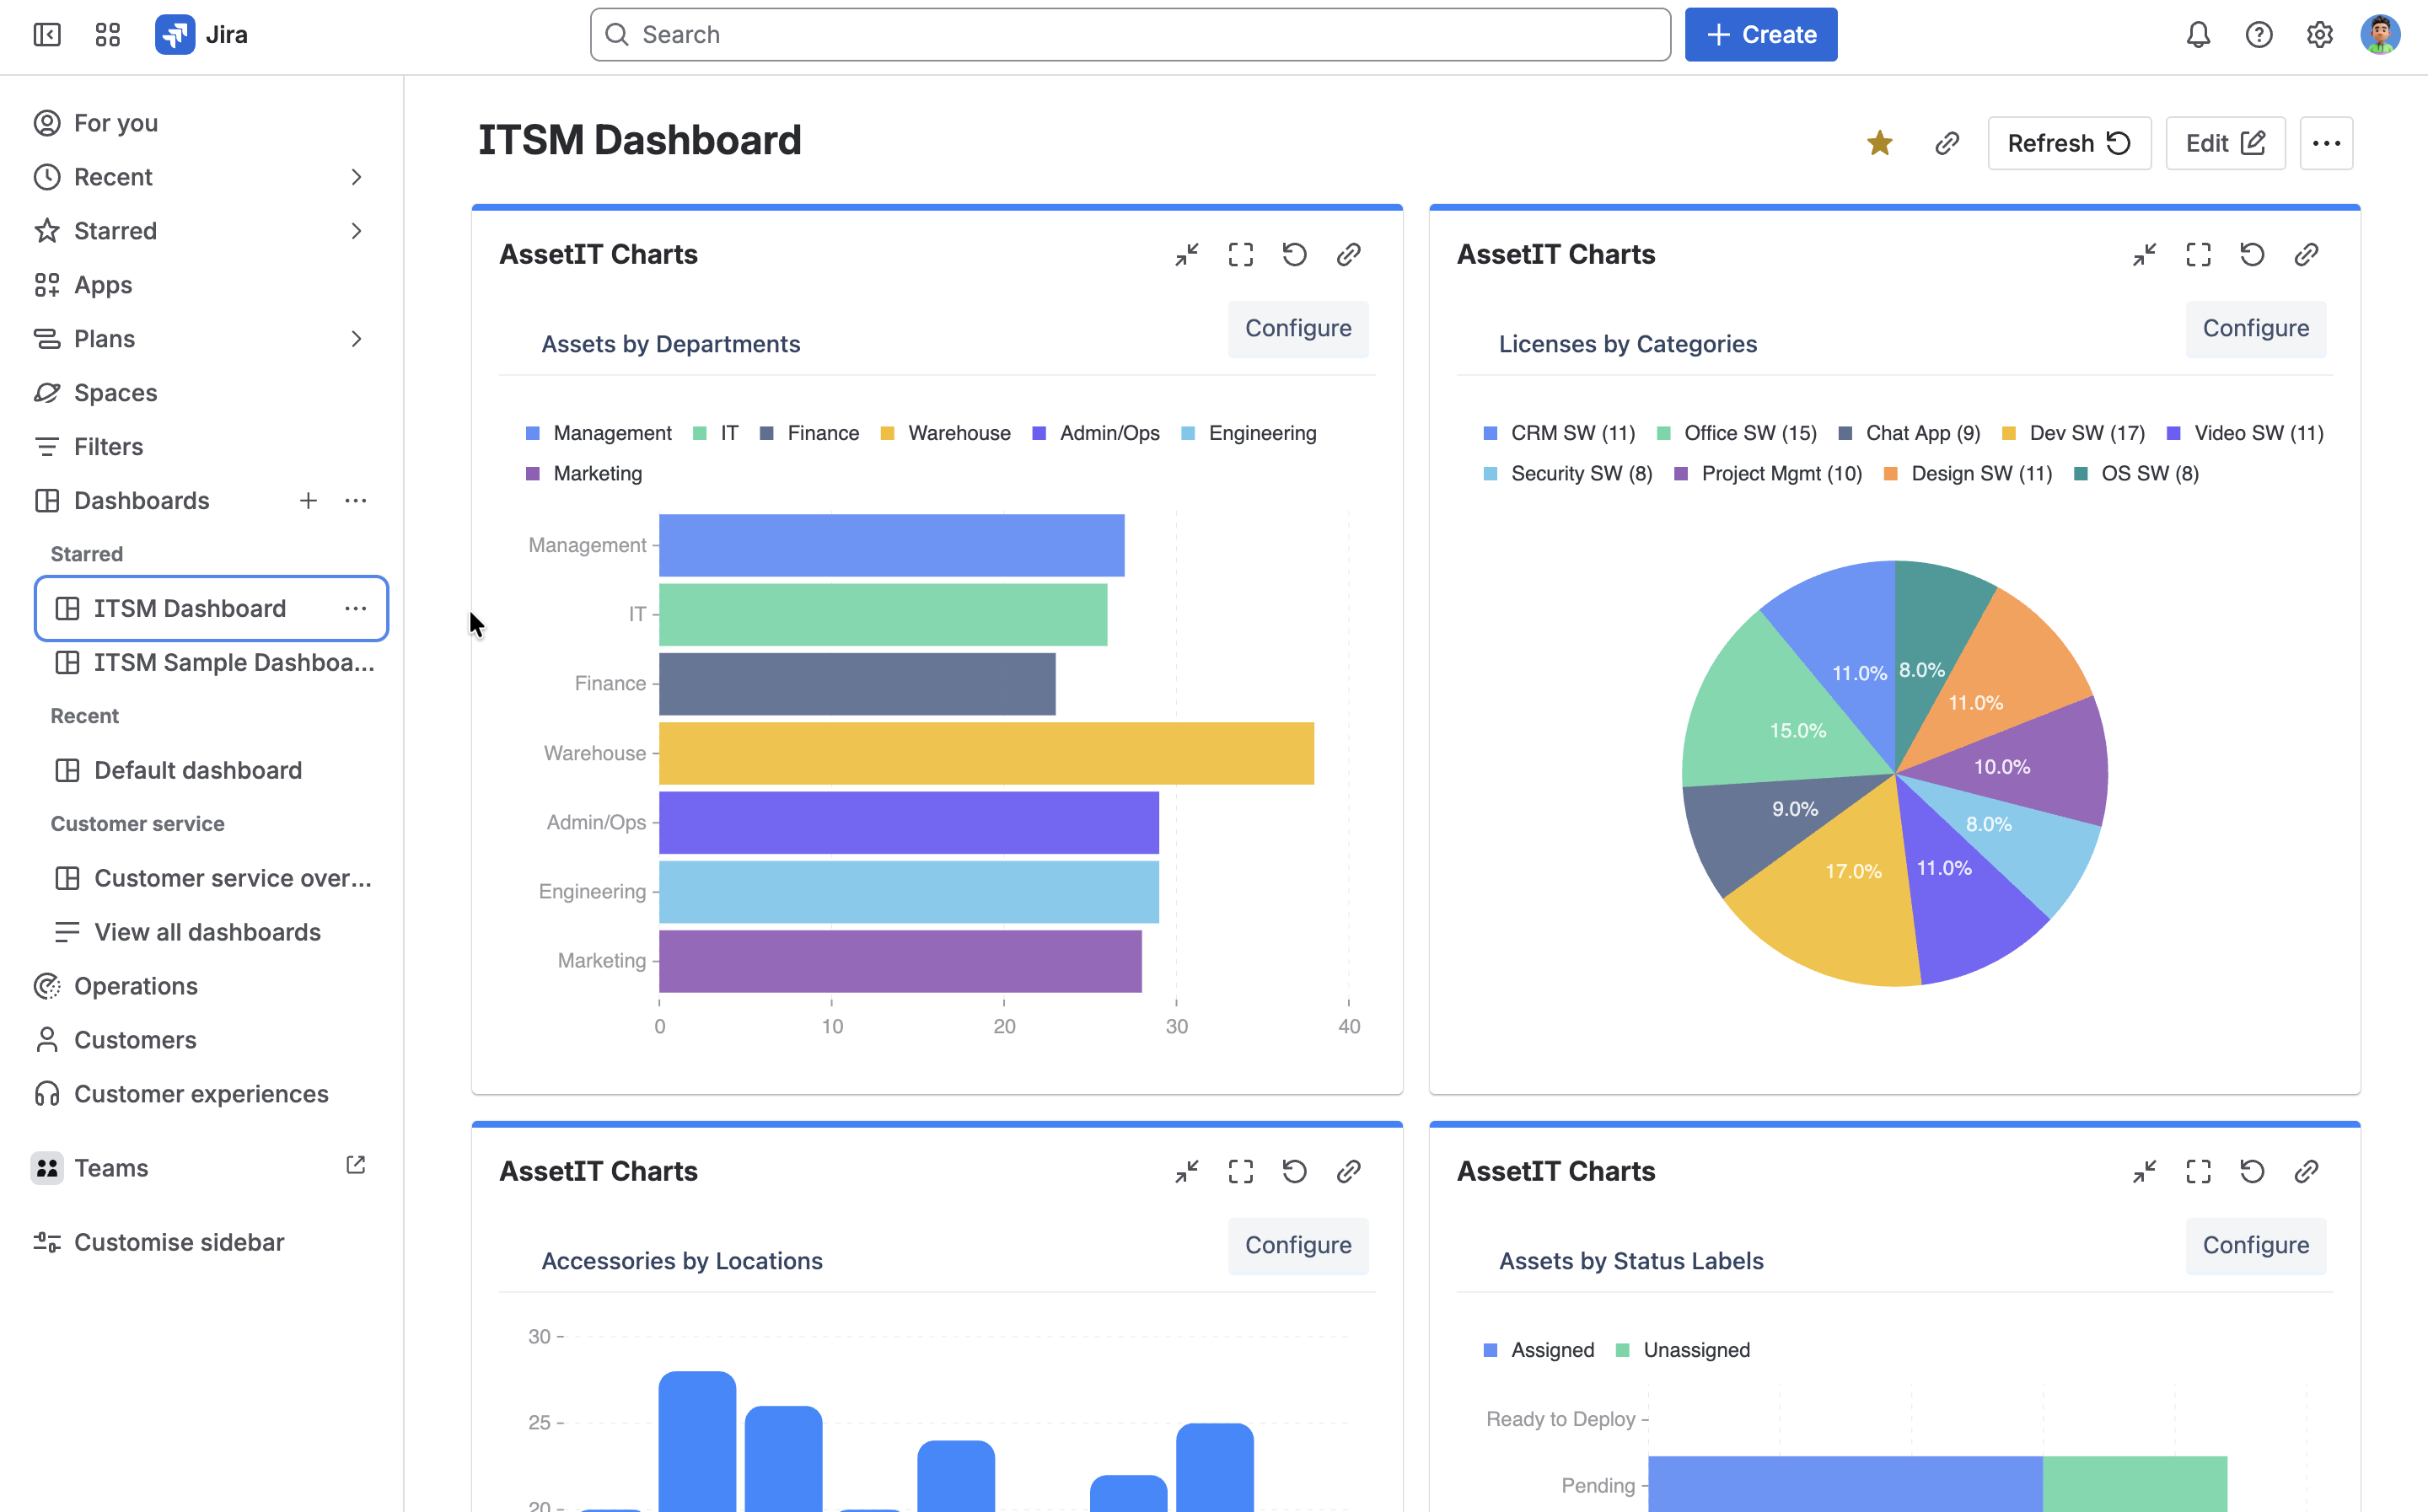
The AssetIT Gadget lets you view AssetIT asset and resource insights directly from a Jira dashboard, without opening the AssetIT app.
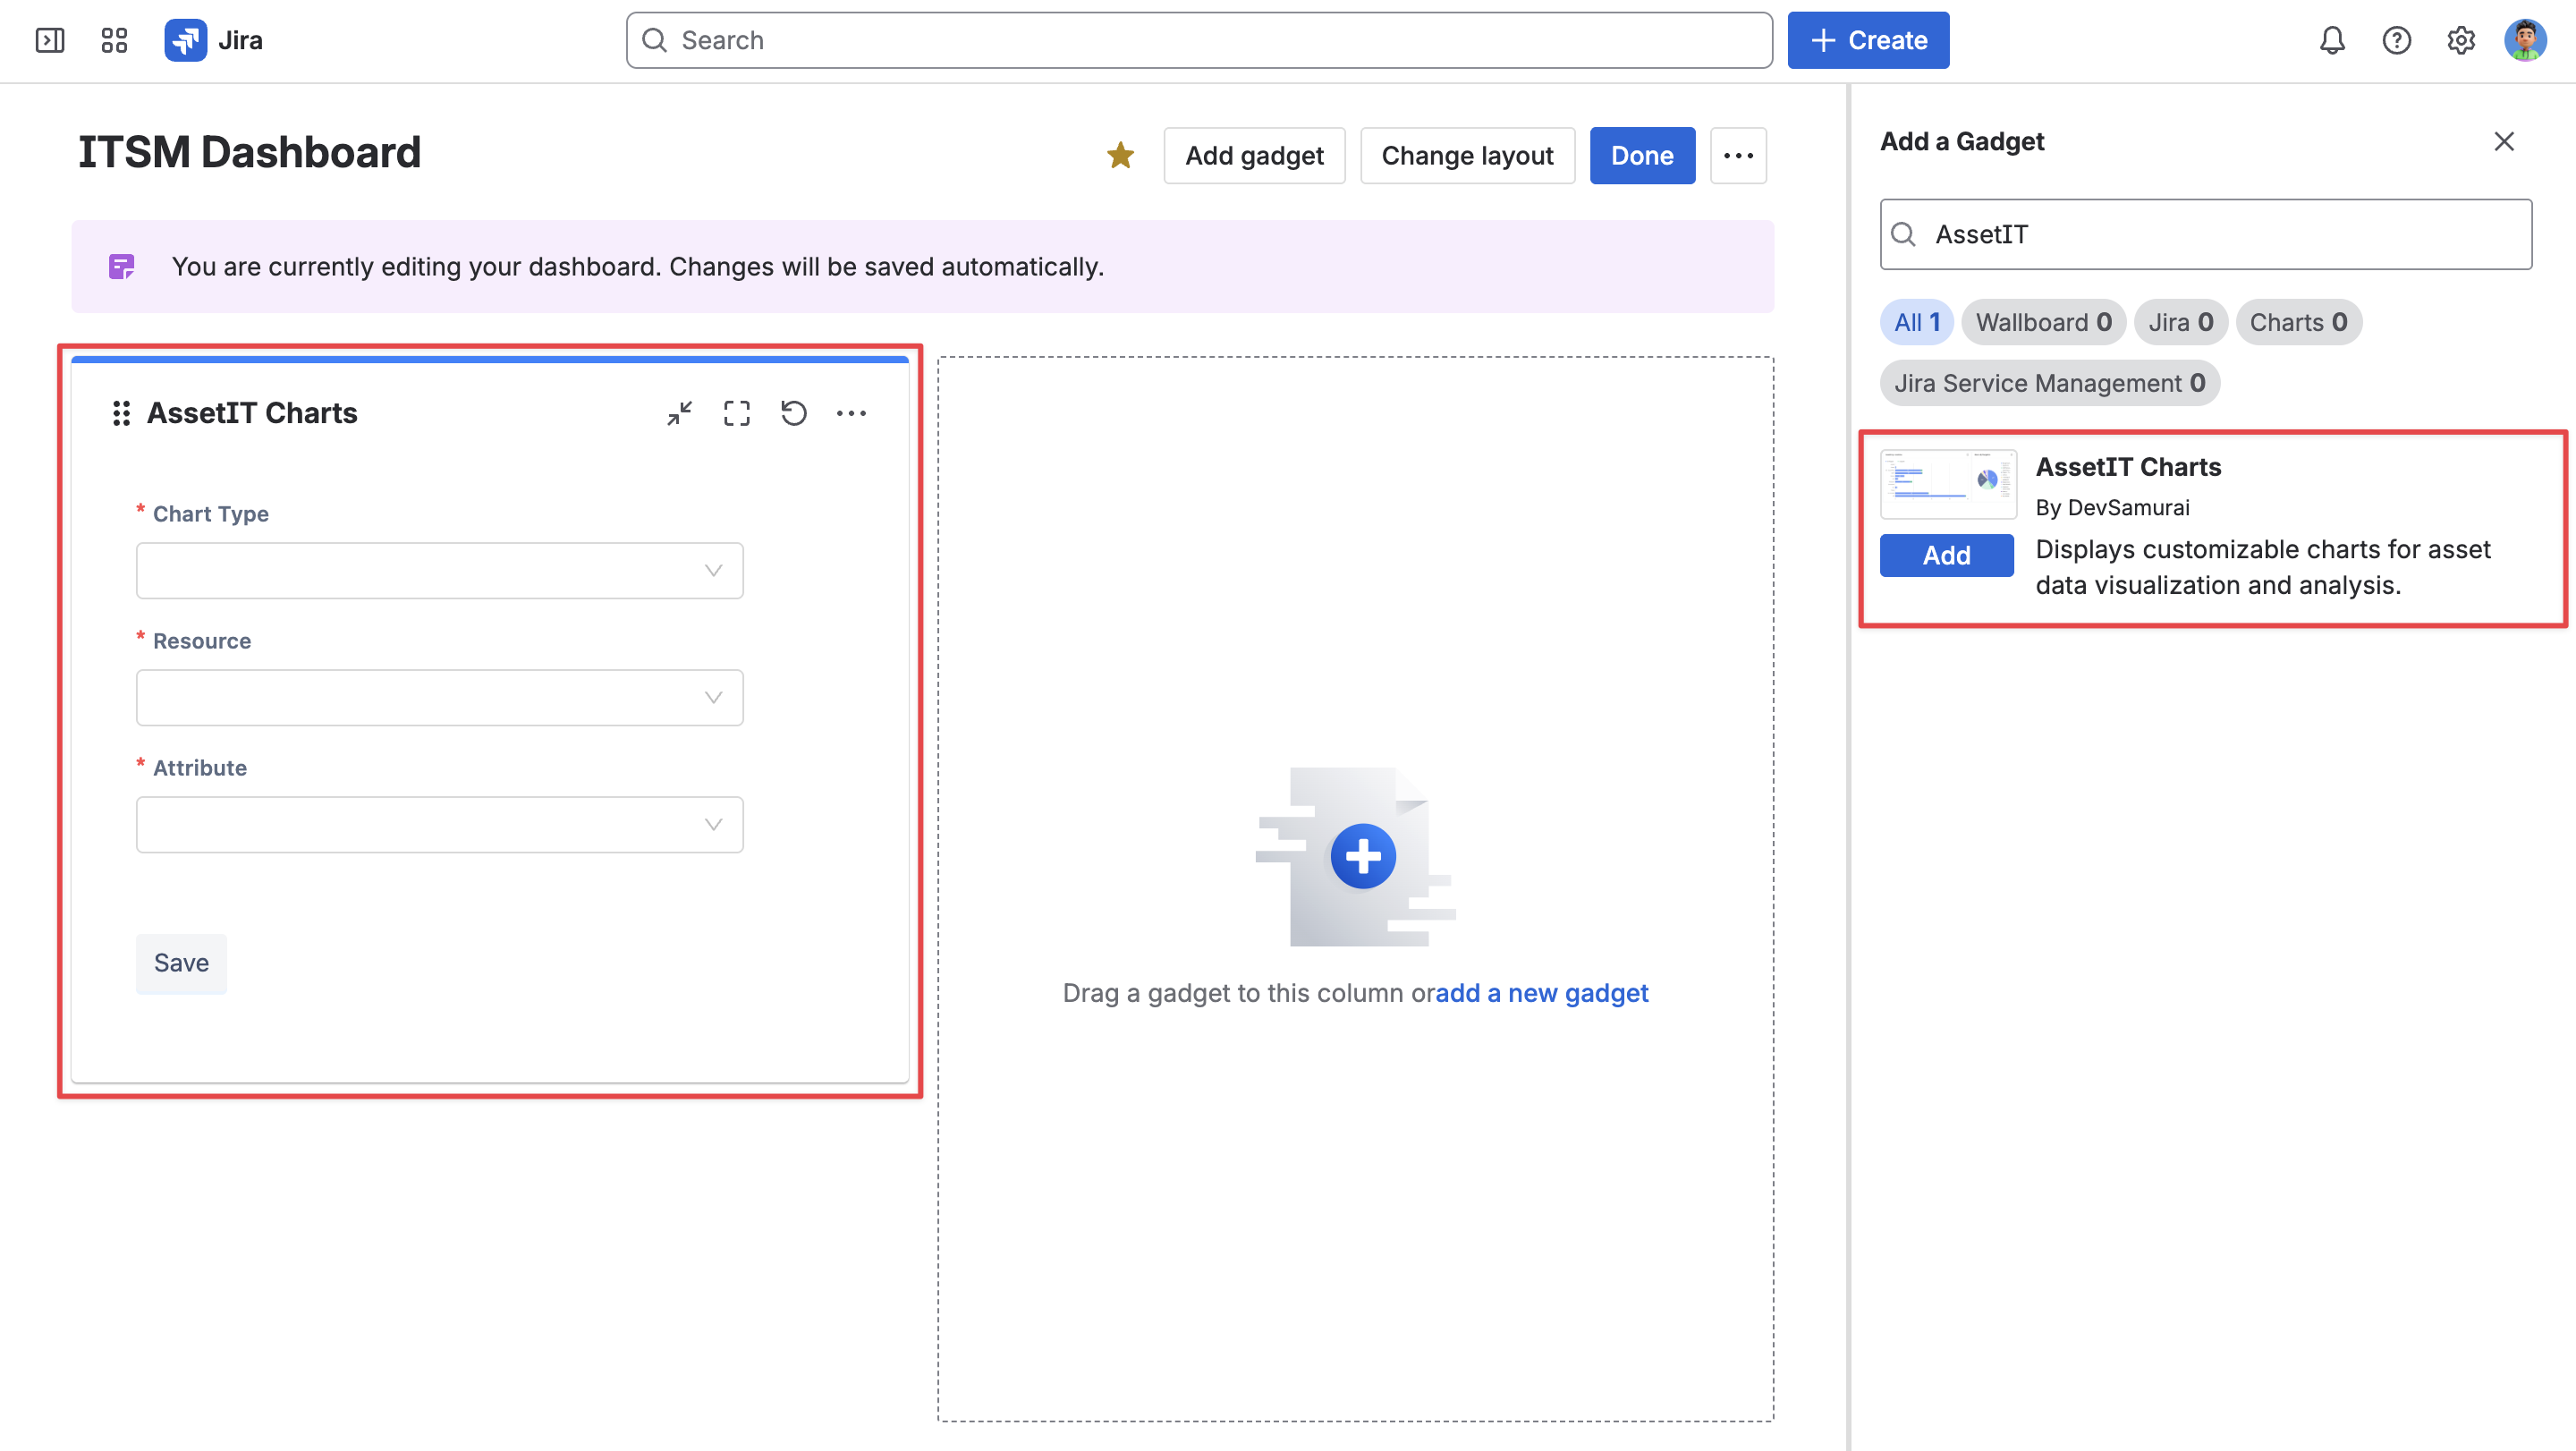
How to add the AssetIT Gadget to your Jira dashboard
From the Dashboards option in the Jira sidebar, open an existing dashboard or create a new one (learn more).
-
Click Edit to enter edit mode, then select Add gadget.
-
In the Add a Gadget panel, search for AssetIT Charts by Devsamurai.
-
Click Add on the gadget to add it to the dashboard.
-
Move the gadget to the desired position, then click Done to save the dashboard layout.
-
Configure the following settings for the gadget:
-
Chart type:
Pie,Bar,Stacked Bar, orColumn -
Resource:
Assets,Accessories,Licenses,Components, orConsumables -
Attributes: available options depend on the selected resource and may include
Asset Models,Categories,Departments,Locations,Linked Issues,Status Labels, andSuppliers
-
-
Click Save to display the chart.
-
To update the chart later, click Configure and adjust the settings.
Repeat these steps for any additional charts you want to add to the dashboard.