.png)
In GanttTable, there are 2 main views you will be working with: the Table view and the Gantt view. Each view provides a different way of managing and visualizing your Jira projects and issues.
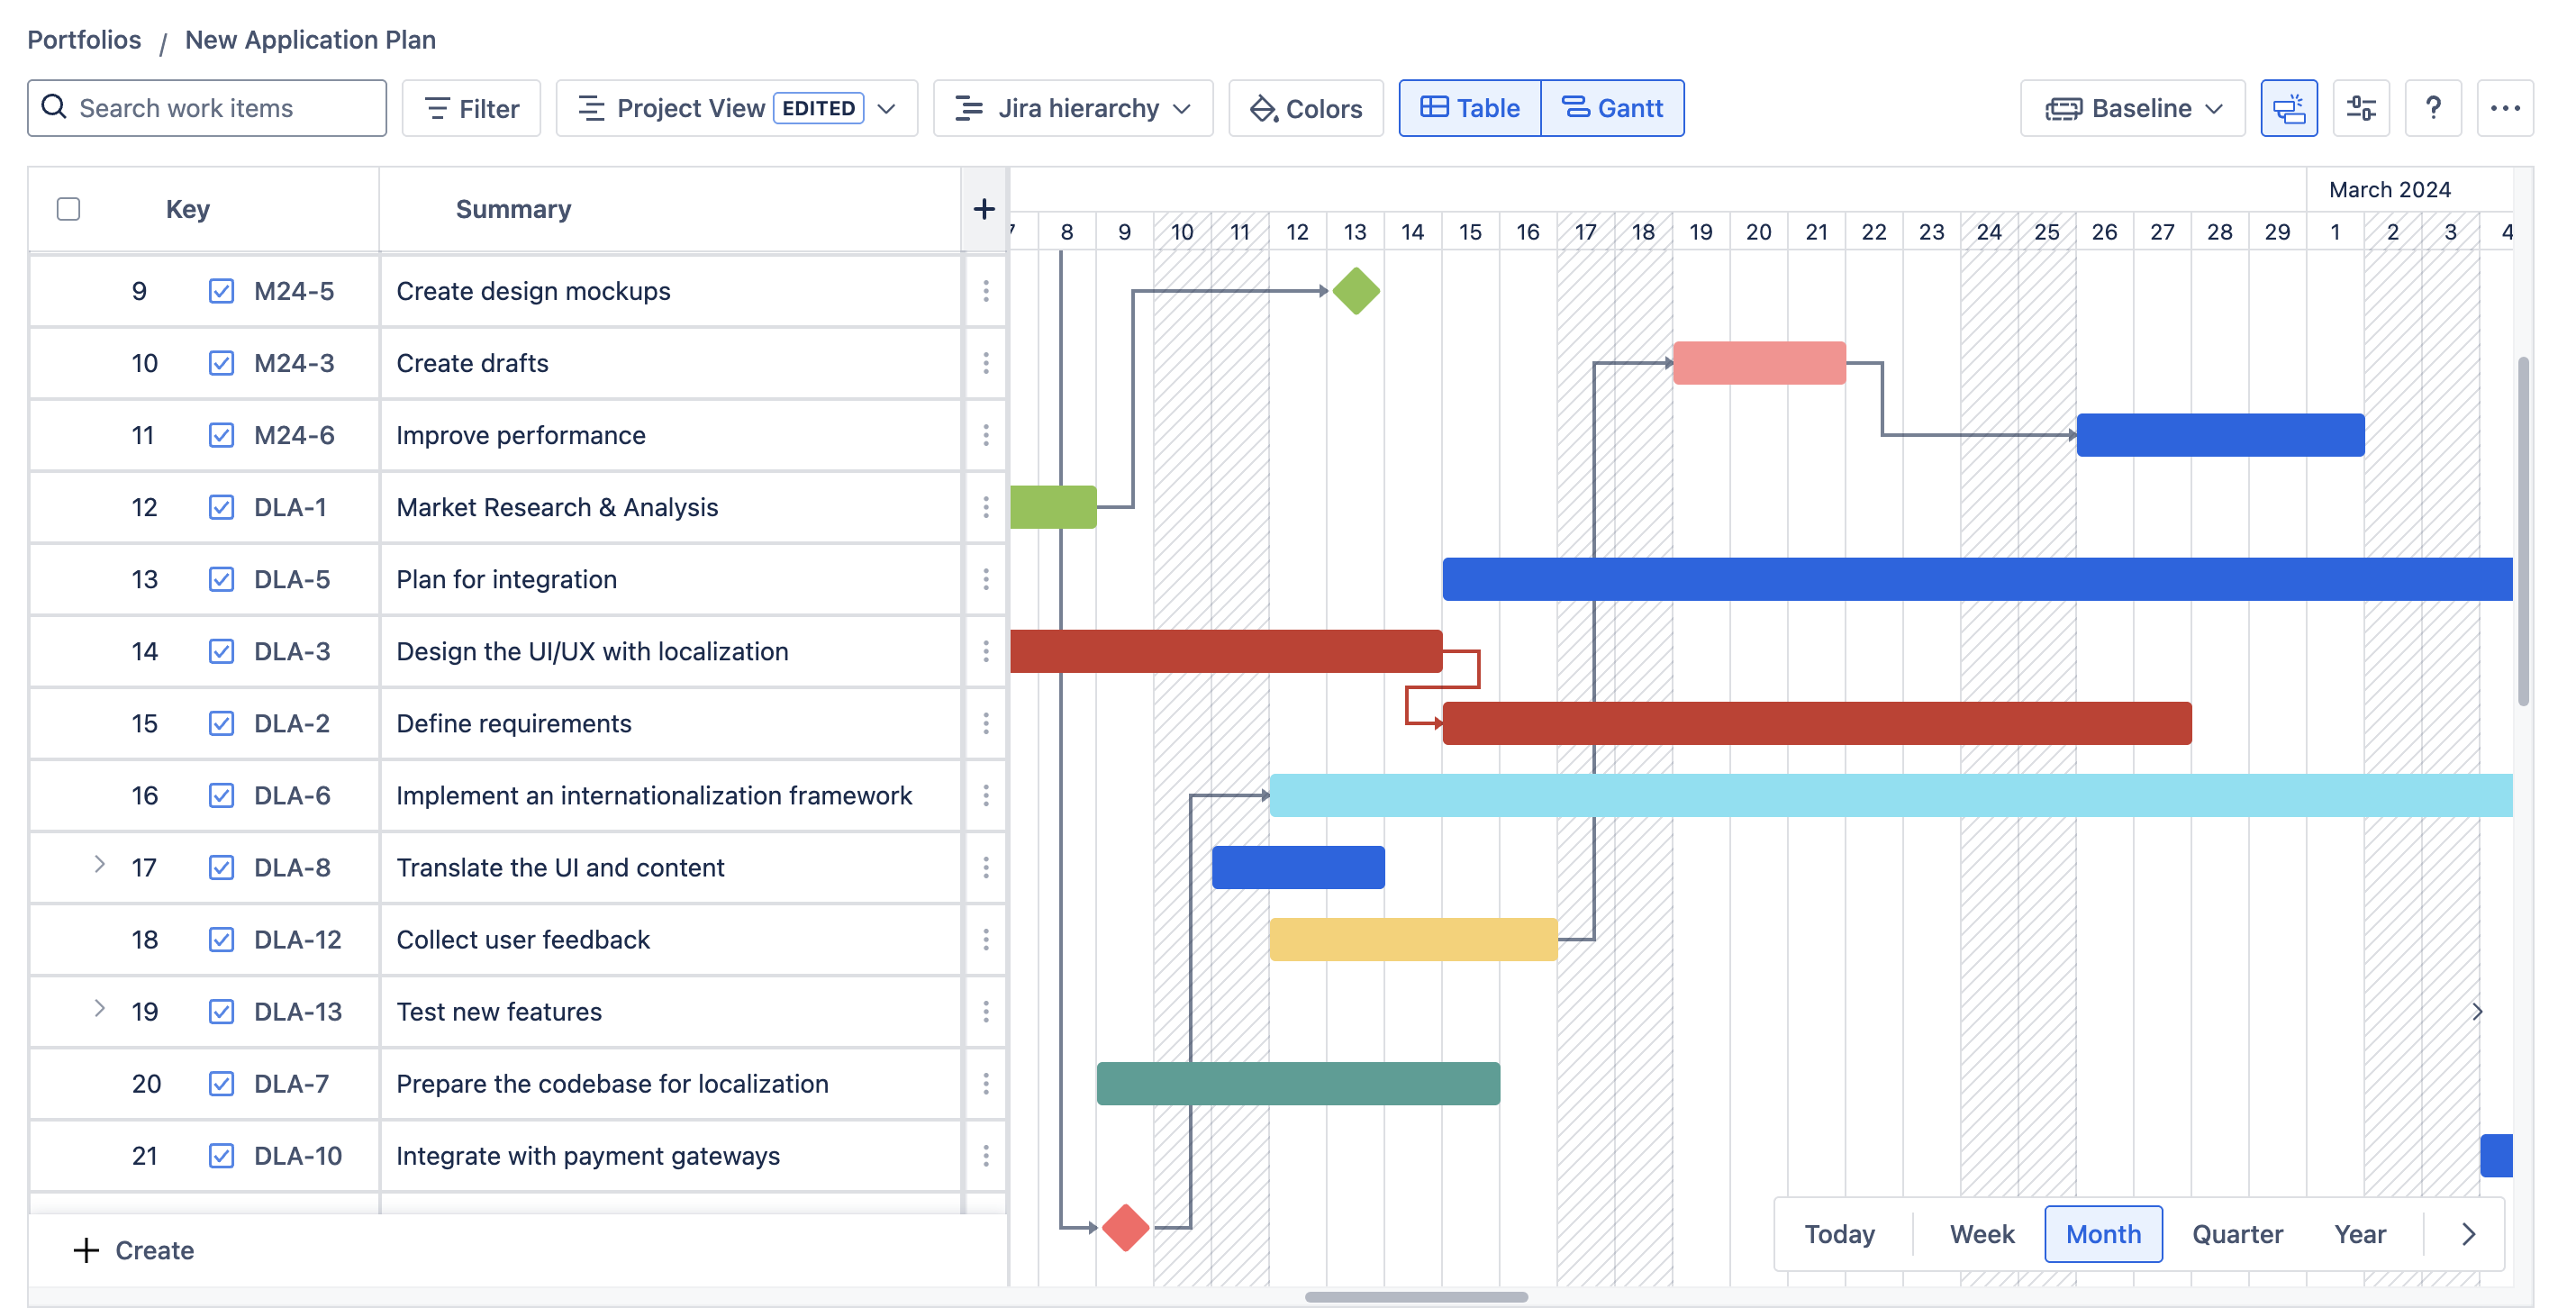
Table view
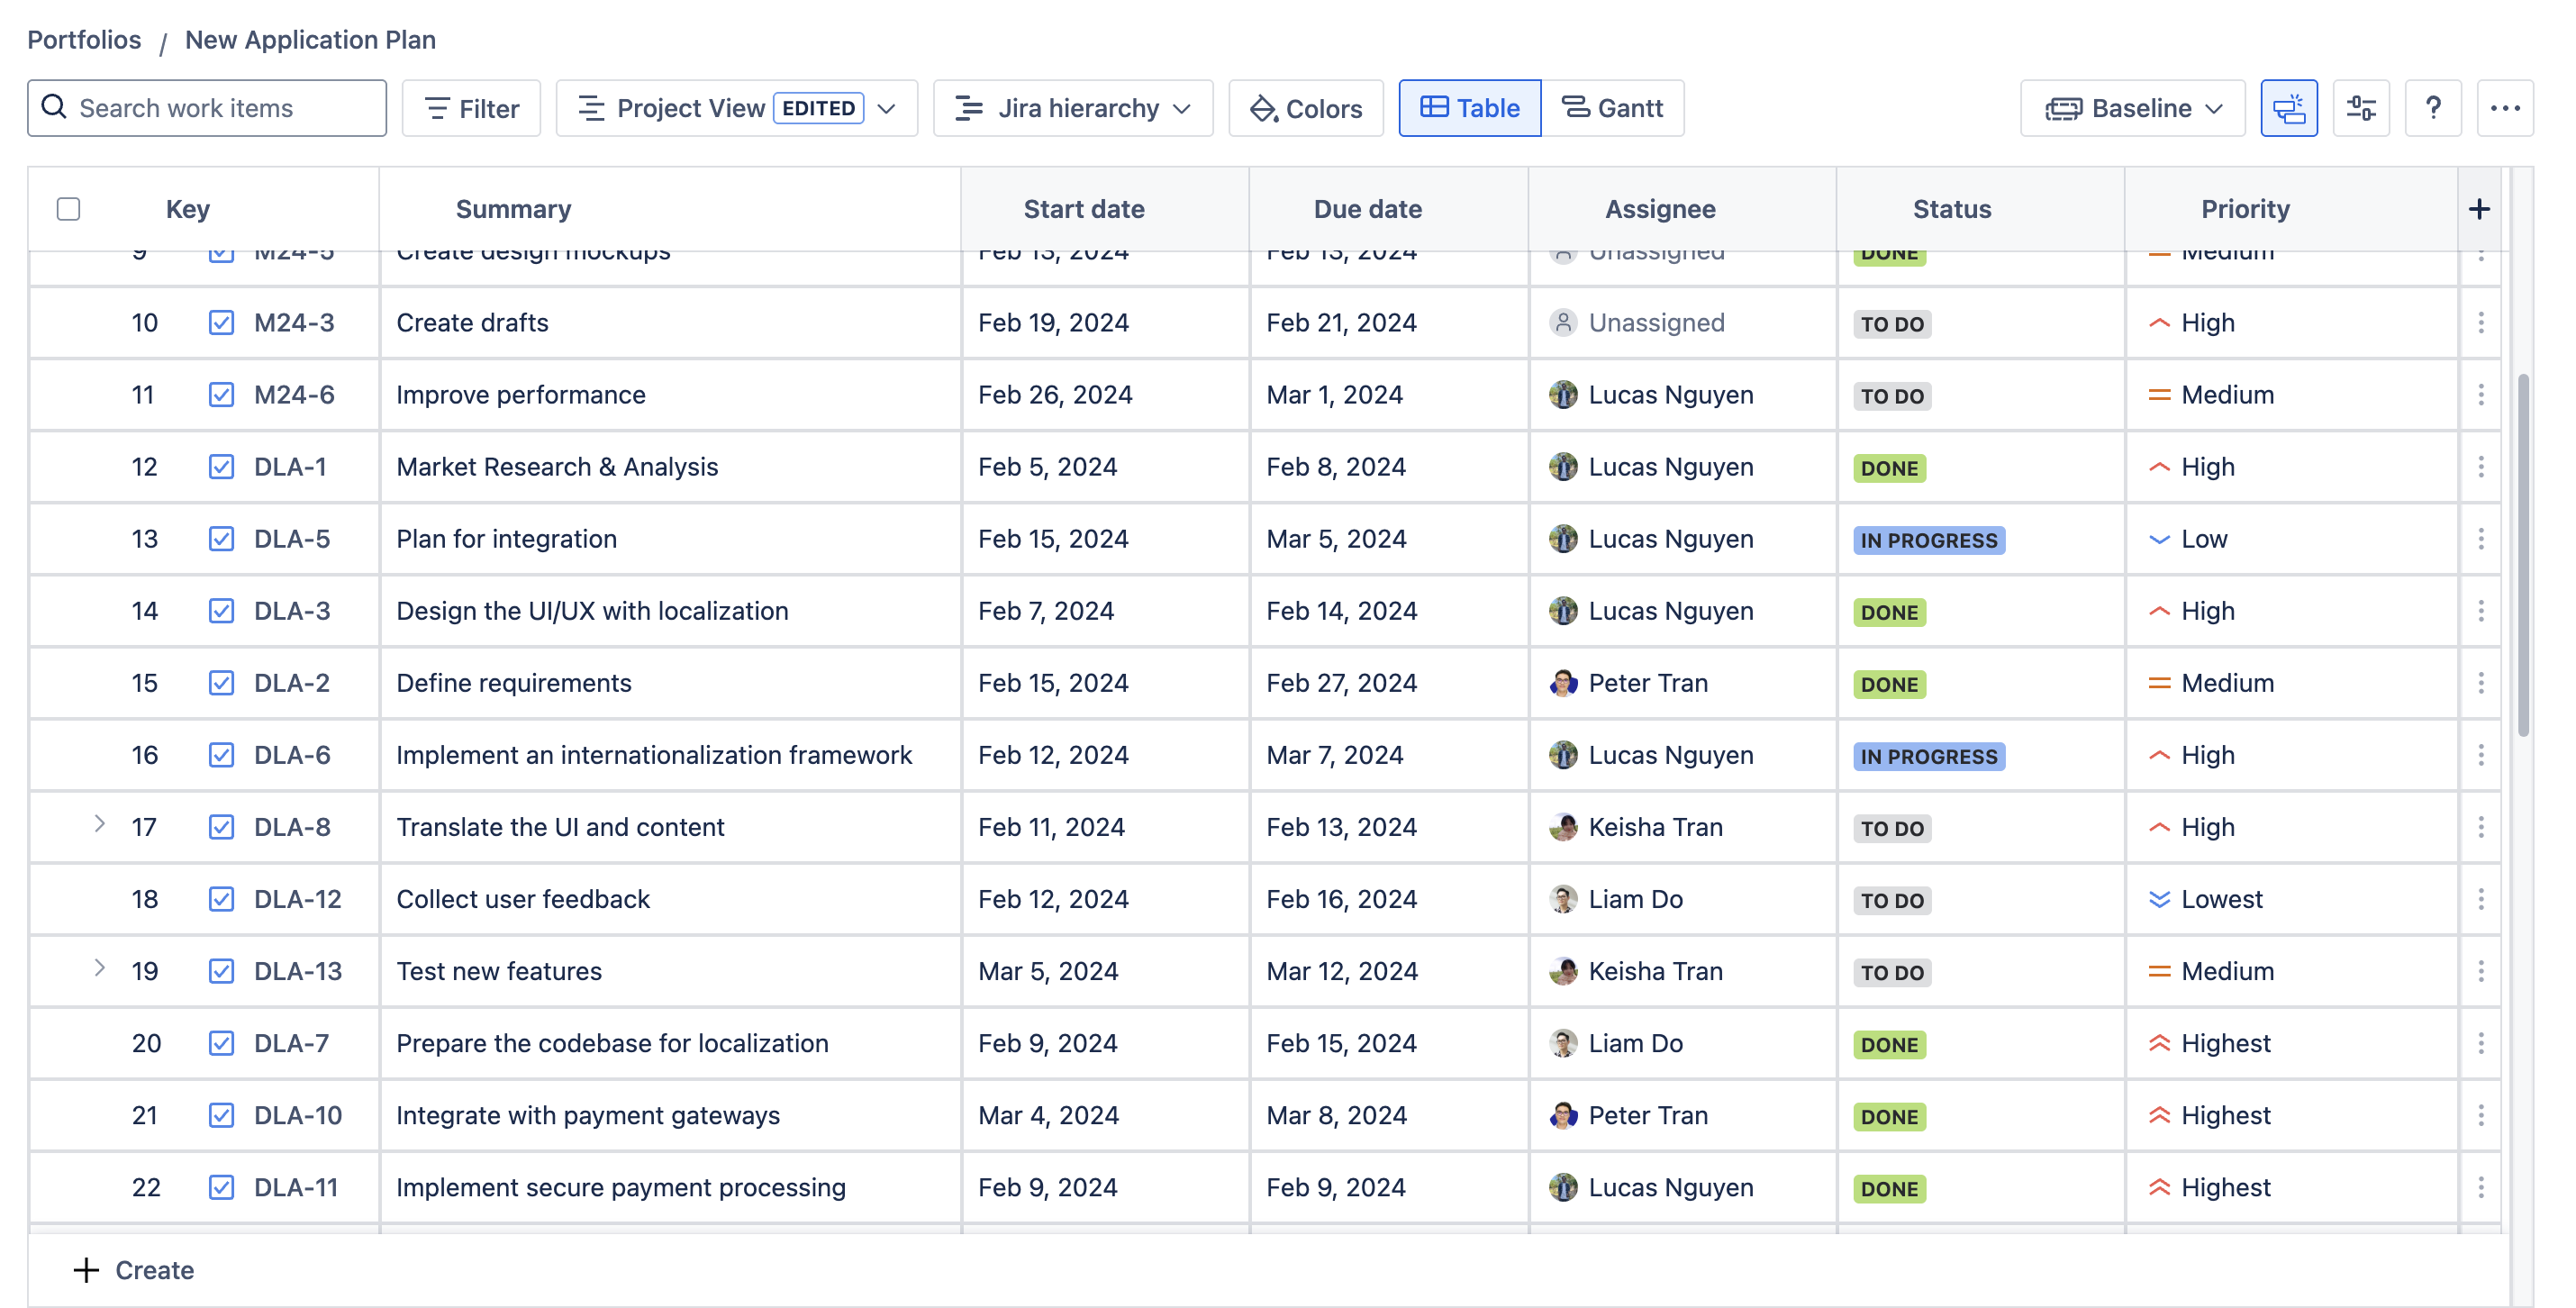
It is a powerful feature designed to empower managers and teams to visualize and manage Jira issues with enhanced spreadsheet capabilities. It seamlessly displays the Jira issue hierarchy, offering a clear, structured view of your projects.
By default, all Jira issues will be automatically synchronized to GanttTable once their projects have been added to the portfolio.
In this Table view, it will show the Issue keys, the Summary of each issue, and the issue's Assignees. You can add more value to the Table as columns by clicking the ➕ button on the top row.
Gantt view
By default, both the Table and Gantt charts are enabled after creating a new portfolio. A Gantt chart is a project management tool that visually represents the timeline of a project, showing the start and end dates of various elements or tasks.
By combining with the WBS - Work Breakdown Structure, it integrates the WBS's hierarchical structure with timeline and task dependencies from the Gantt chart to help visualize and manage a project more effectively.
How to toggle between the Table and Gantt view
By default, GanttTable empowers users to visualize project timelines in a Gantt chart while organizing and managing multiple issues and tasks in bulk using an Excel-like Table.
However, users can decide to use only one of the features above for a cleaner view.
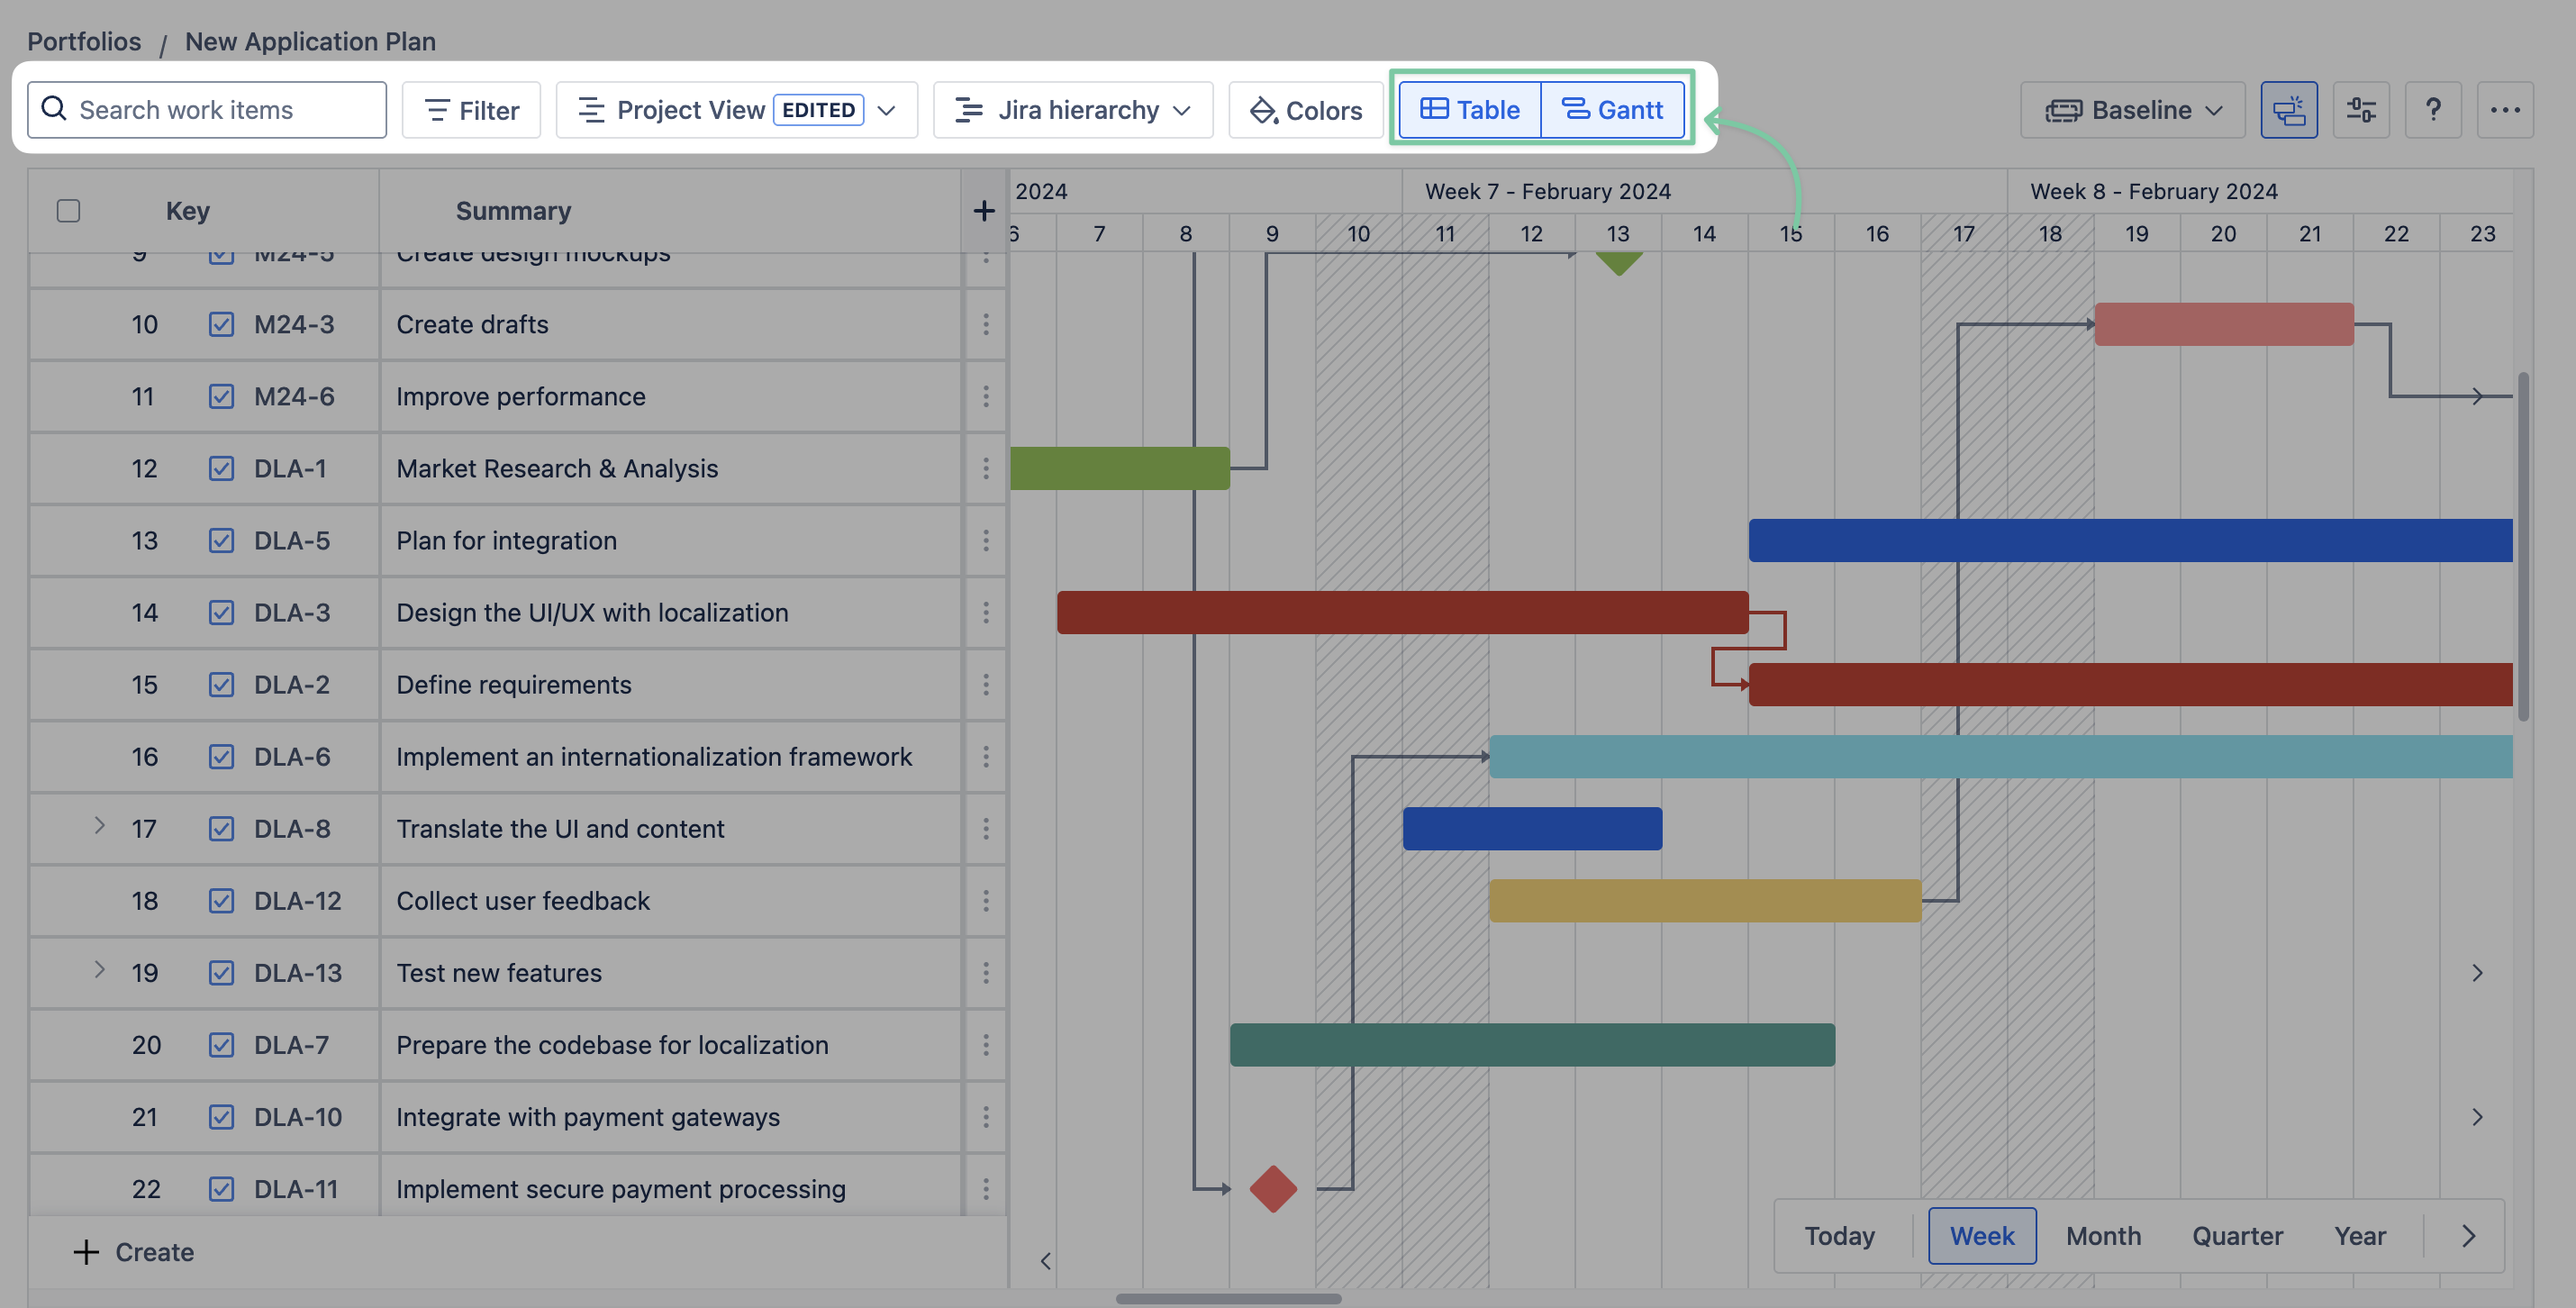
This is the option that allows you only to use either the Table or the Gantt.
*When toggling off the Gantt
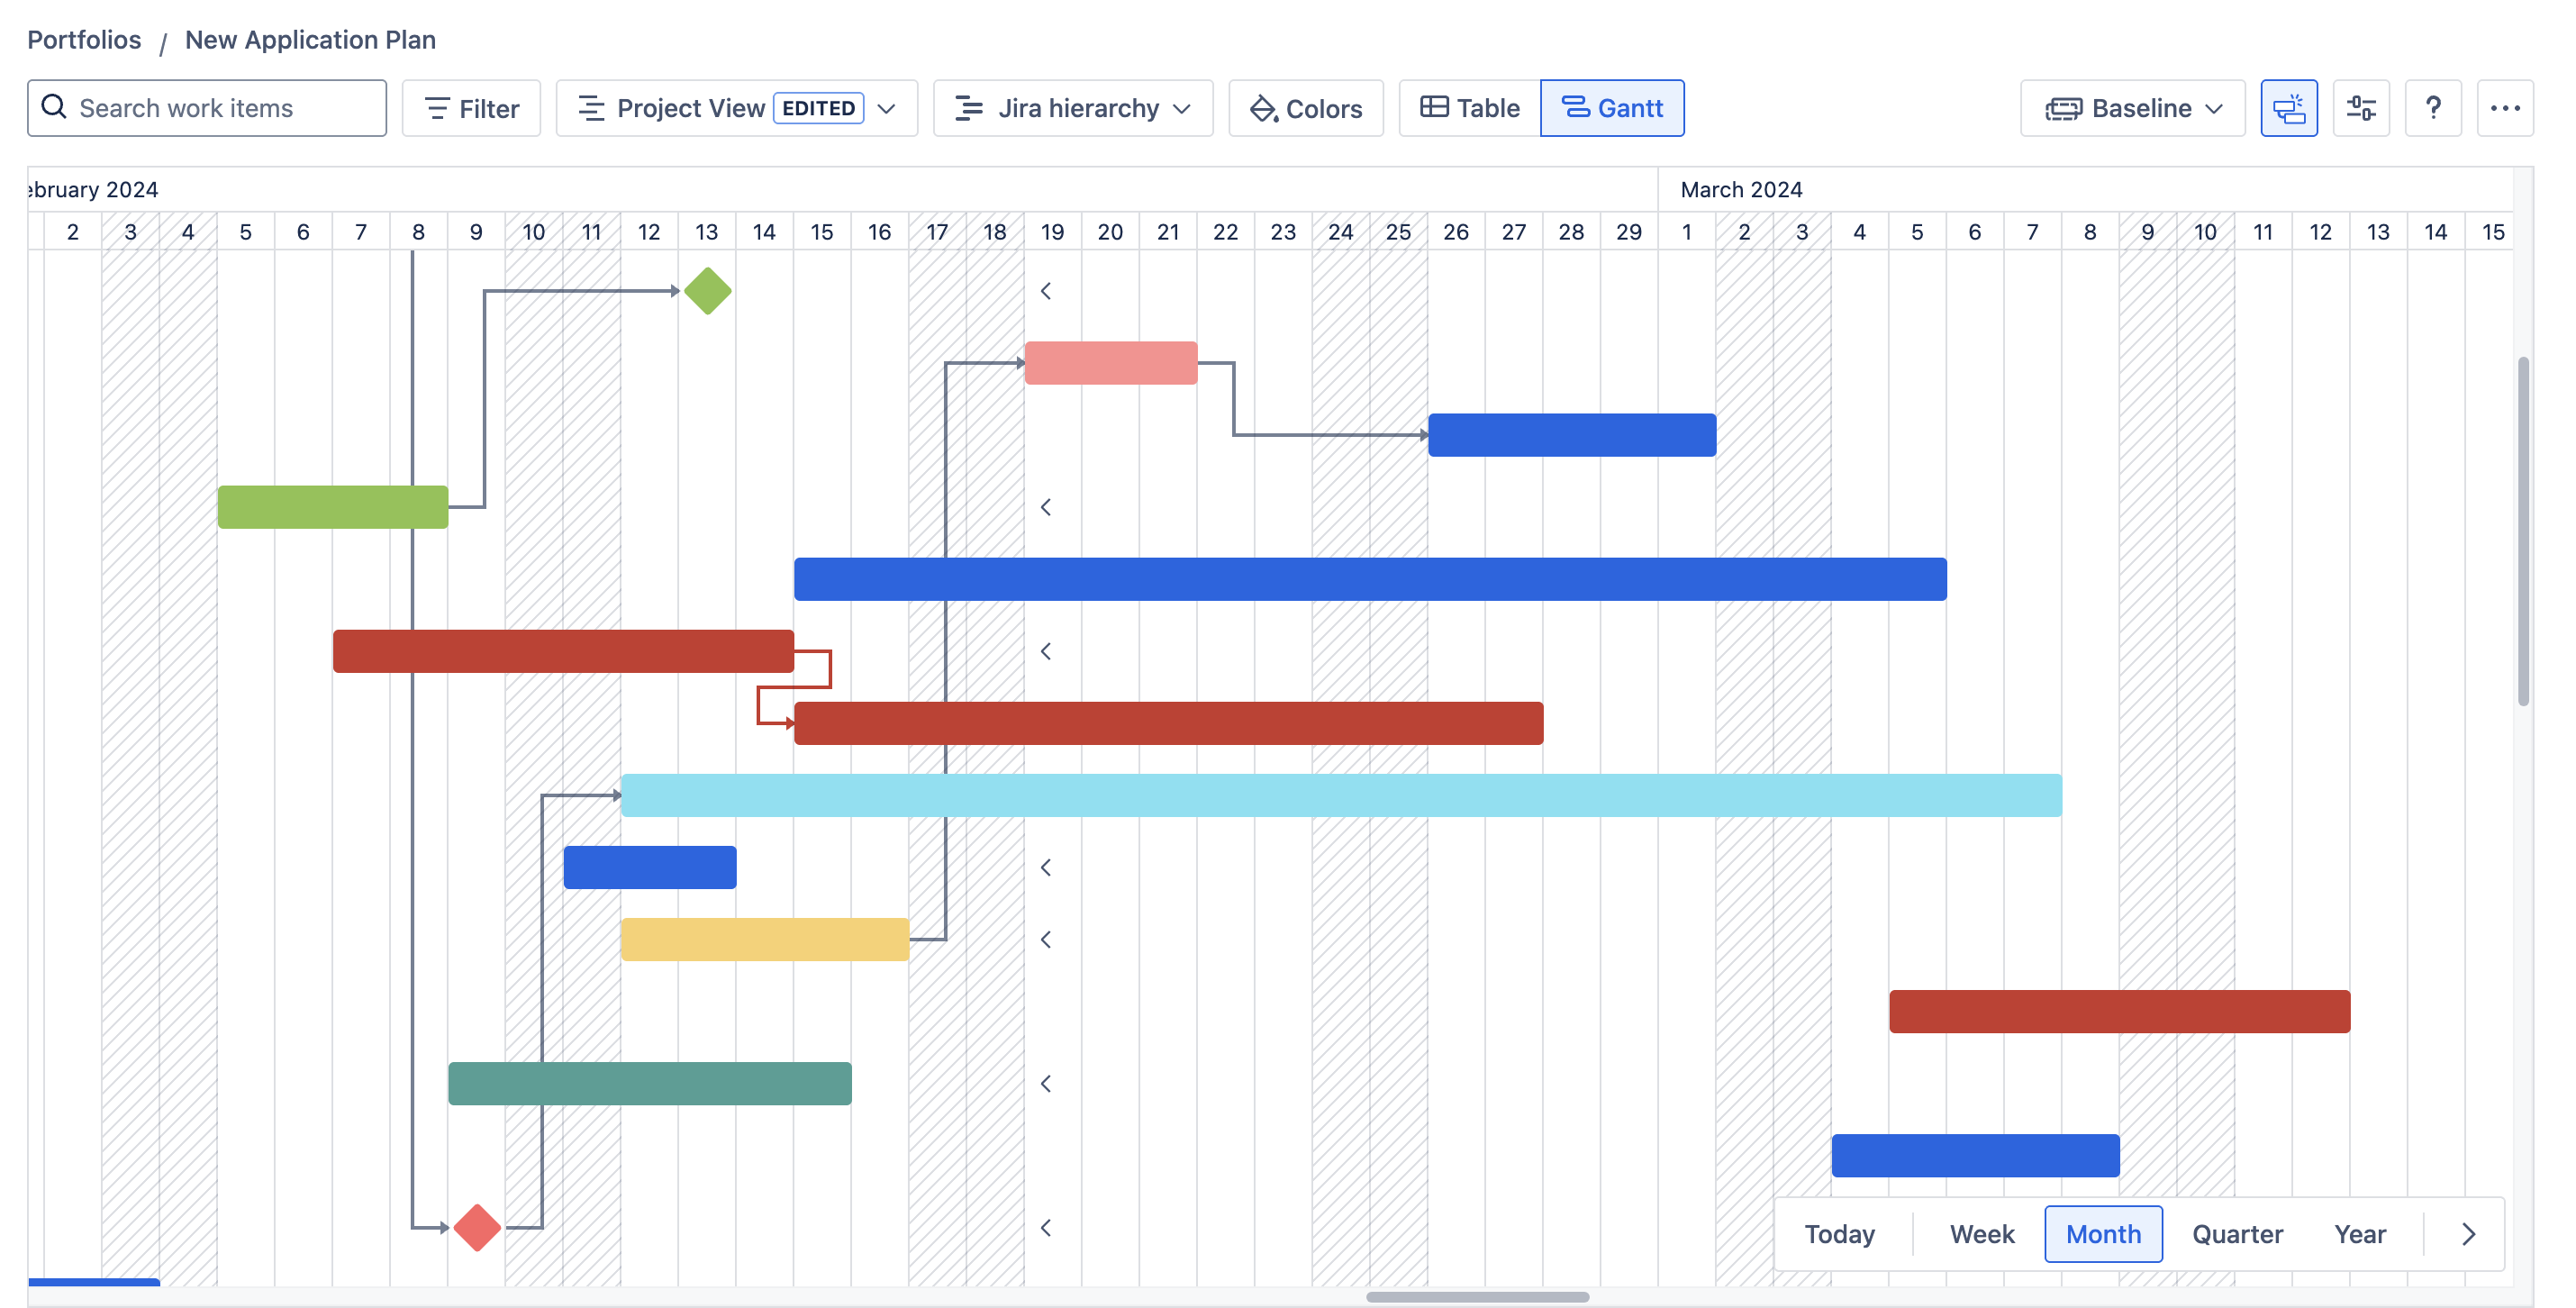
*When toggling off the Table
Themes (Dark mode from Jira settings)
GanttTable also supports the Dark mode theme based on the theme settings from Jira. Users can switch between:
-
Light 🌕
-
Dark 🌑
-
Match browser 🖥️
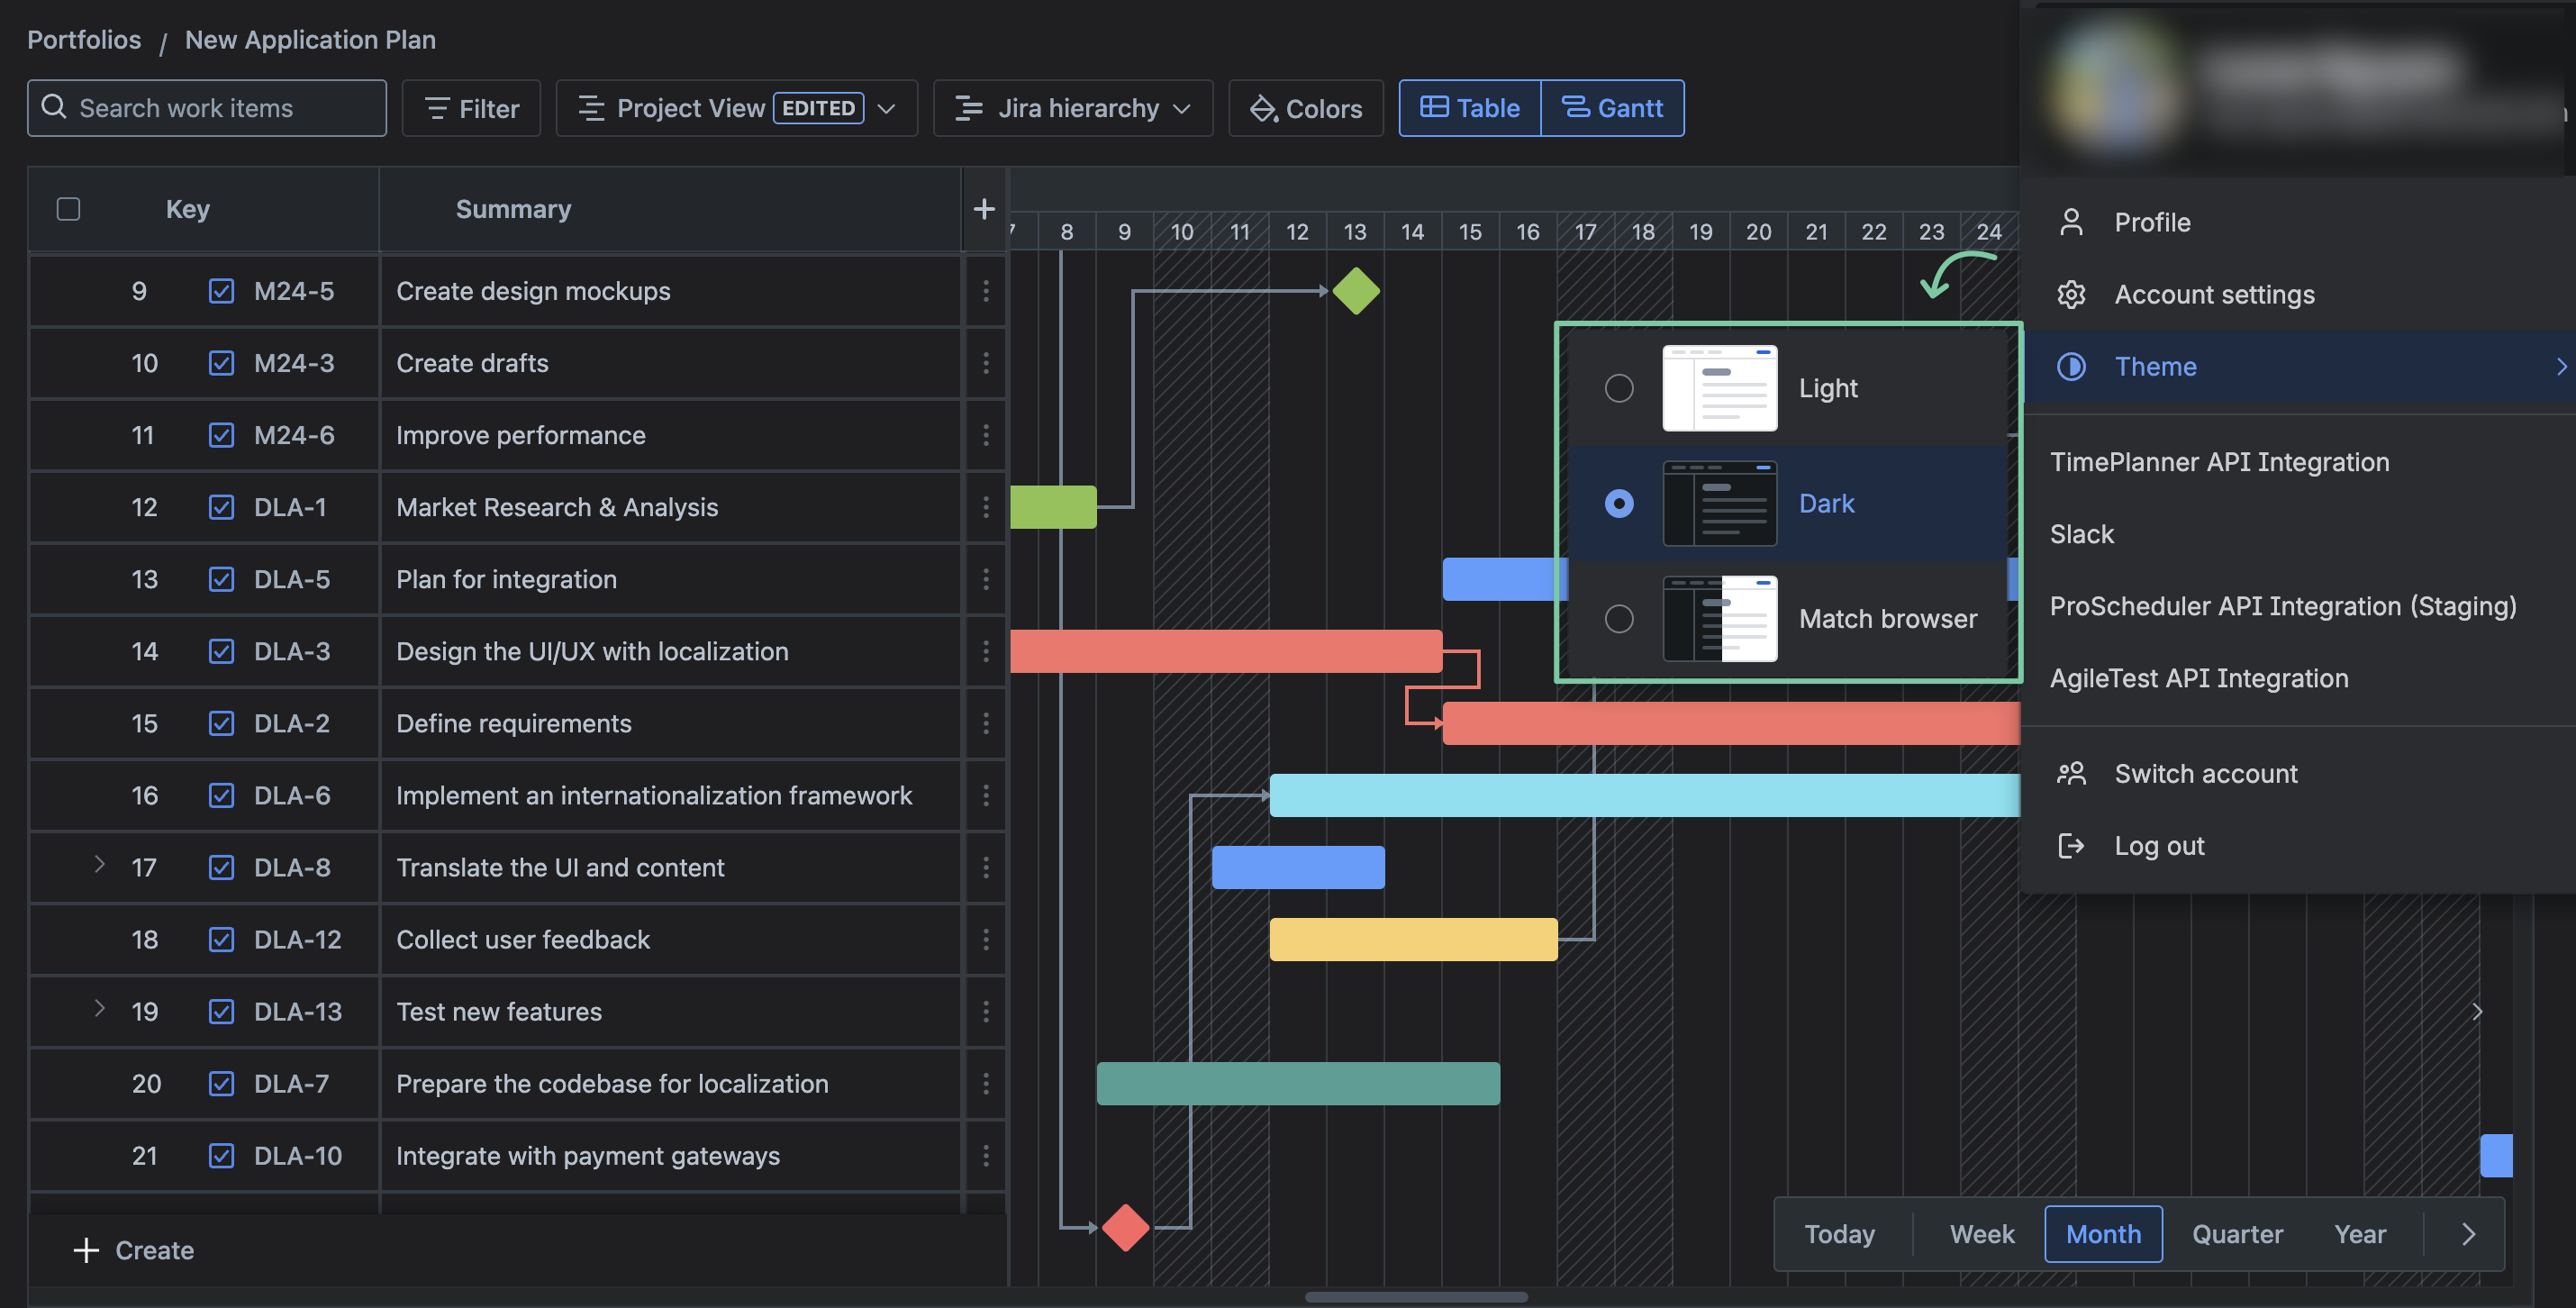
To change theme, click your Avatar icon on the top right corner → choose Theme → select the Mode you want to use.
-20250519-175425.png?cb=dd1a374c92a9105813fa4a18063fa13c)
🗳️ Contact Support ❓Frequently Asked Questions 🌟 Rate us