Gantt
A Gantt chart is a visual project management tool that helps plan, schedule, and track tasks over time. It displays tasks as horizontal bars along a timeline. The chart shows start and end dates, task dependencies, and milestones.
Gantt charts are commonly used to manage project timelines, allocate resources, and ensure that projects stay on track by visually representing the sequence and timing of tasks.
1. Adding a new task to the Gantt chart
After creating a new ConfluPlan board using the Gantt chart, you can start by adding a new task.
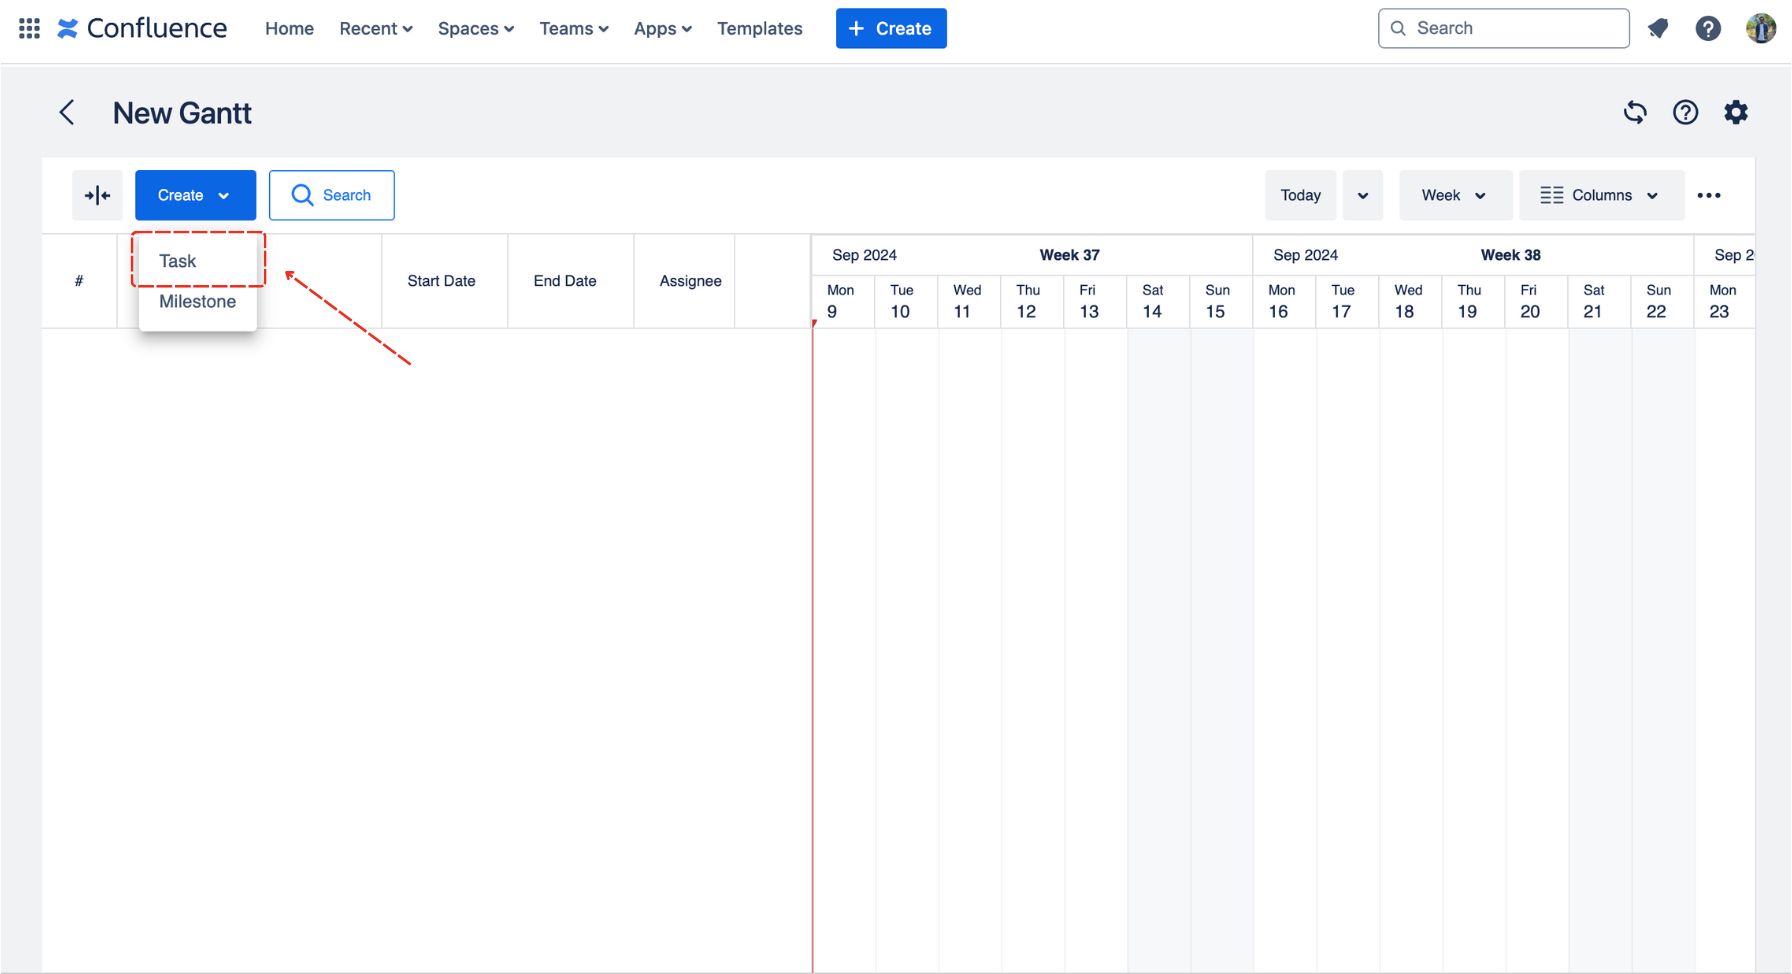
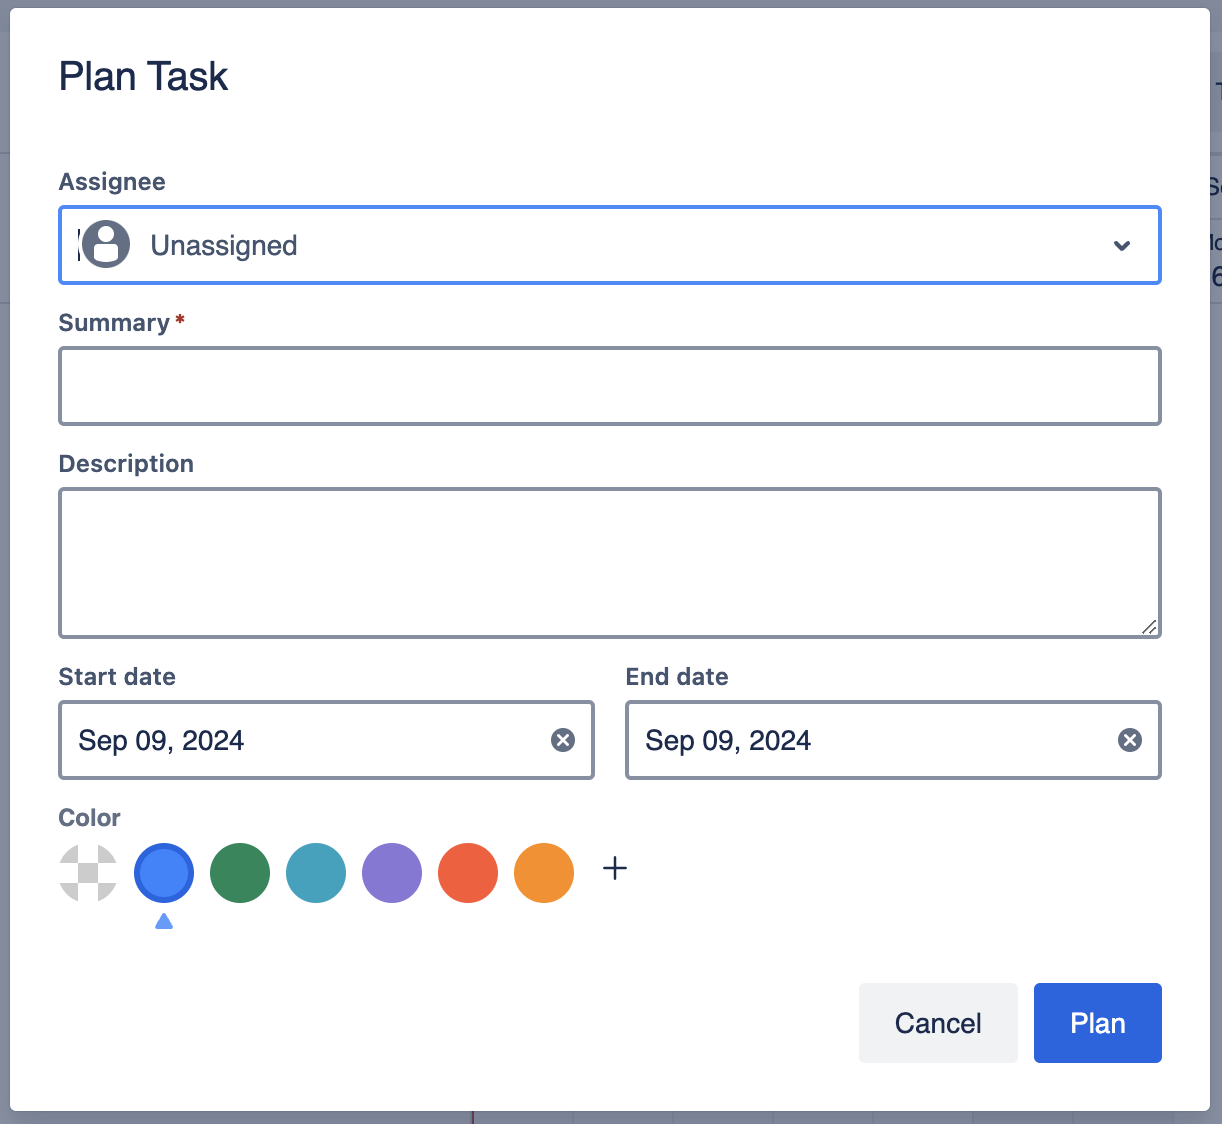
At this step, you can name this task, assign a member responsible for it, decide its duration, and select a color.
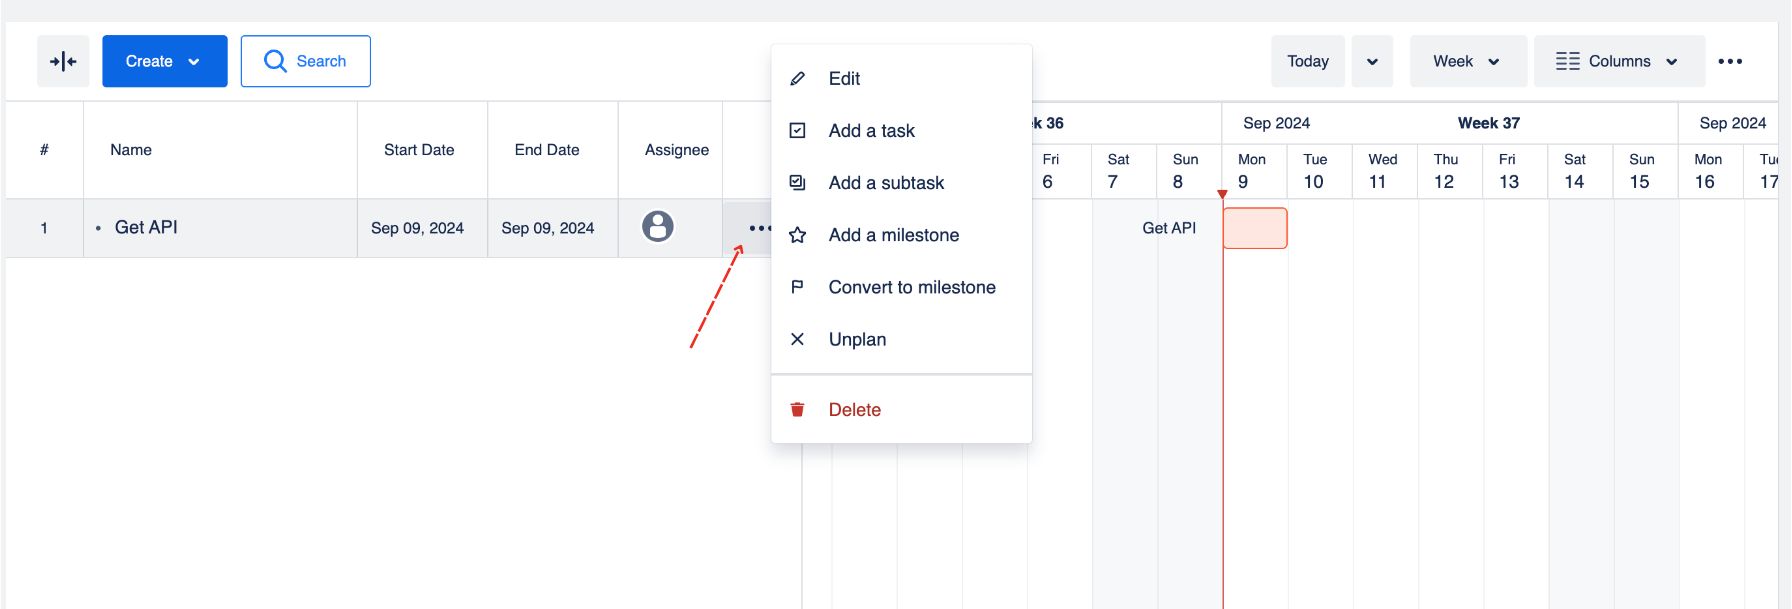
After adding your first task, you can click the edit button to adjust it further. You can also quickly add more new tasks, add a new subtask below, or delete it.
TIP
You can quickly change the task’s timeline or turn a task into a subtask by using drag and drop.
2. Task Dependencies
In ConfluPlan Gantt chart for Confluence, you can create dependencies between tasks in your project.
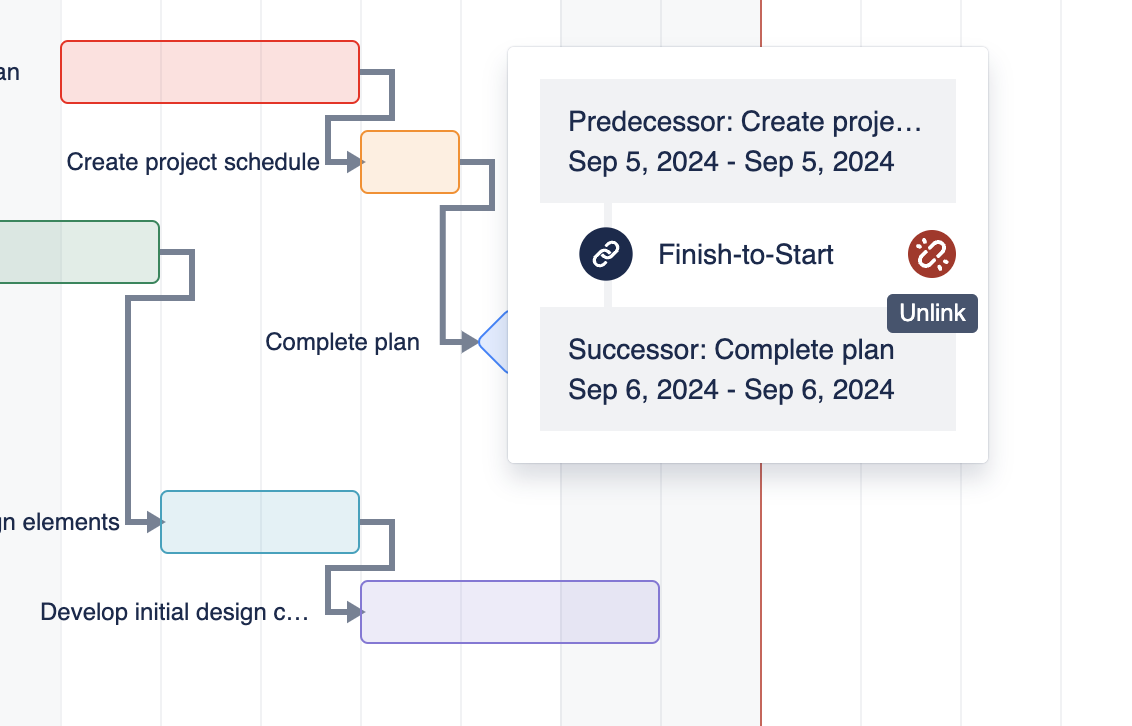
To create a dependency, hover your cursor over a task → locate the small dot at either end of the task bar -> drag it to the task that you want to make the dependency.
Currently, ConfluPlan's Gantt chart supports the following types of dependencies:
Start-to-Start
Start-to-Finish
Finish-to-Start
Finish-to-Finish
You can also delete these dependencies by left-clicking on the link and choose Unlink.
3. Milestones in the Gantt chart
In ConfluPlan’s Gantt for Confluence, you can add or convert a task to a milestone to notify other members about an important date or event in your project timeline.
You can use the Create button to add a detailed milestone.
Or, you can quickly add a default milestone from the Edit button.
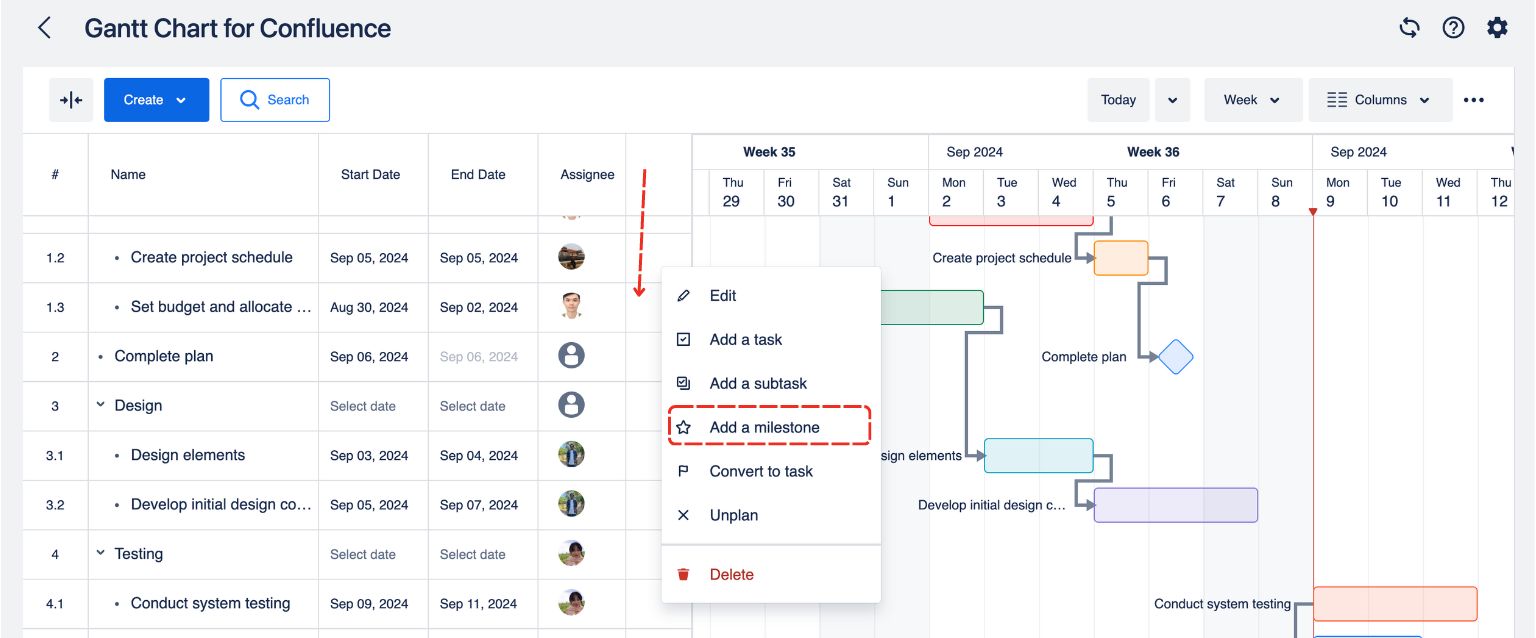
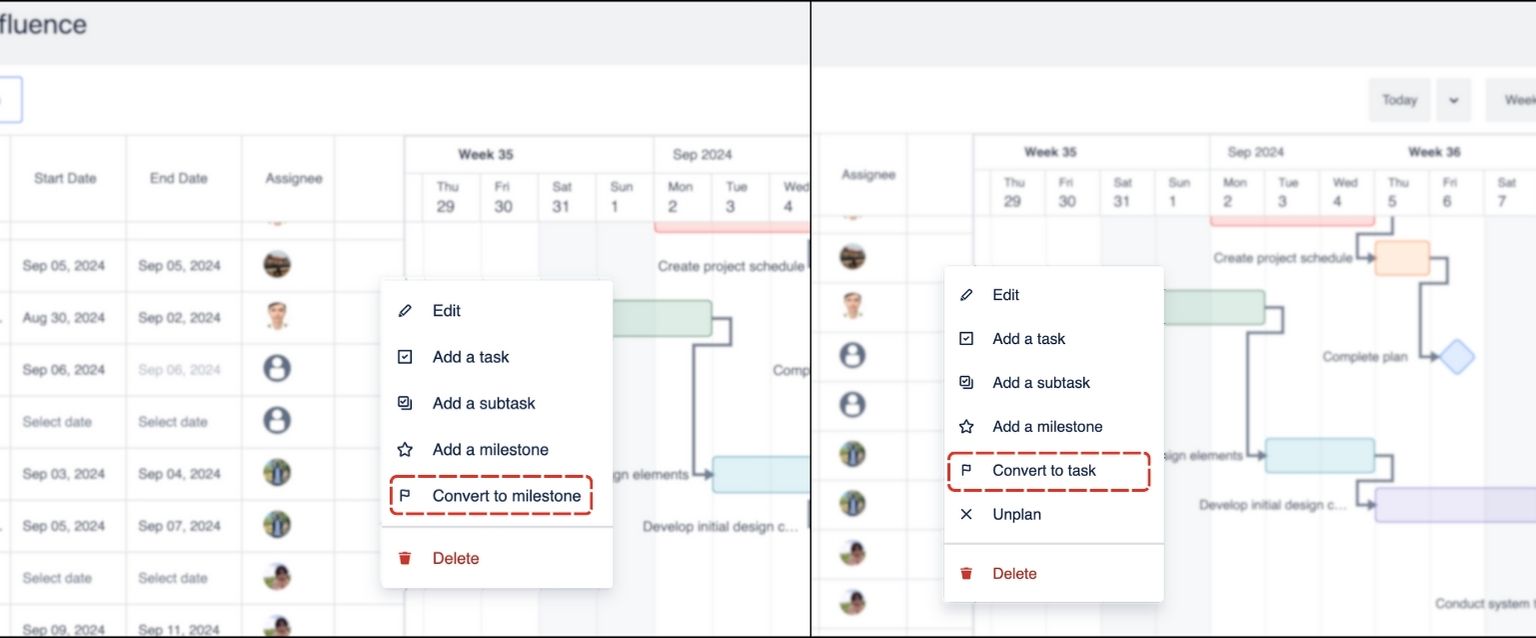
You can also convert an existing task in the ConfluPlan’s Gantt into a milestone (or convert a milestone back to a task accordingly).
.png)