.png)
The new Report feature helps you collect and analyze your data, whether it's time spent, workload, or performance. It gives you a clear overview of how your team is doing and helps you make informed decisions.
How to Get Started with the Report Feature?
-
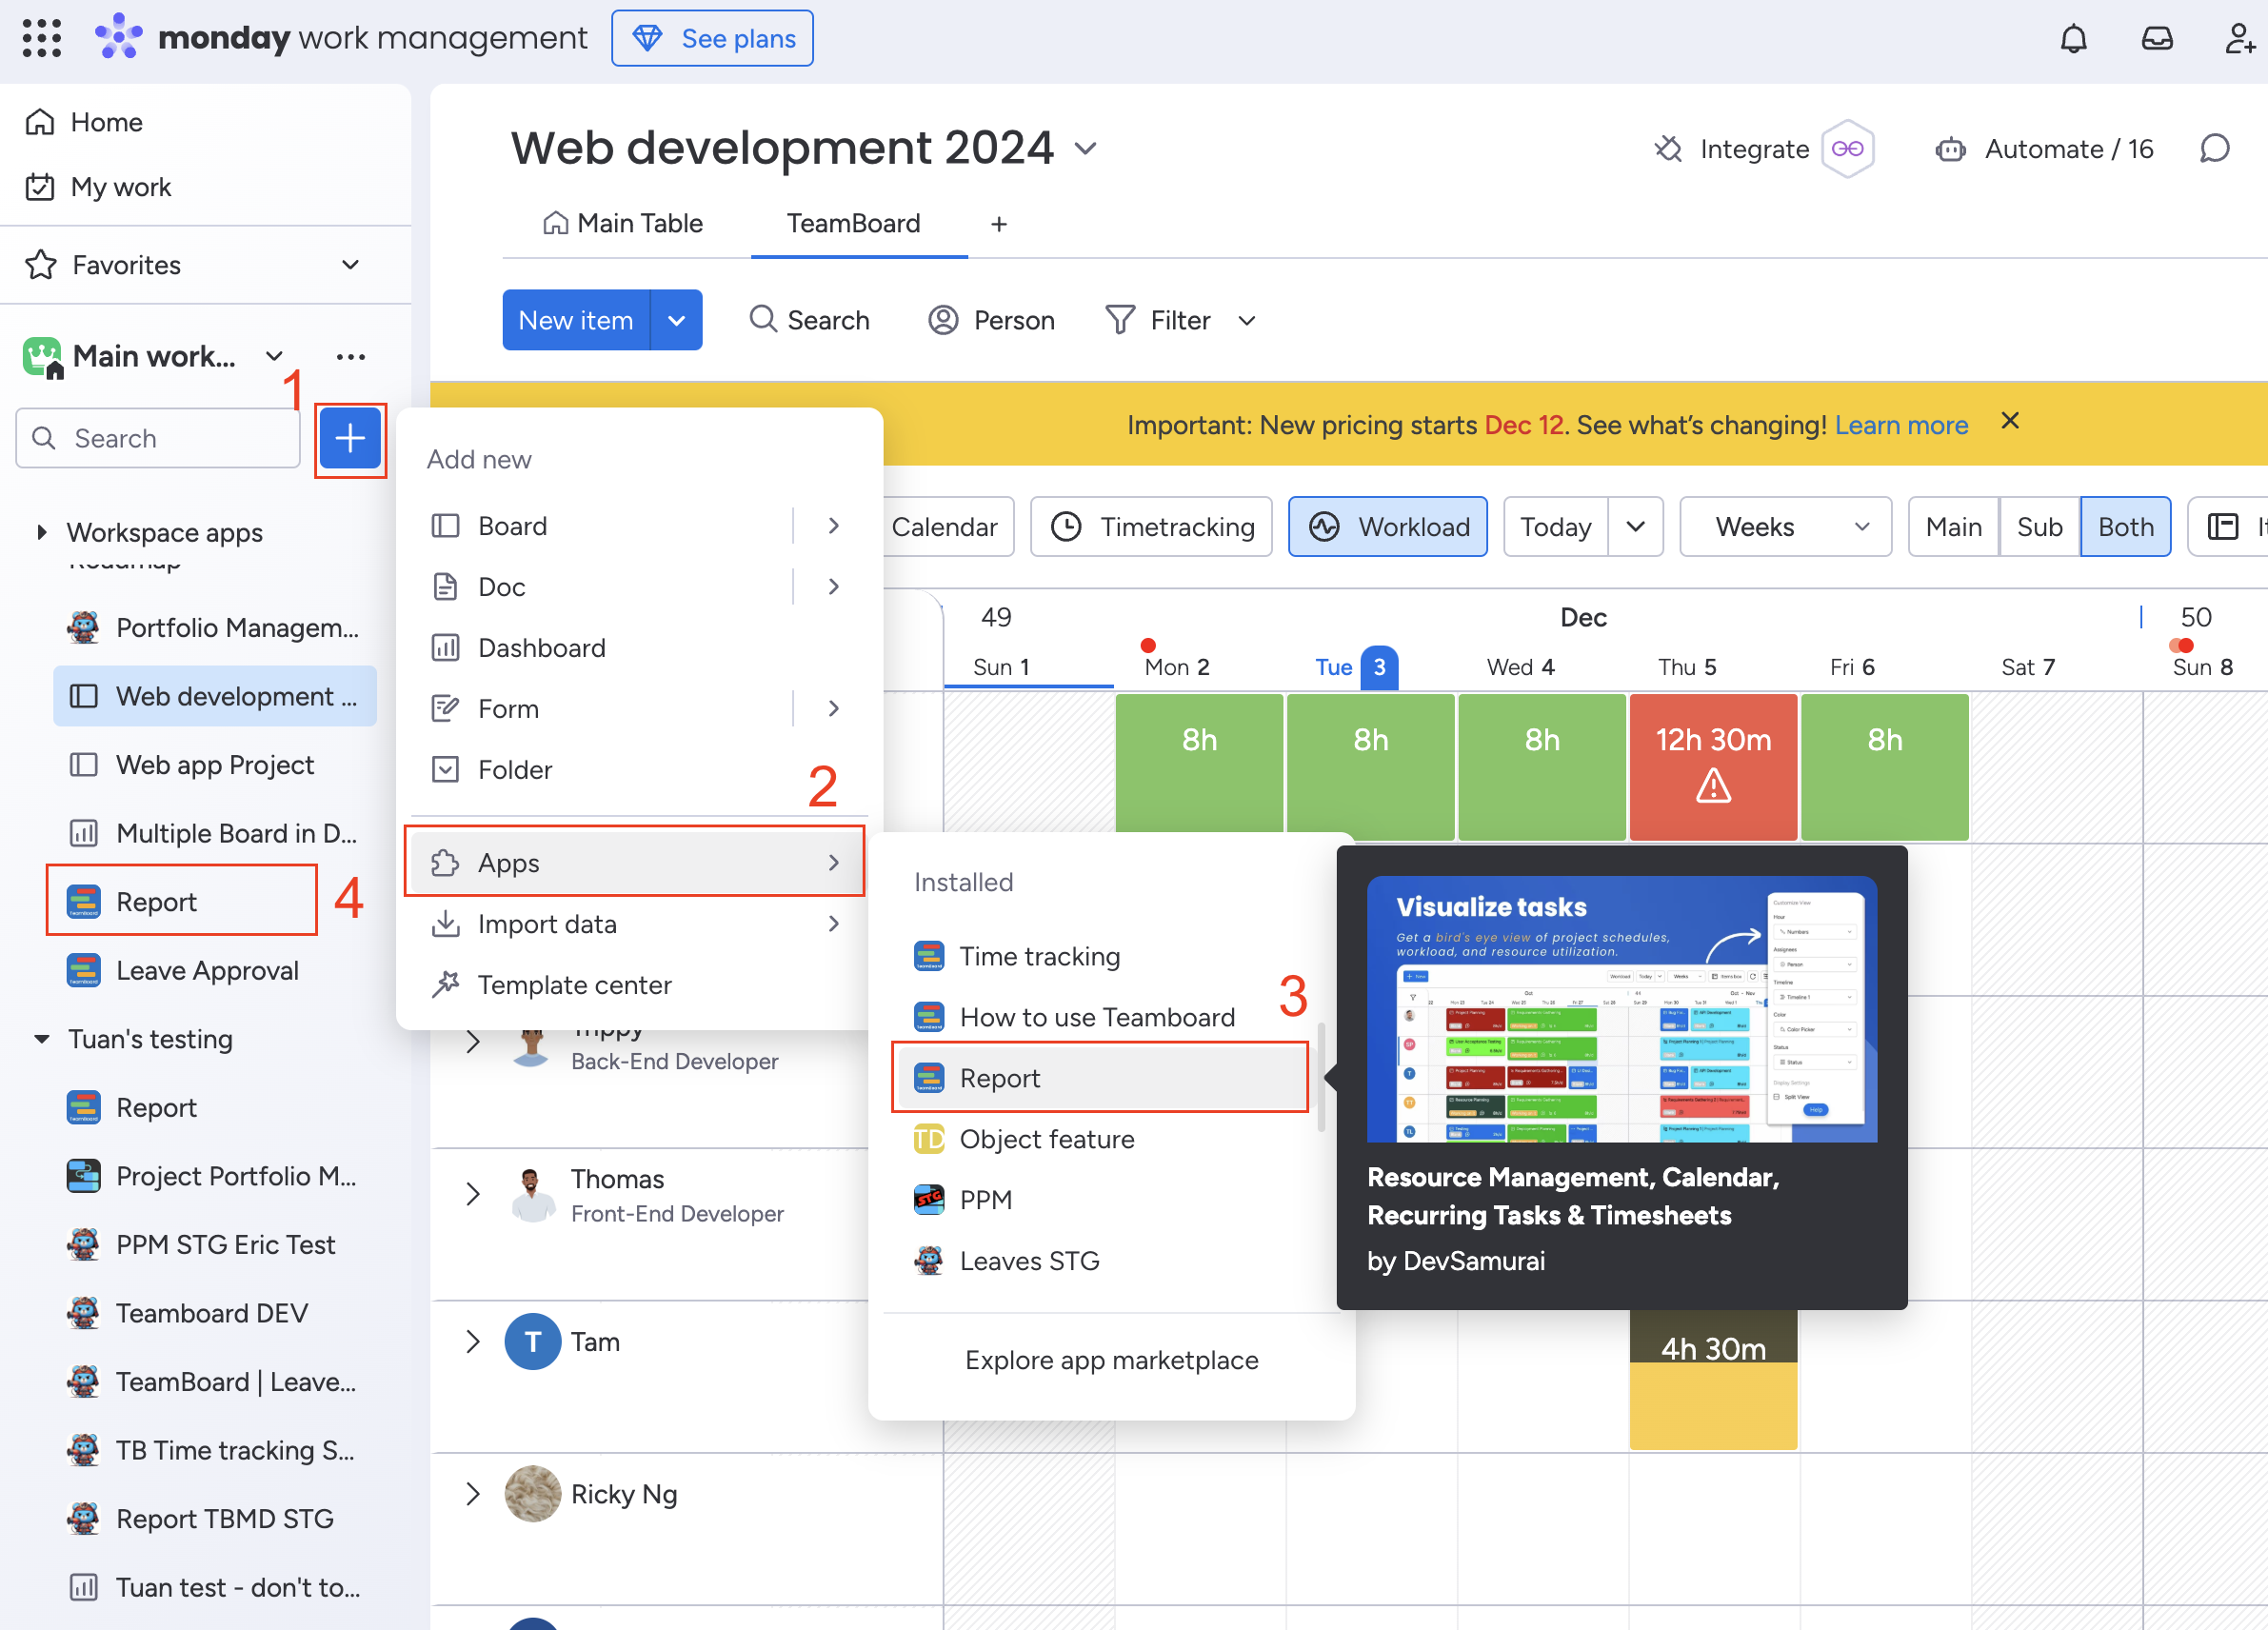
Click on the + button (1) (usually located at the top left or in the workspace area).
-
From the options that appear, select “Apps” (2) => TeamBoard Report (3). This will open the Report Dashboard.(4)
Explore the Report Dashboard
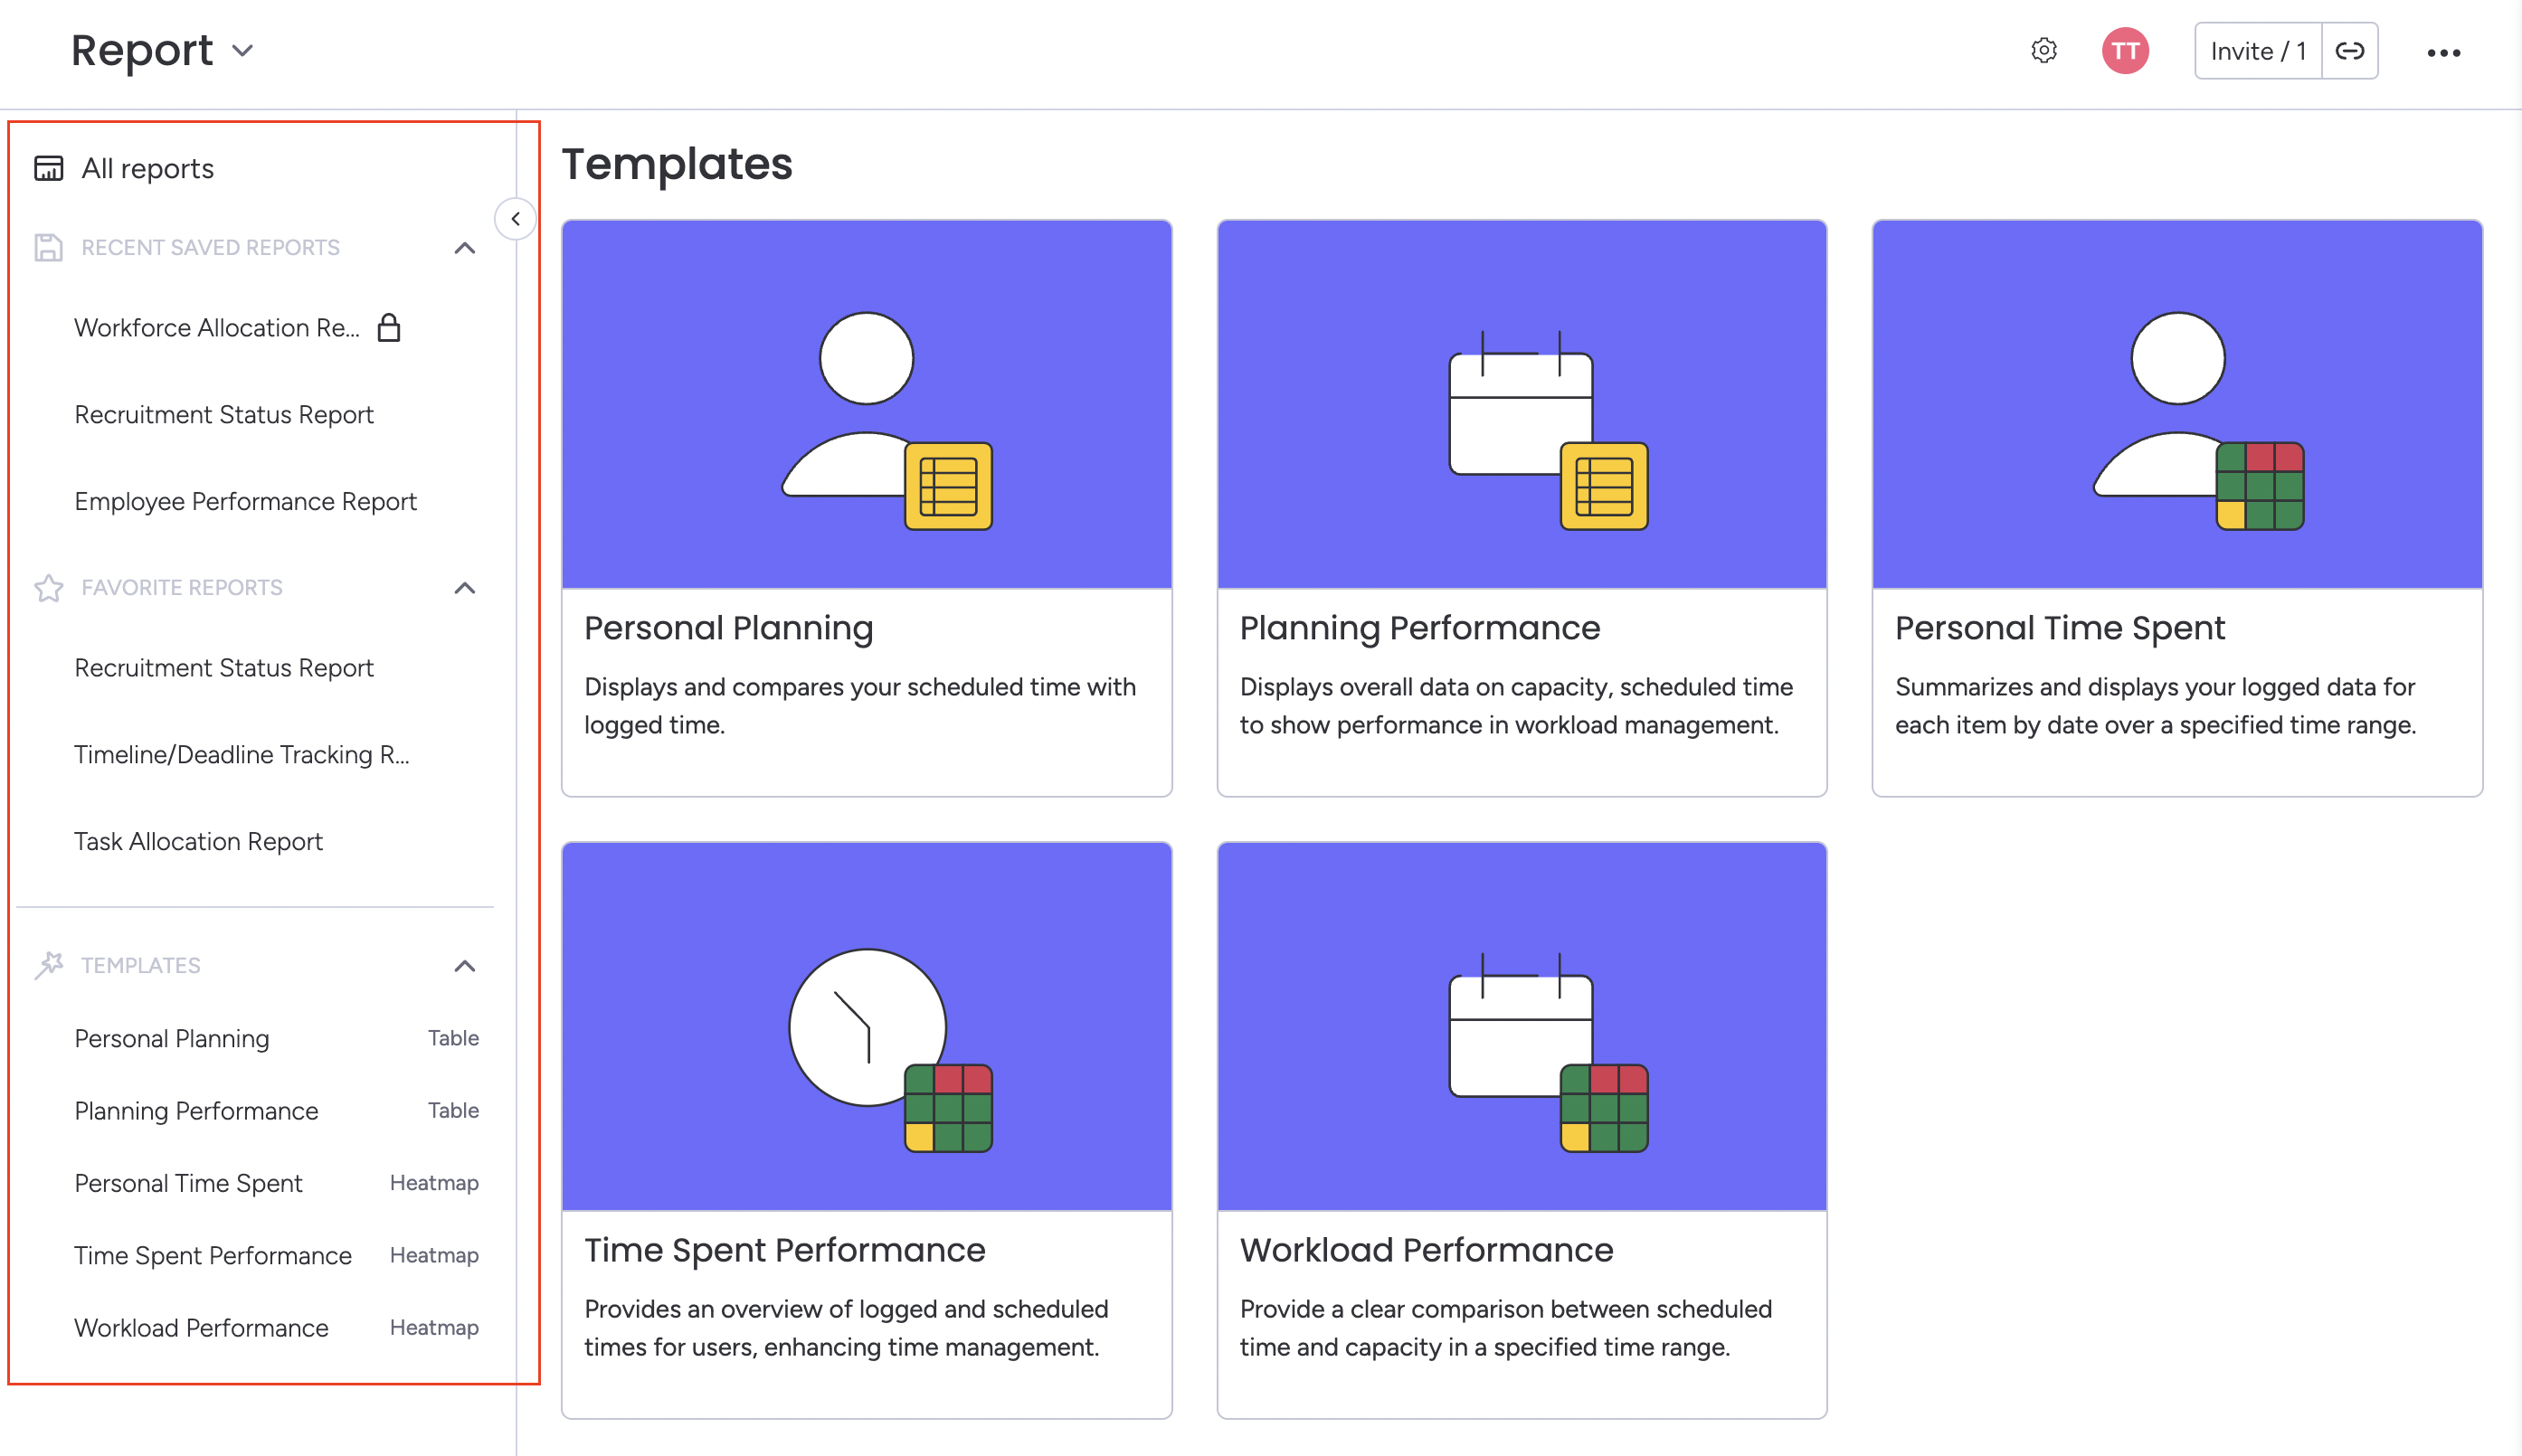
Once in the Report Dashboard, you can start creating, managing, and tracking your reports. You’ll see the four main sections that help you organize everything:
-
All Reports: A list of all your reports.
-
Saved Reports: Reports you've saved to work on later.
-
Favorite Reports: Quick access to your most-used reports.
-
Templates: Pre-made report templates to help you get started quickly.
Create a New Report
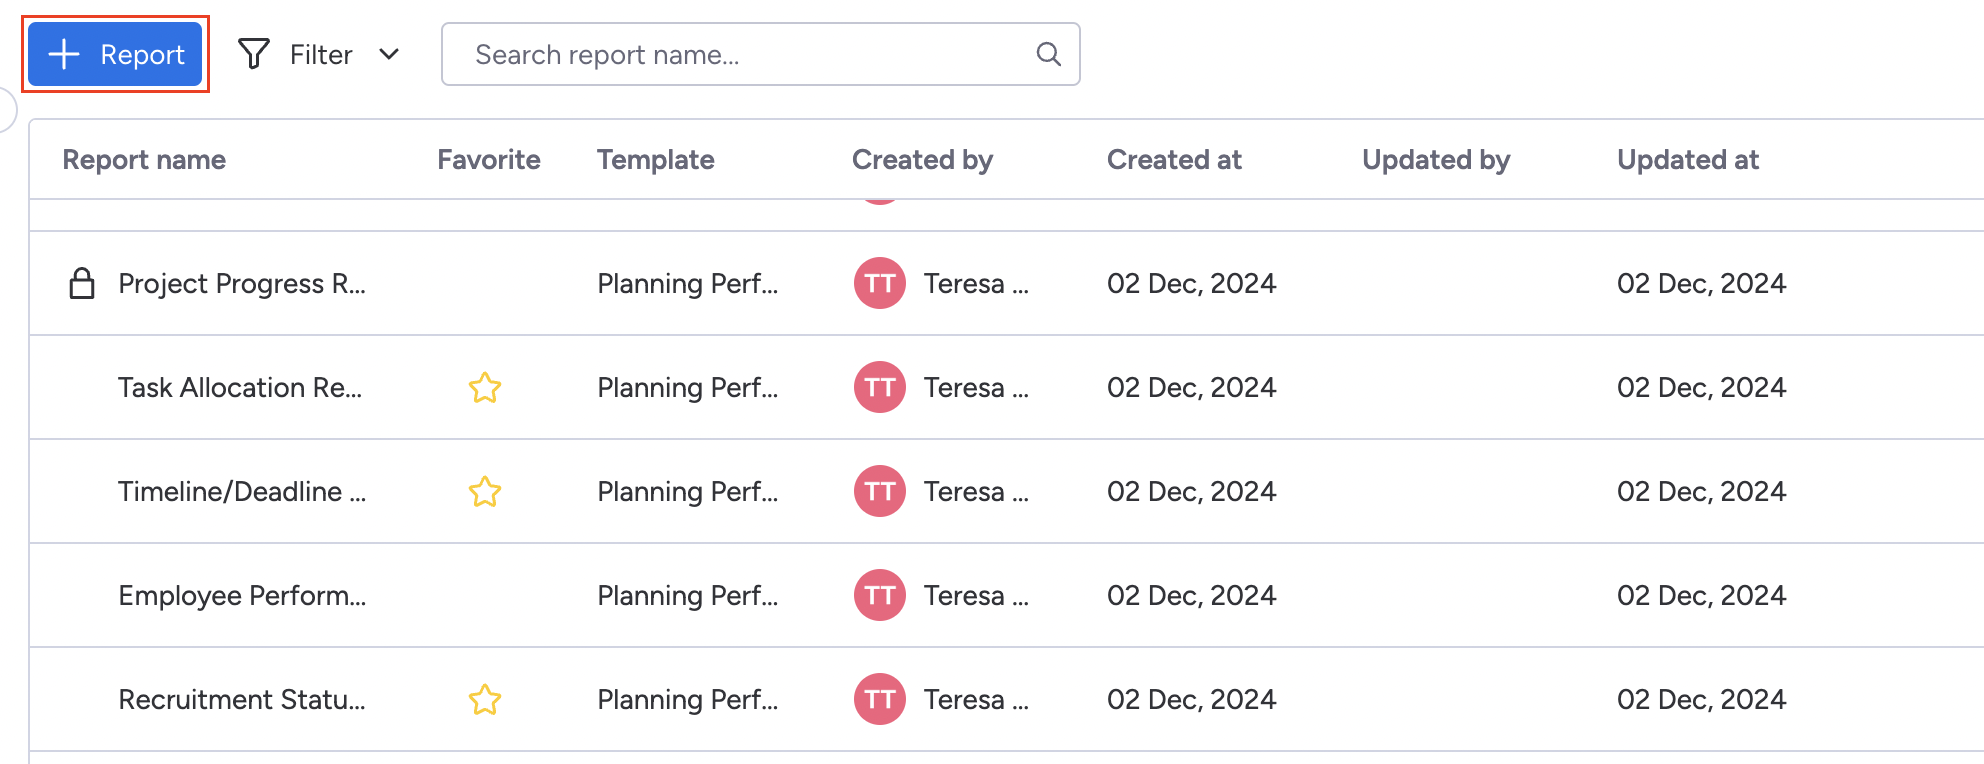
You can choose from template sections, or in the All Reports section, look for the option to create a new report. You may see a button that says 'Create New Report' or a + symbol. Click it to begin.
Choose a Template
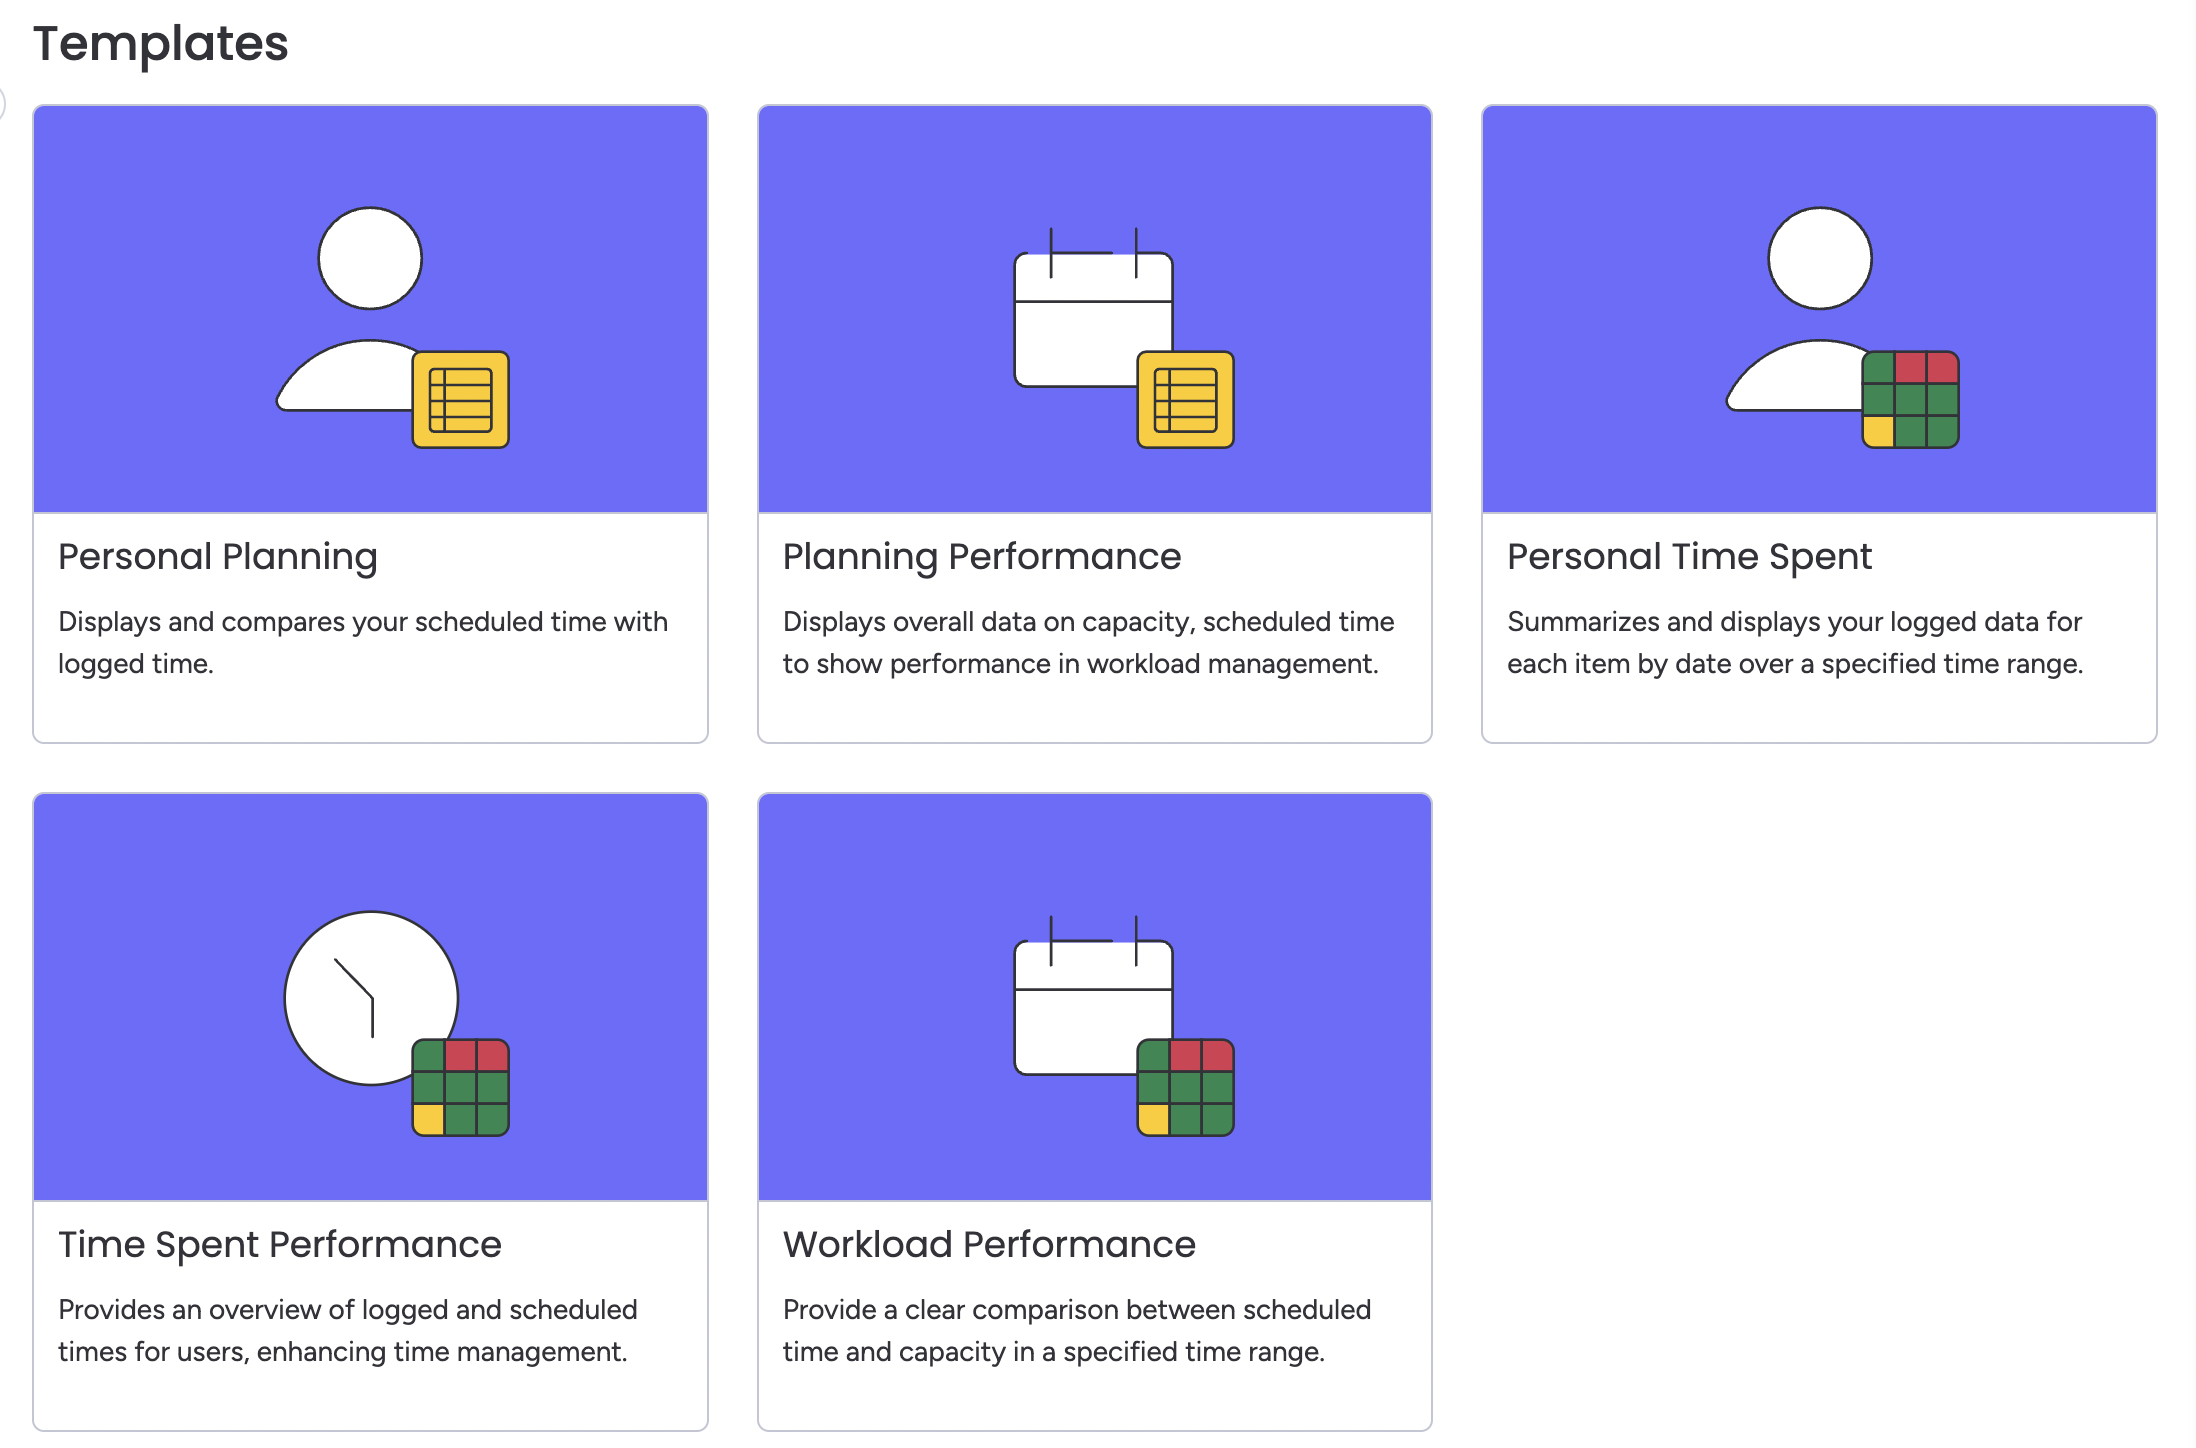
You can start your report by choosing one of the following templates:
-
Personal Planning (Table): A detailed, organized layout to track individual planning data.
-
Planning Performance (Table): A table layout to analyze performance against planning metrics.
-
Personal Time Spent (Heatmap): A visual heatmap to track how time is spent by each user.
-
Time Spent Performance (Heatmap): A heatmap to compare actual time spent with planned or expected performance.
-
Workload Performance (Heatmap): A heatmap to visualize team workload and performance trends.
-
Table Layout: Displays detailed, organized data.
-
Heatmap Layout: Provides a visual overview with color coding to highlight trends
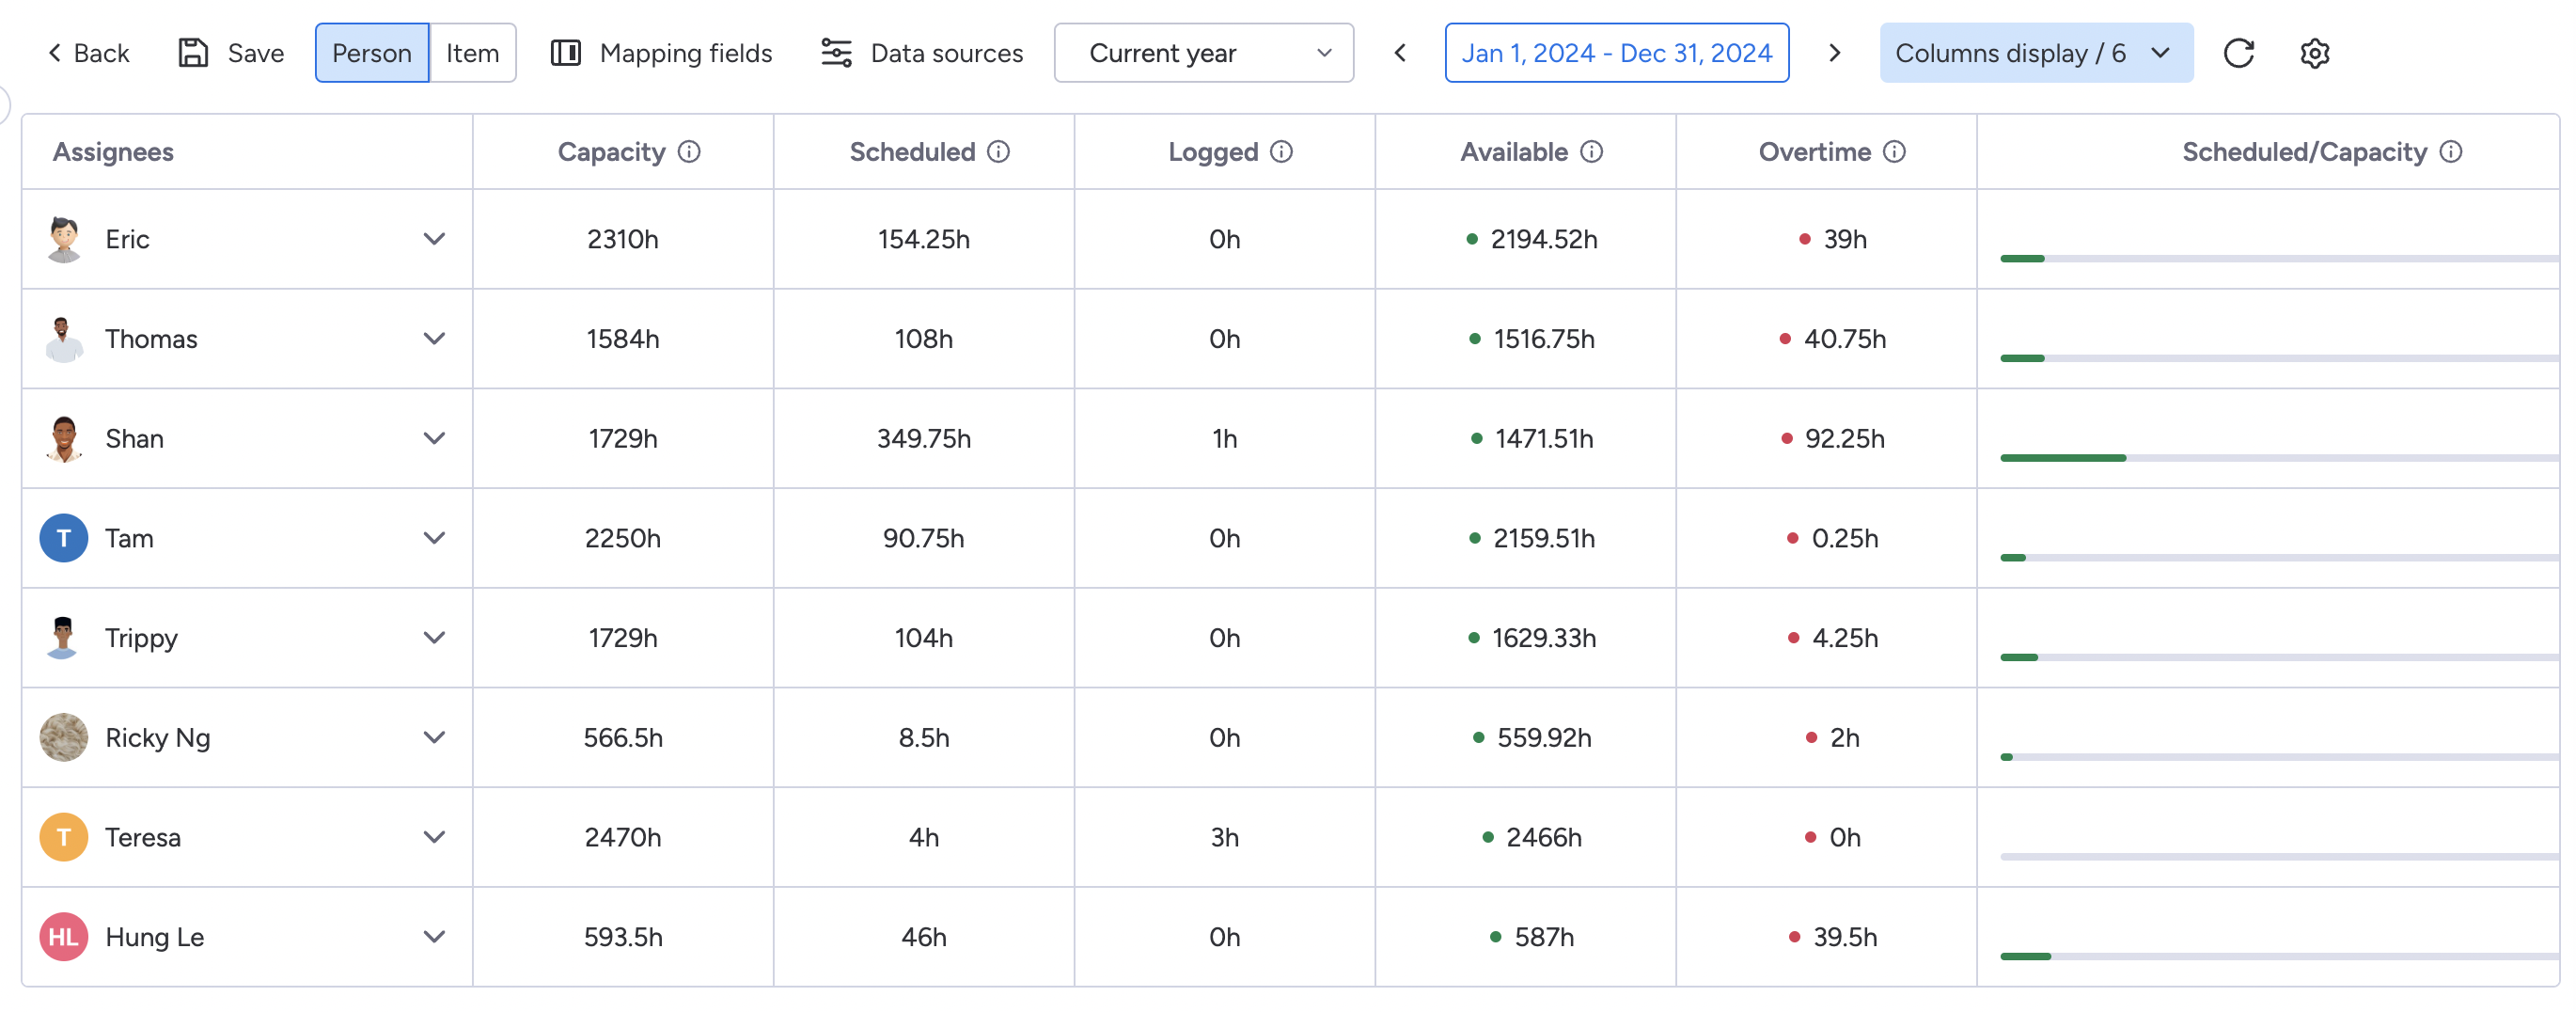
Table Layout
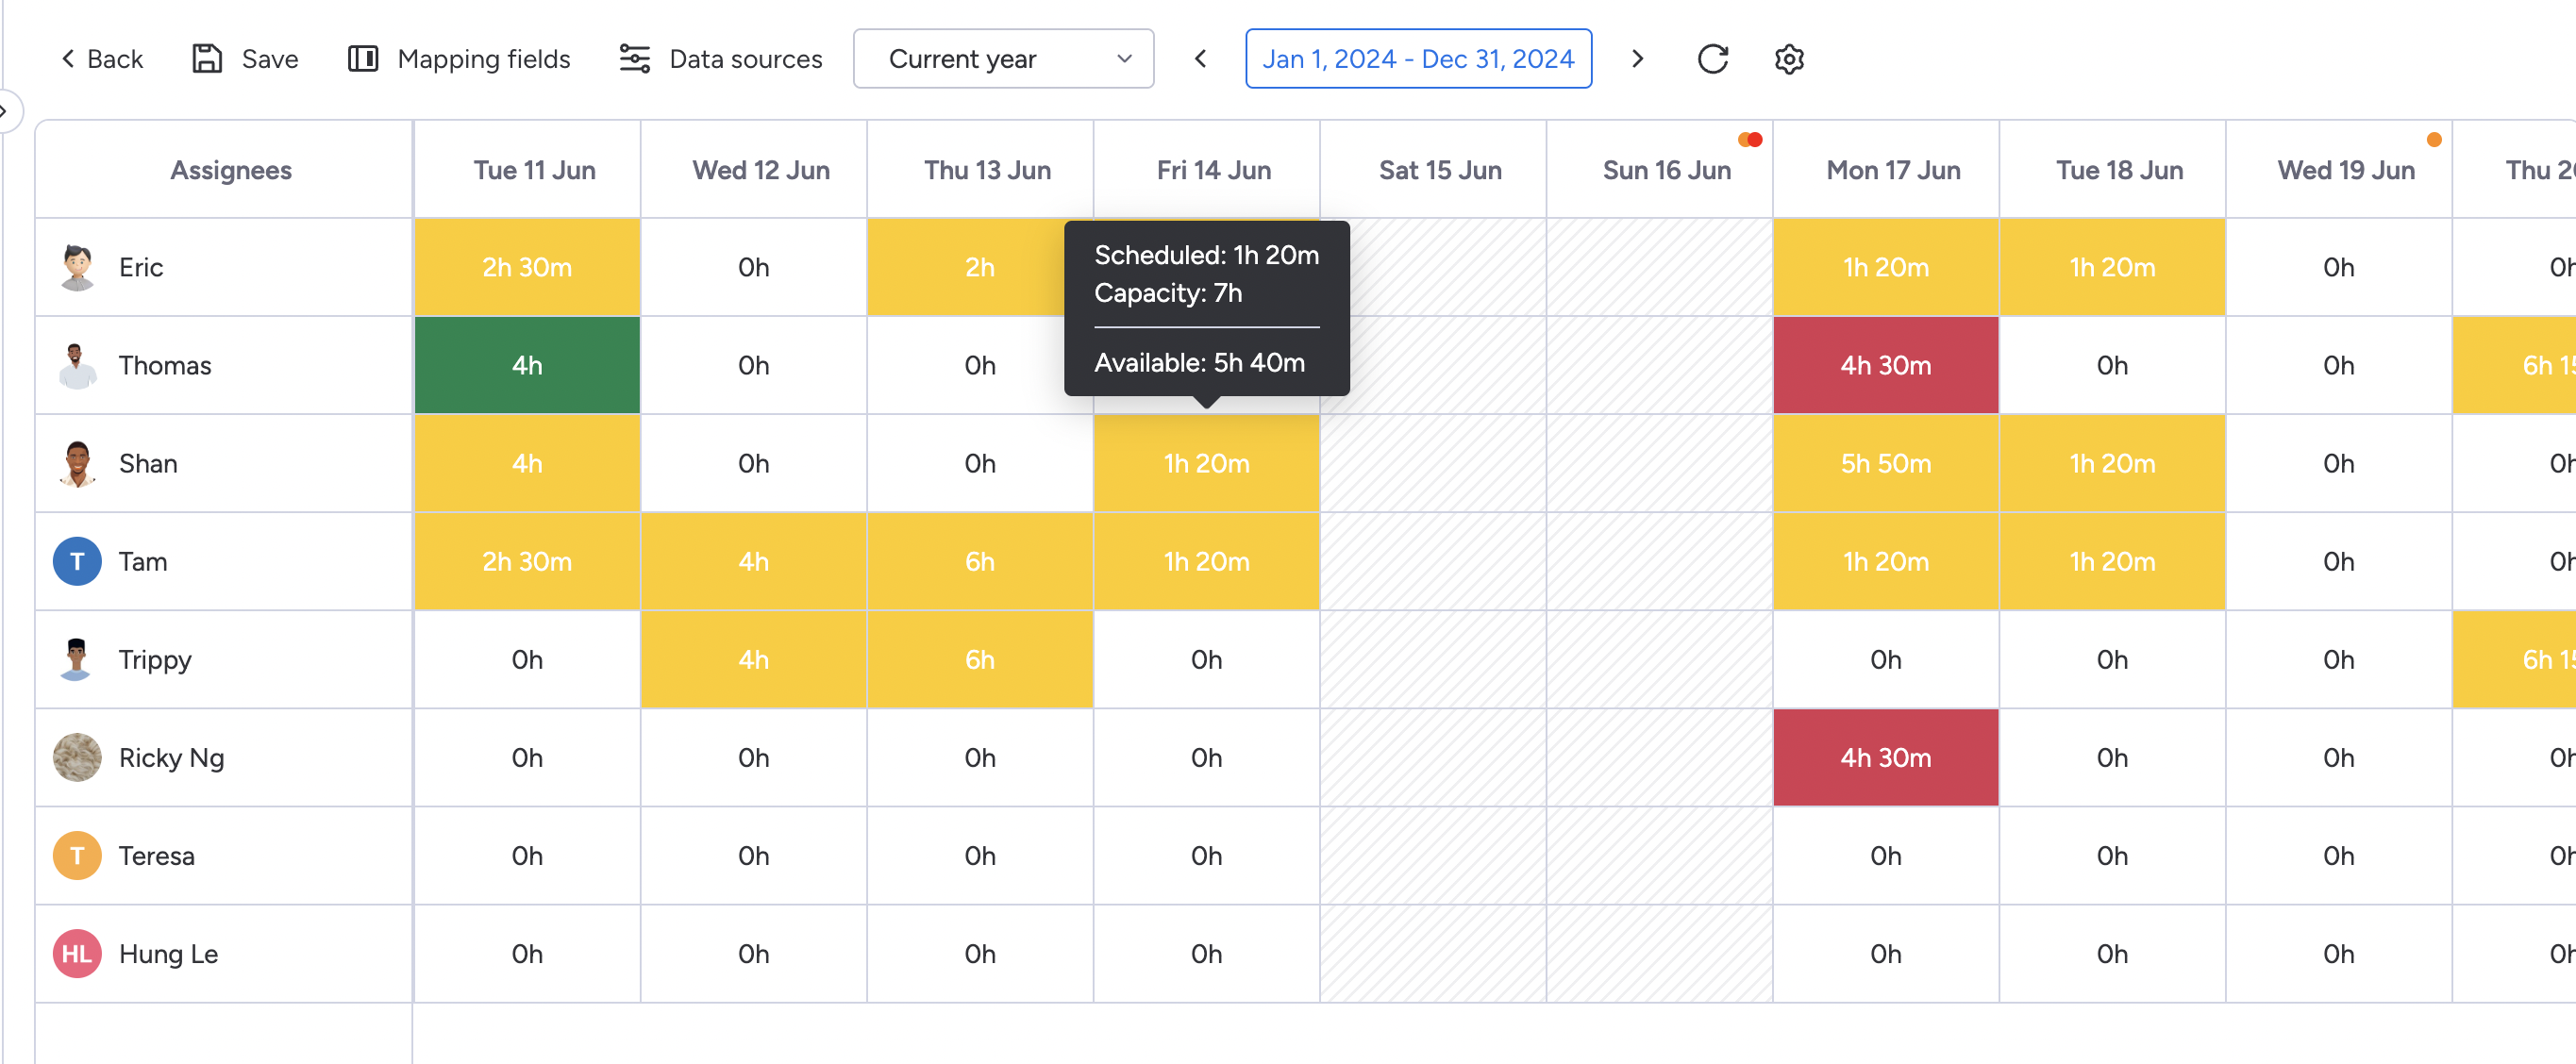
Heatmap Layout
Customize Your Report
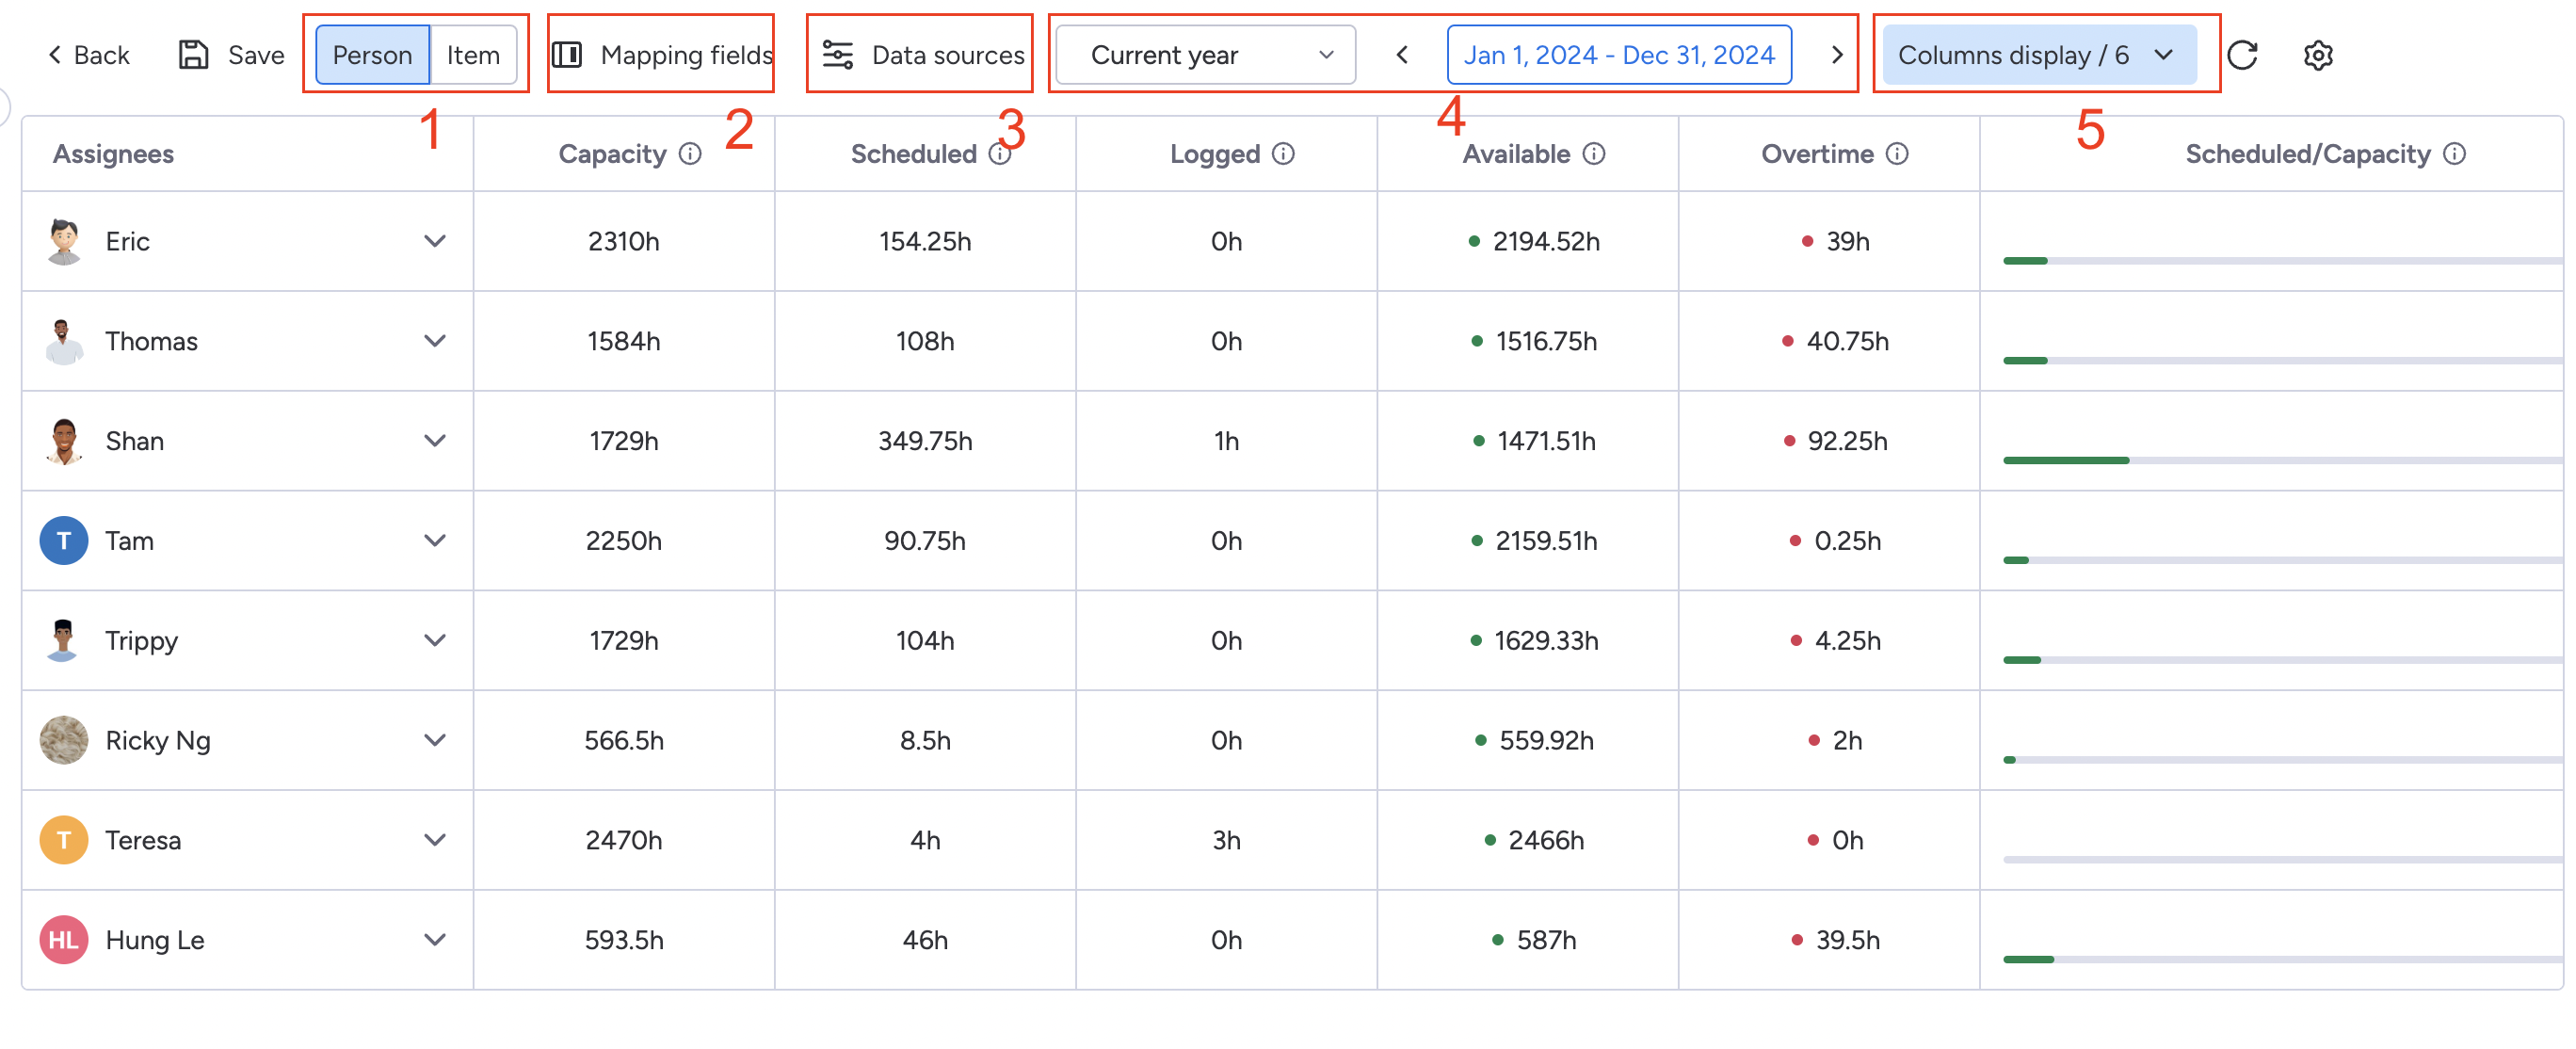
After choosing a template, you can personalize it to show exactly what you need. Start by:
-
Switching the view by person or item.
-
Mapping fields to sync the right columns from the boards (learn more about mapping fields here).
-
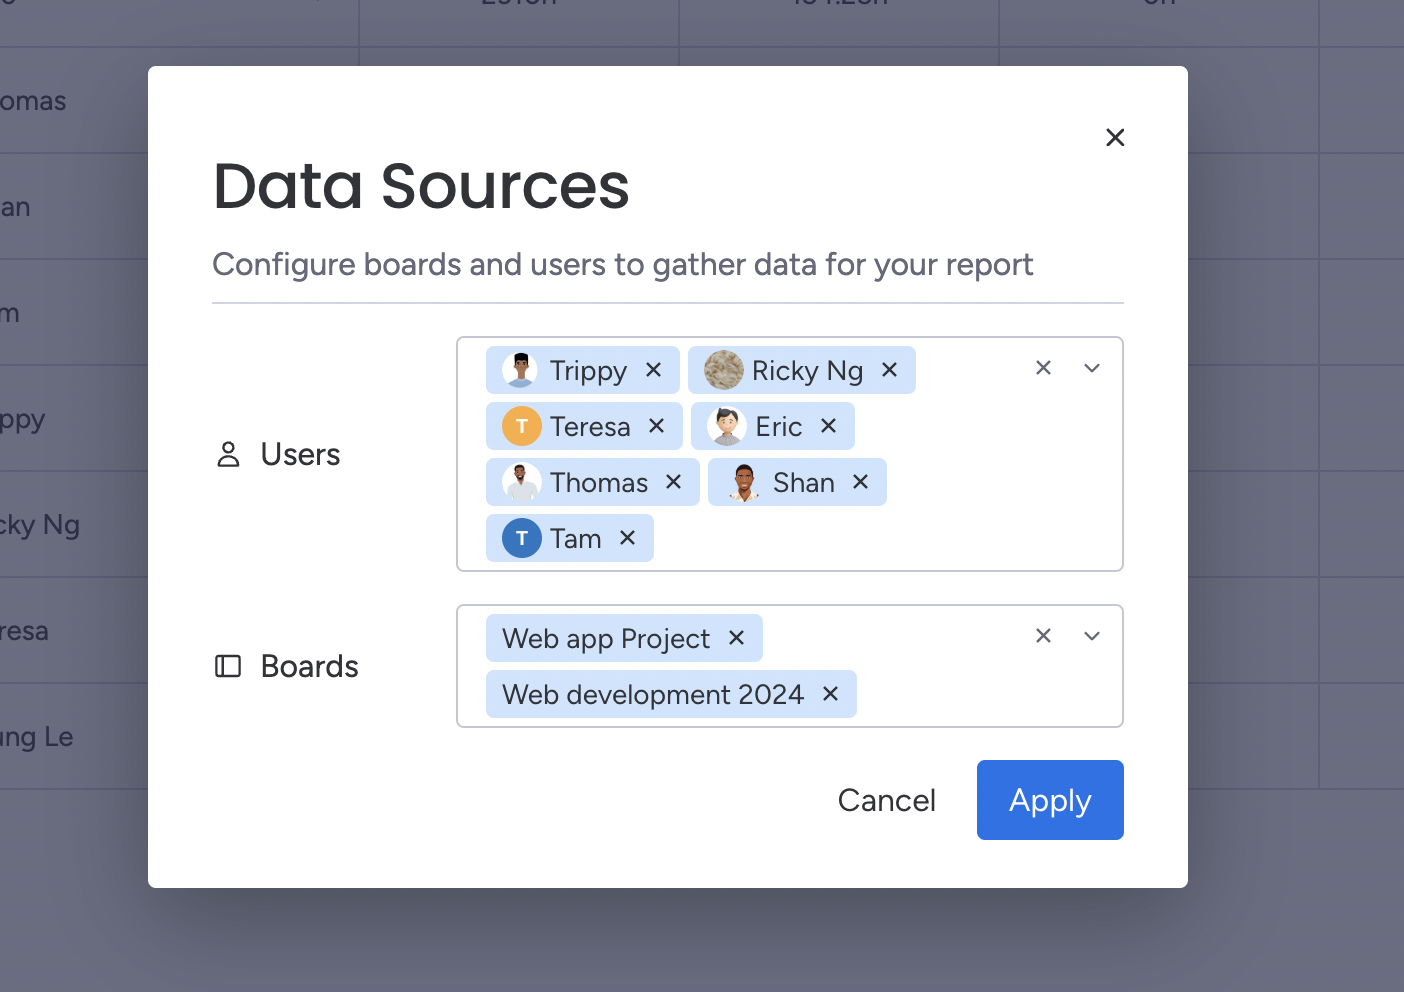
Selecting the boards and users you want to include from your data sources.
-
Choosing a timeframe (e.g., last week, this month, or a custom date range).
-
Picking the columns that contain the data you want to display (such as Scheduled, Logged, Capacity columns).
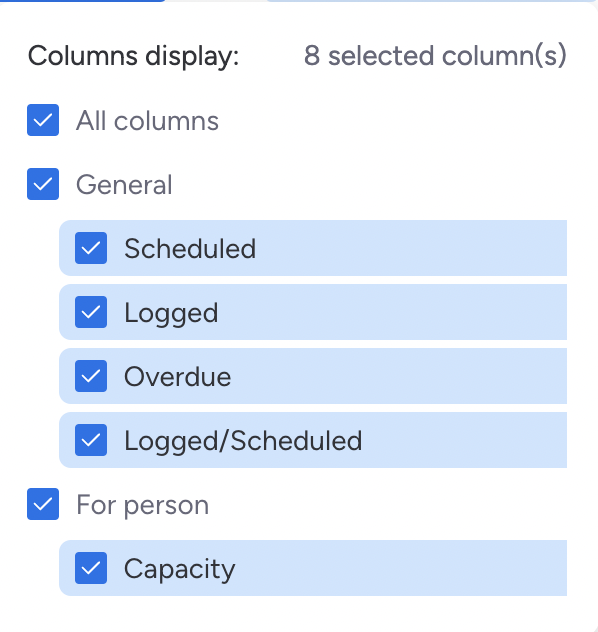
For example, if you want to compare how much time each user has spent versus their scheduled and logged time, select the Scheduled, Logged, and Capacity columns.
Save Your Report
-
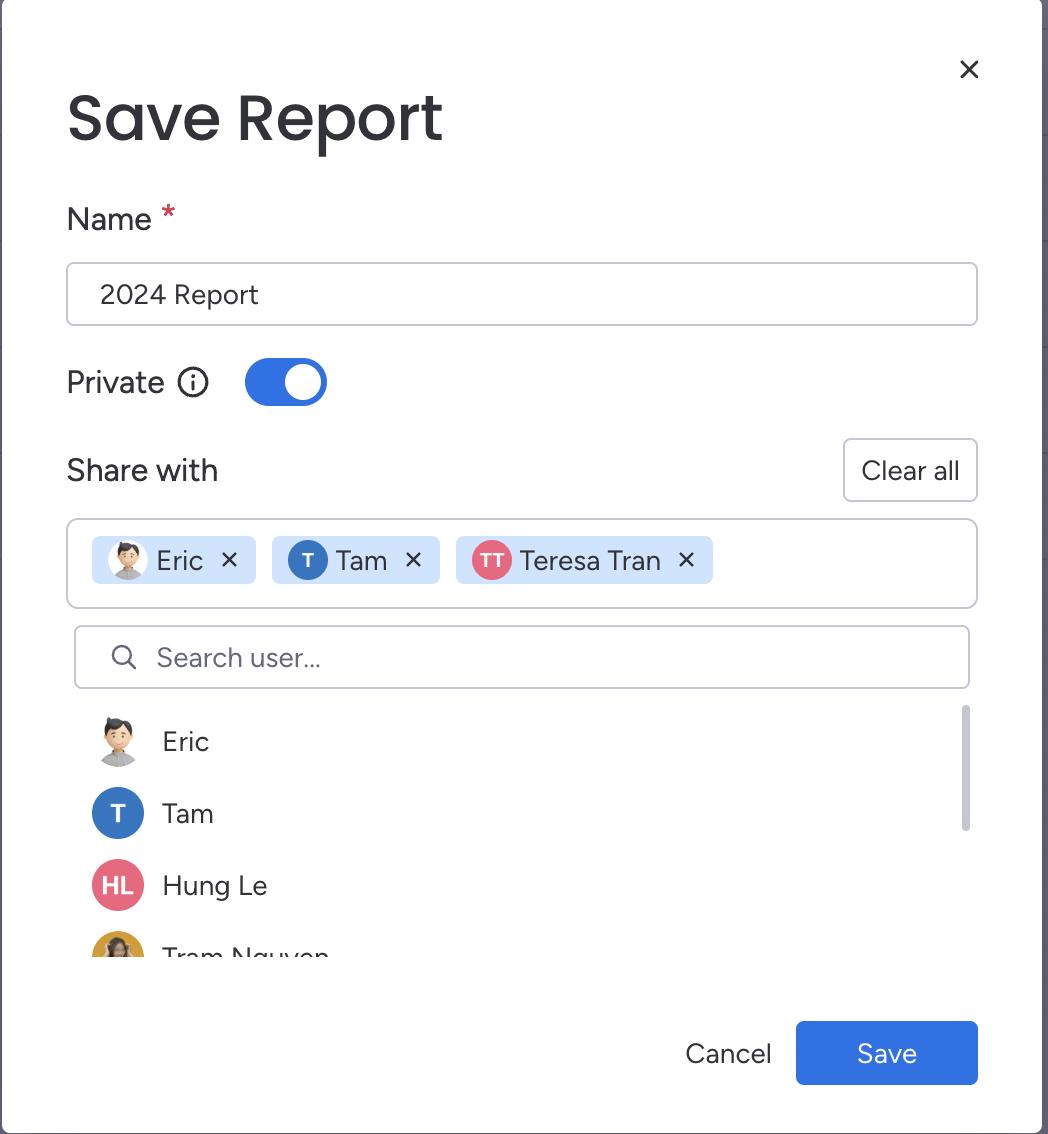
After you've finished setting up your report. Click the Save button. A prompt will appear asking you to give your report a name.
-
Decide if your report should be Private or Public
-
Private: Only you can view and edit the report.
-
Public: Other users with access can view the report, but only you (the report owner) can edit or delete it.
-
Click Save again to confirm. Your report will now appear in the Saved Reports section of the dashboard.
Manage Existing Reports
-
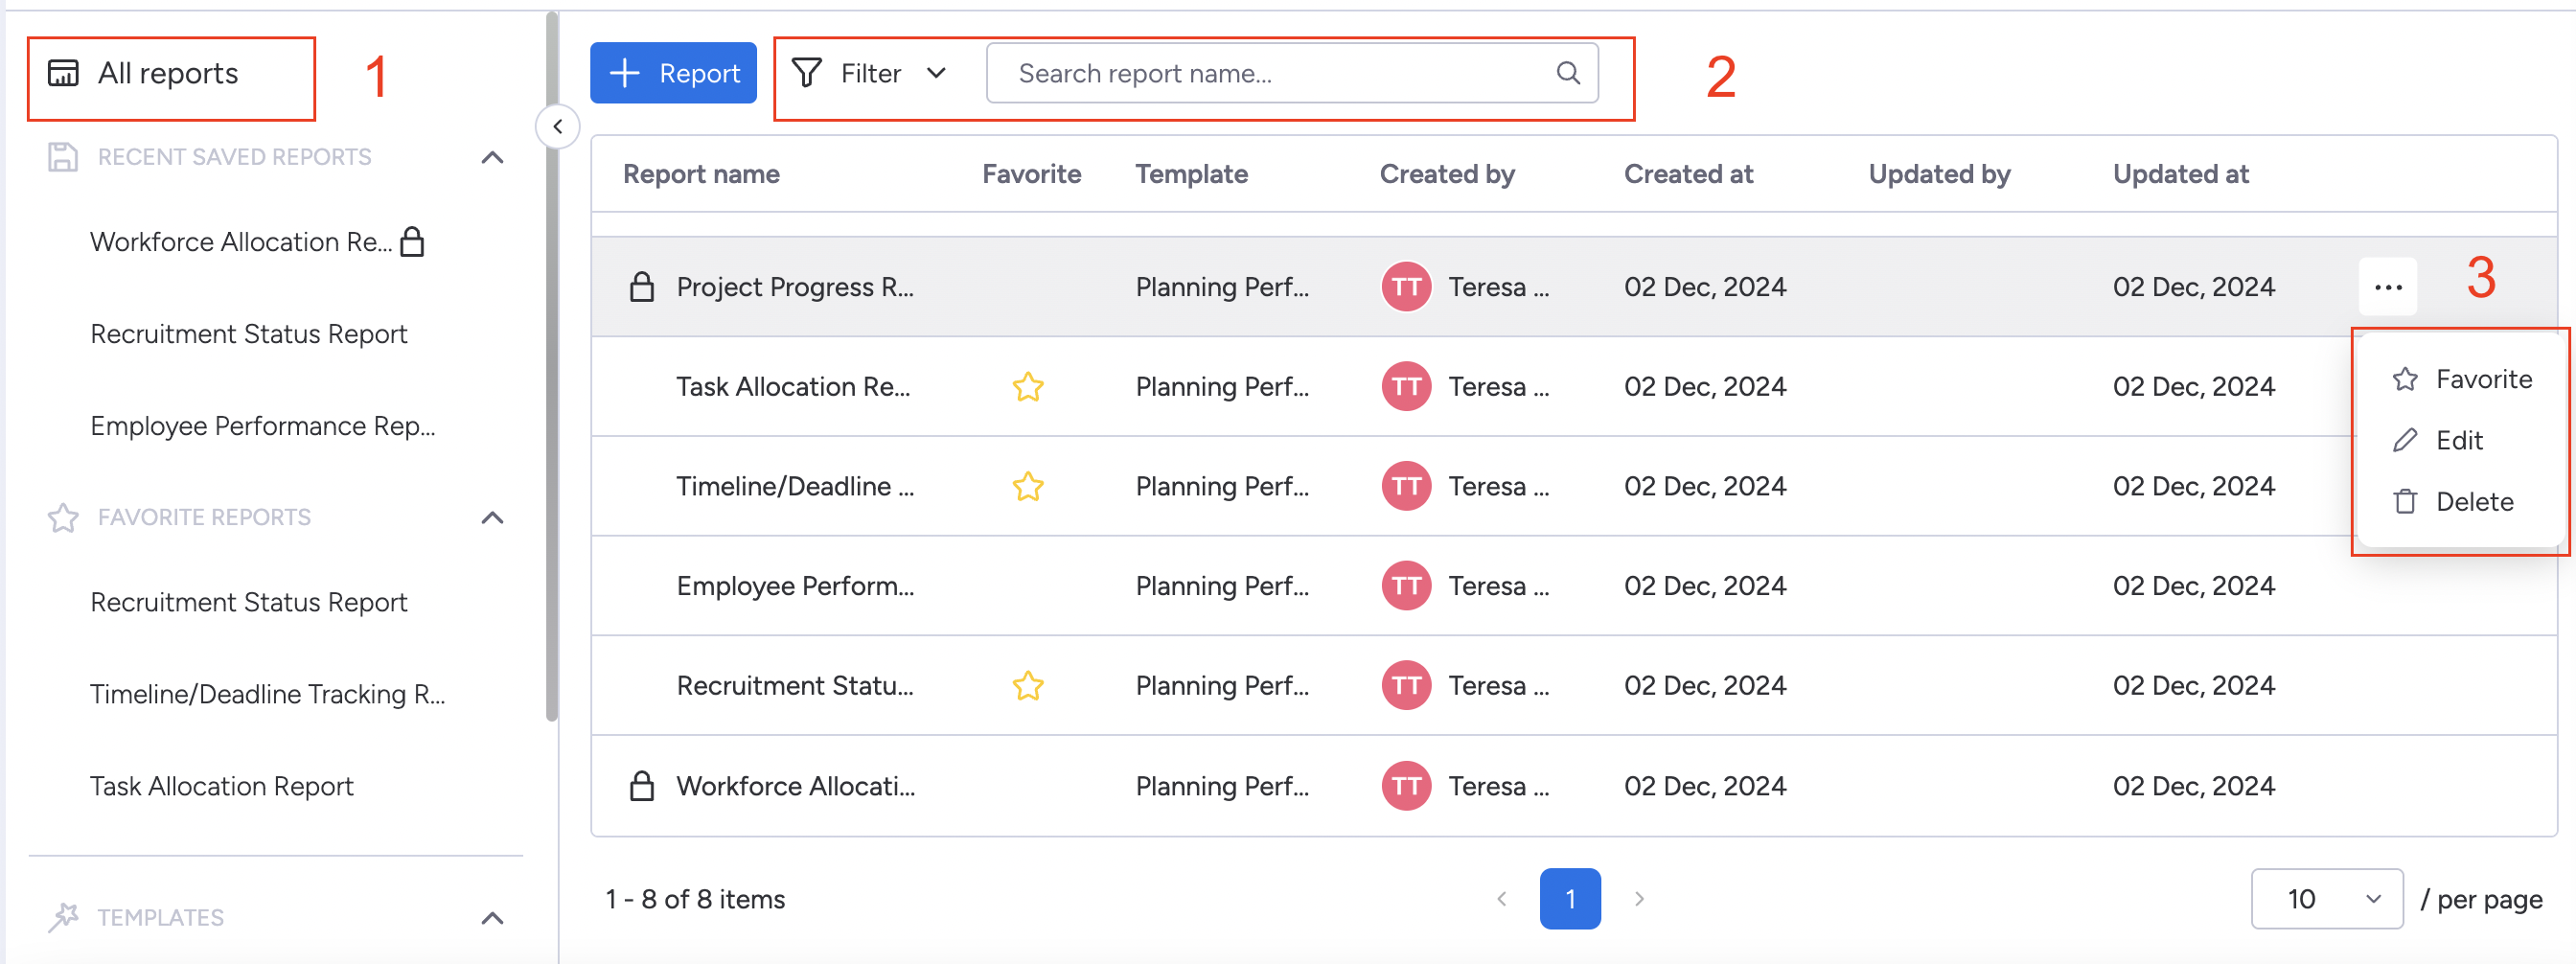
Go to All Reports section to easily manage your reports.
-
Use the search bar or filters to find specific reports quickly.
-
Click the three-dot menu (⁝) next to any report. You’ll have the following options:
-
Add to Favorites: Click to mark the report as a Favorite, for quick access later.
-
Delete: Click to delete the report (only if you are the owner).
-
Edit: Click to make changes to the report.
Users with access can only view the report. Editing or deleting the report is restricted to the owner.
We're here to provide you with comprehensive support to ensure you get the most out of TeamBoard. Whether you need assistance with setup, have questions about features, or require technical support, our dedicated team is ready to help.
📫 Email us: hello@teamboard.cloud
Happy planning and organizing! ♥️