.png)
Workload View
In TeamBoard TimePlanner, Workload View helps you see how scheduled work compares with each member’s working capacity. It makes it easier to identify members who are underutilized, fully booked, or overloaded and rebalance work when needed.
Workload is calculated using:
Workload = Scheduled Hours ÷ Working Capacity × 100
-
Scheduled hours: Total hours planned for a member during the selected period.
-
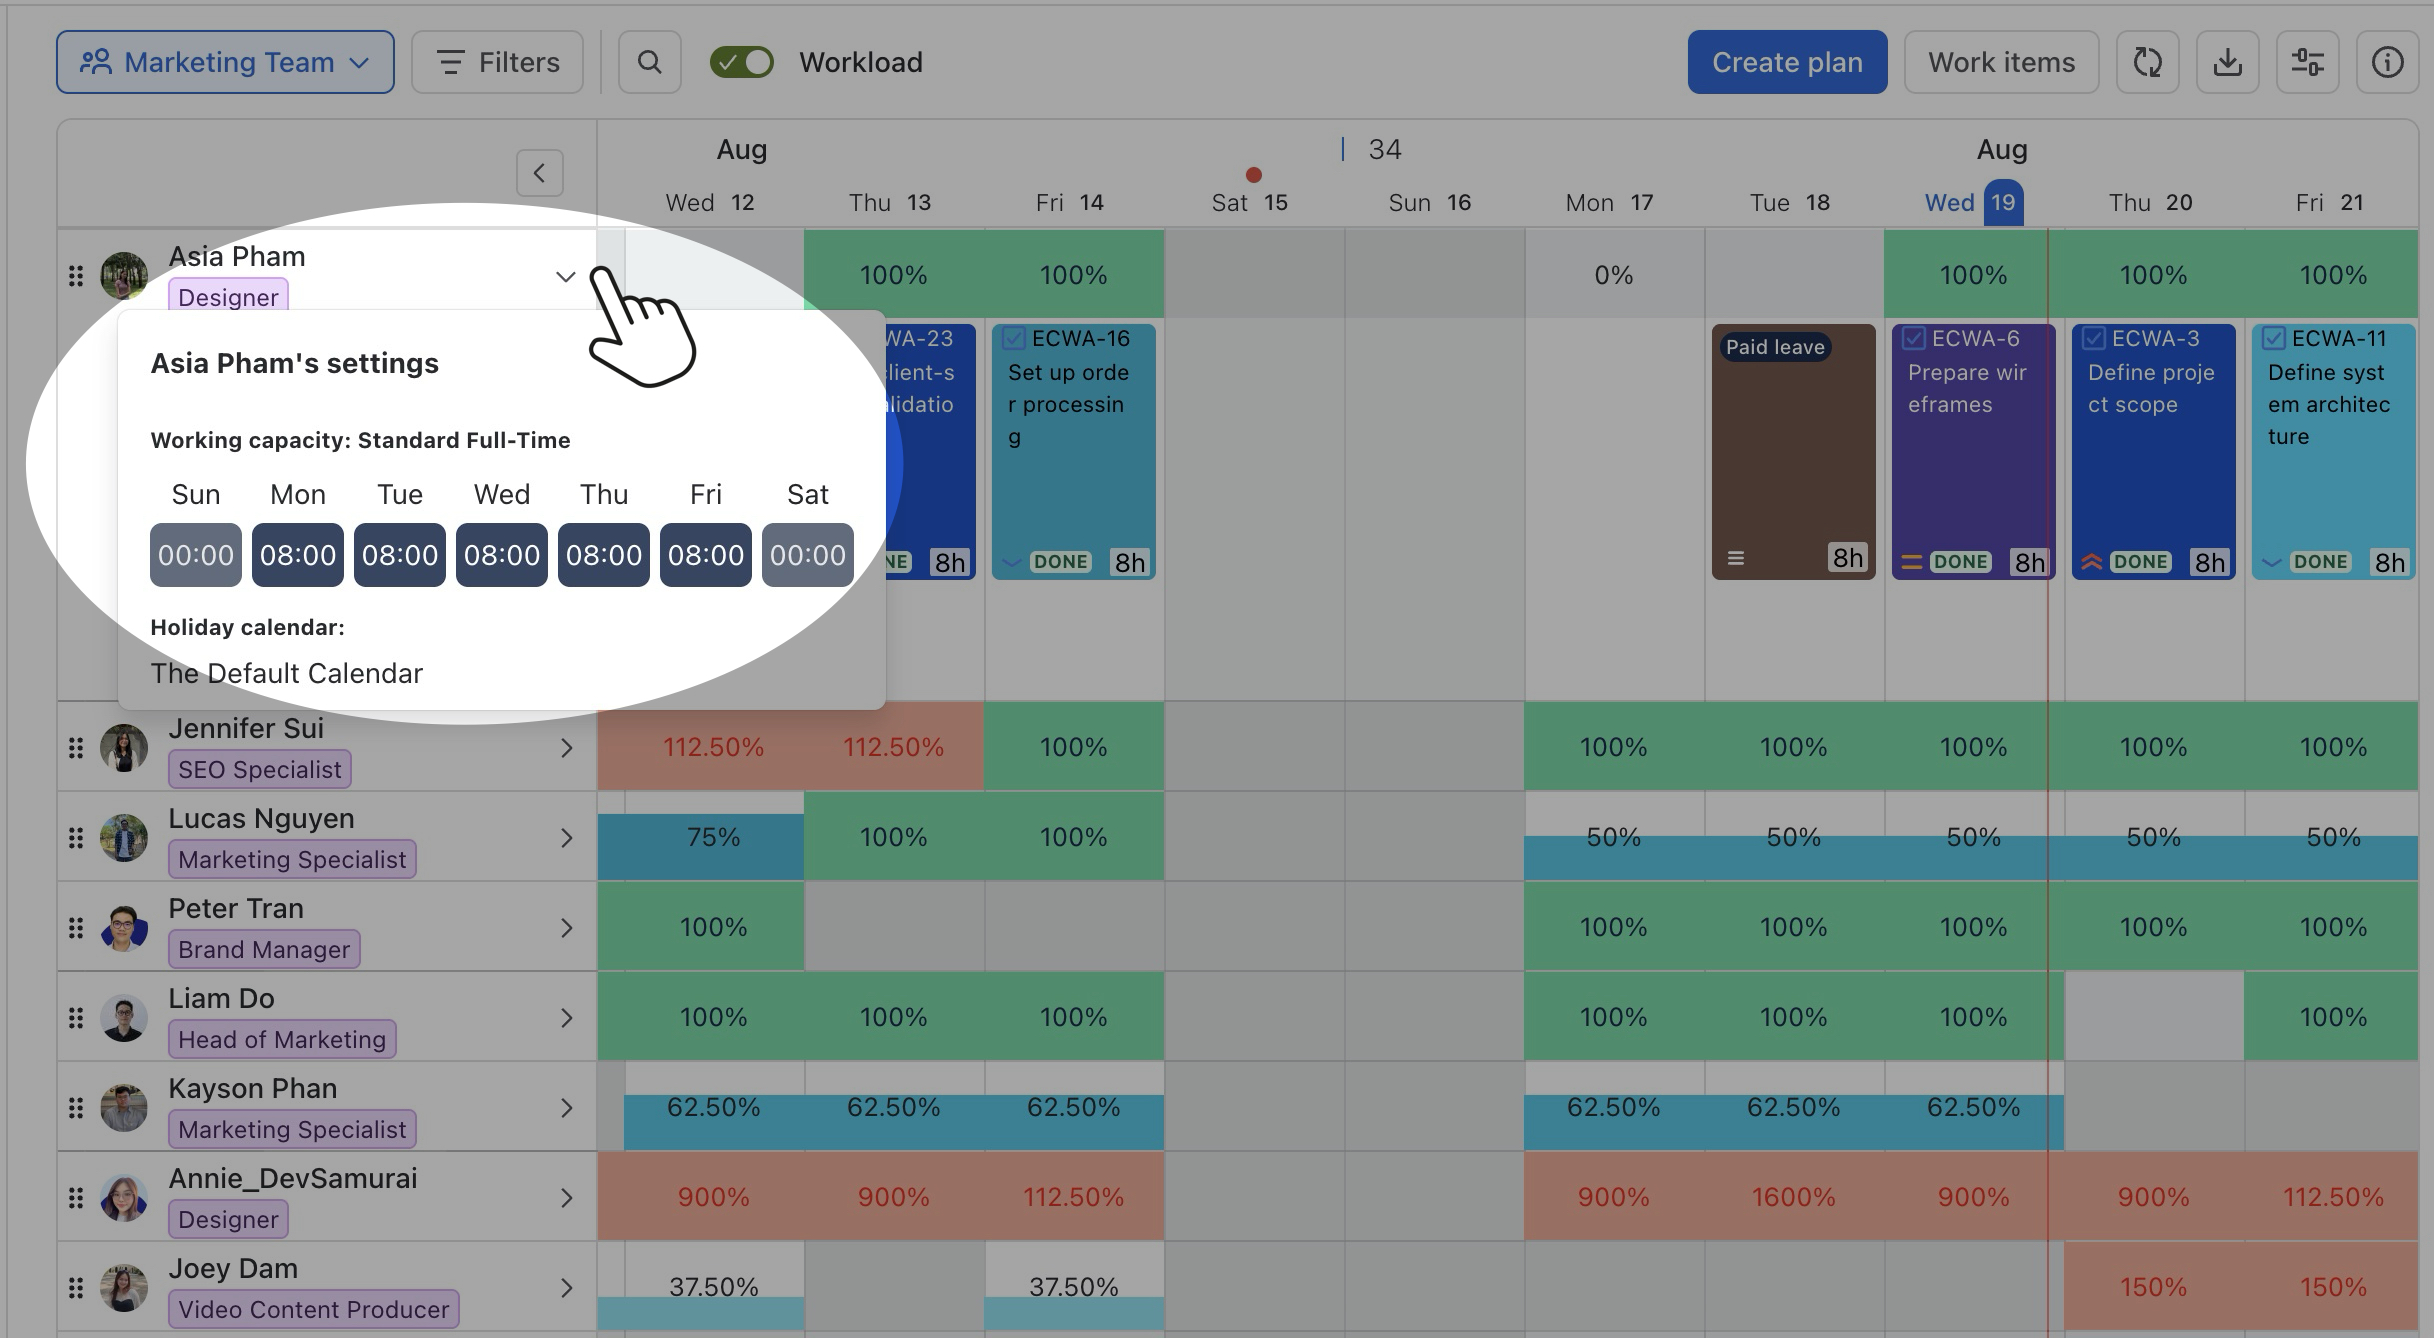
Working capacity: The number of hours the member is available to work, such as
8h/day.
To configure and manage resource capacity across your organization, go to the Working Capacity section in System Settings.
Including Events in Workload
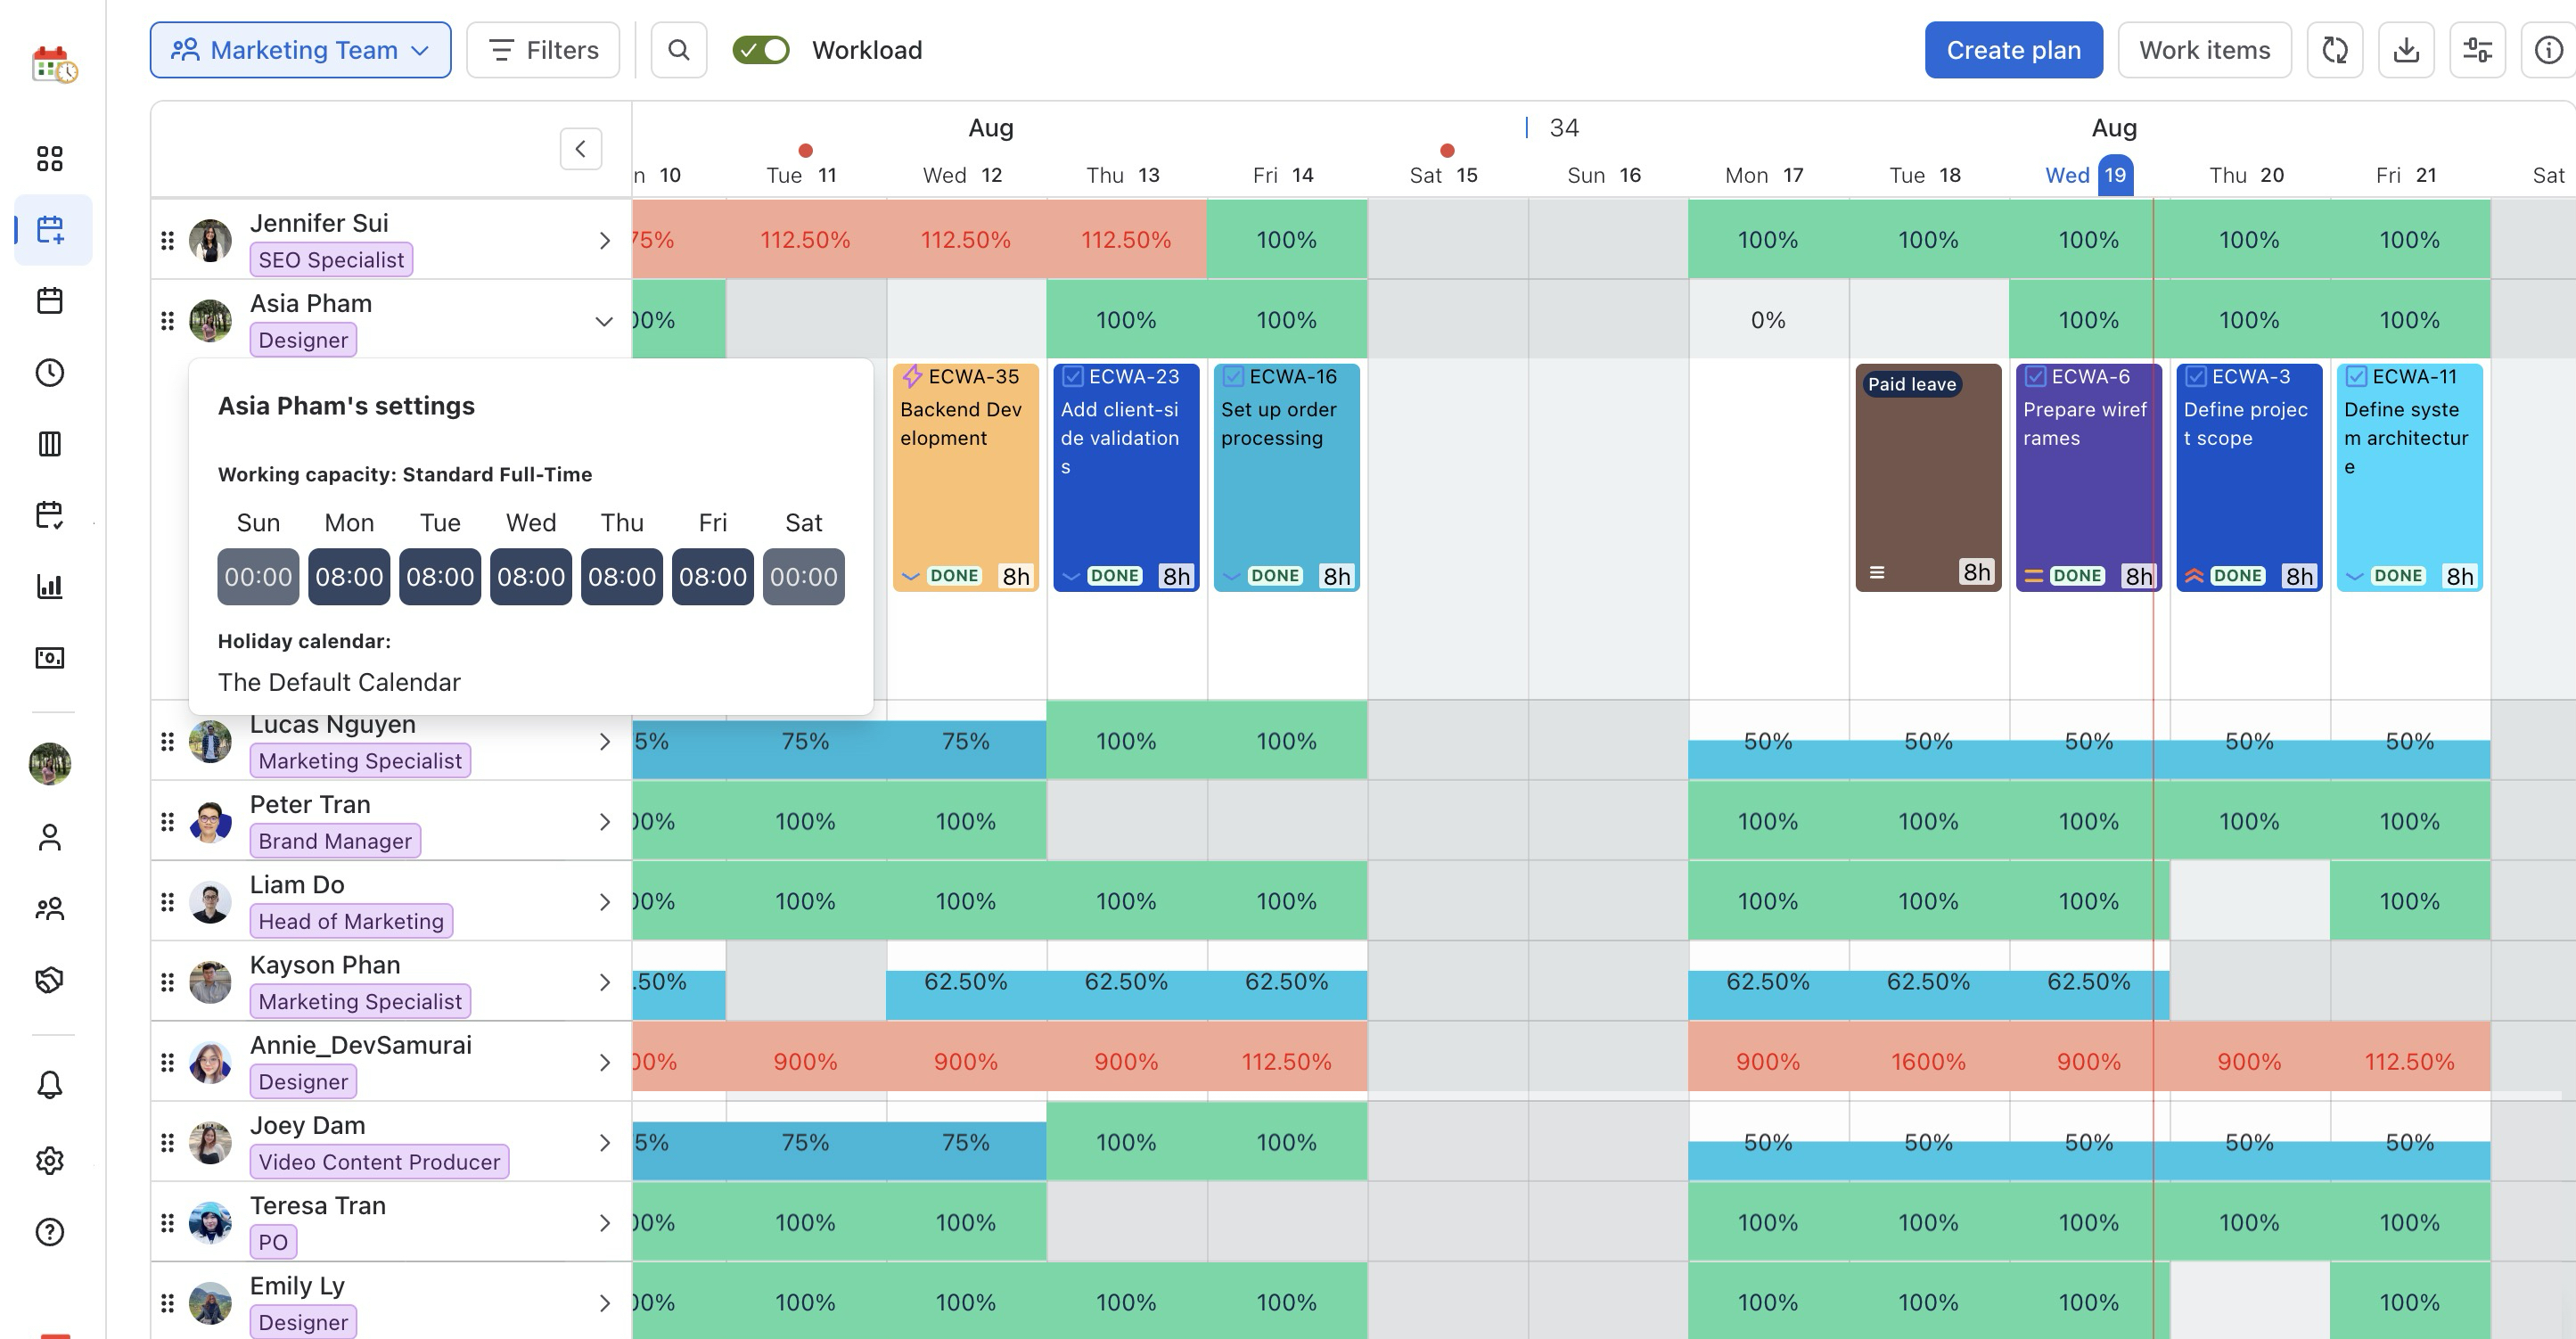
When you enable Allow Events in Schedules in the General Settings, the system will automatically include your calendar events (such as meetings, appointments, training sessions, etc.) in the workload calculations.
This ensures that your schedule reflects not only your tasks but also any non-task-based time blocks, giving a more complete view of your availability.

Viewing workload
How to enable workload view
-
Navigate to the Schedule Board from the left-hand menu.
-
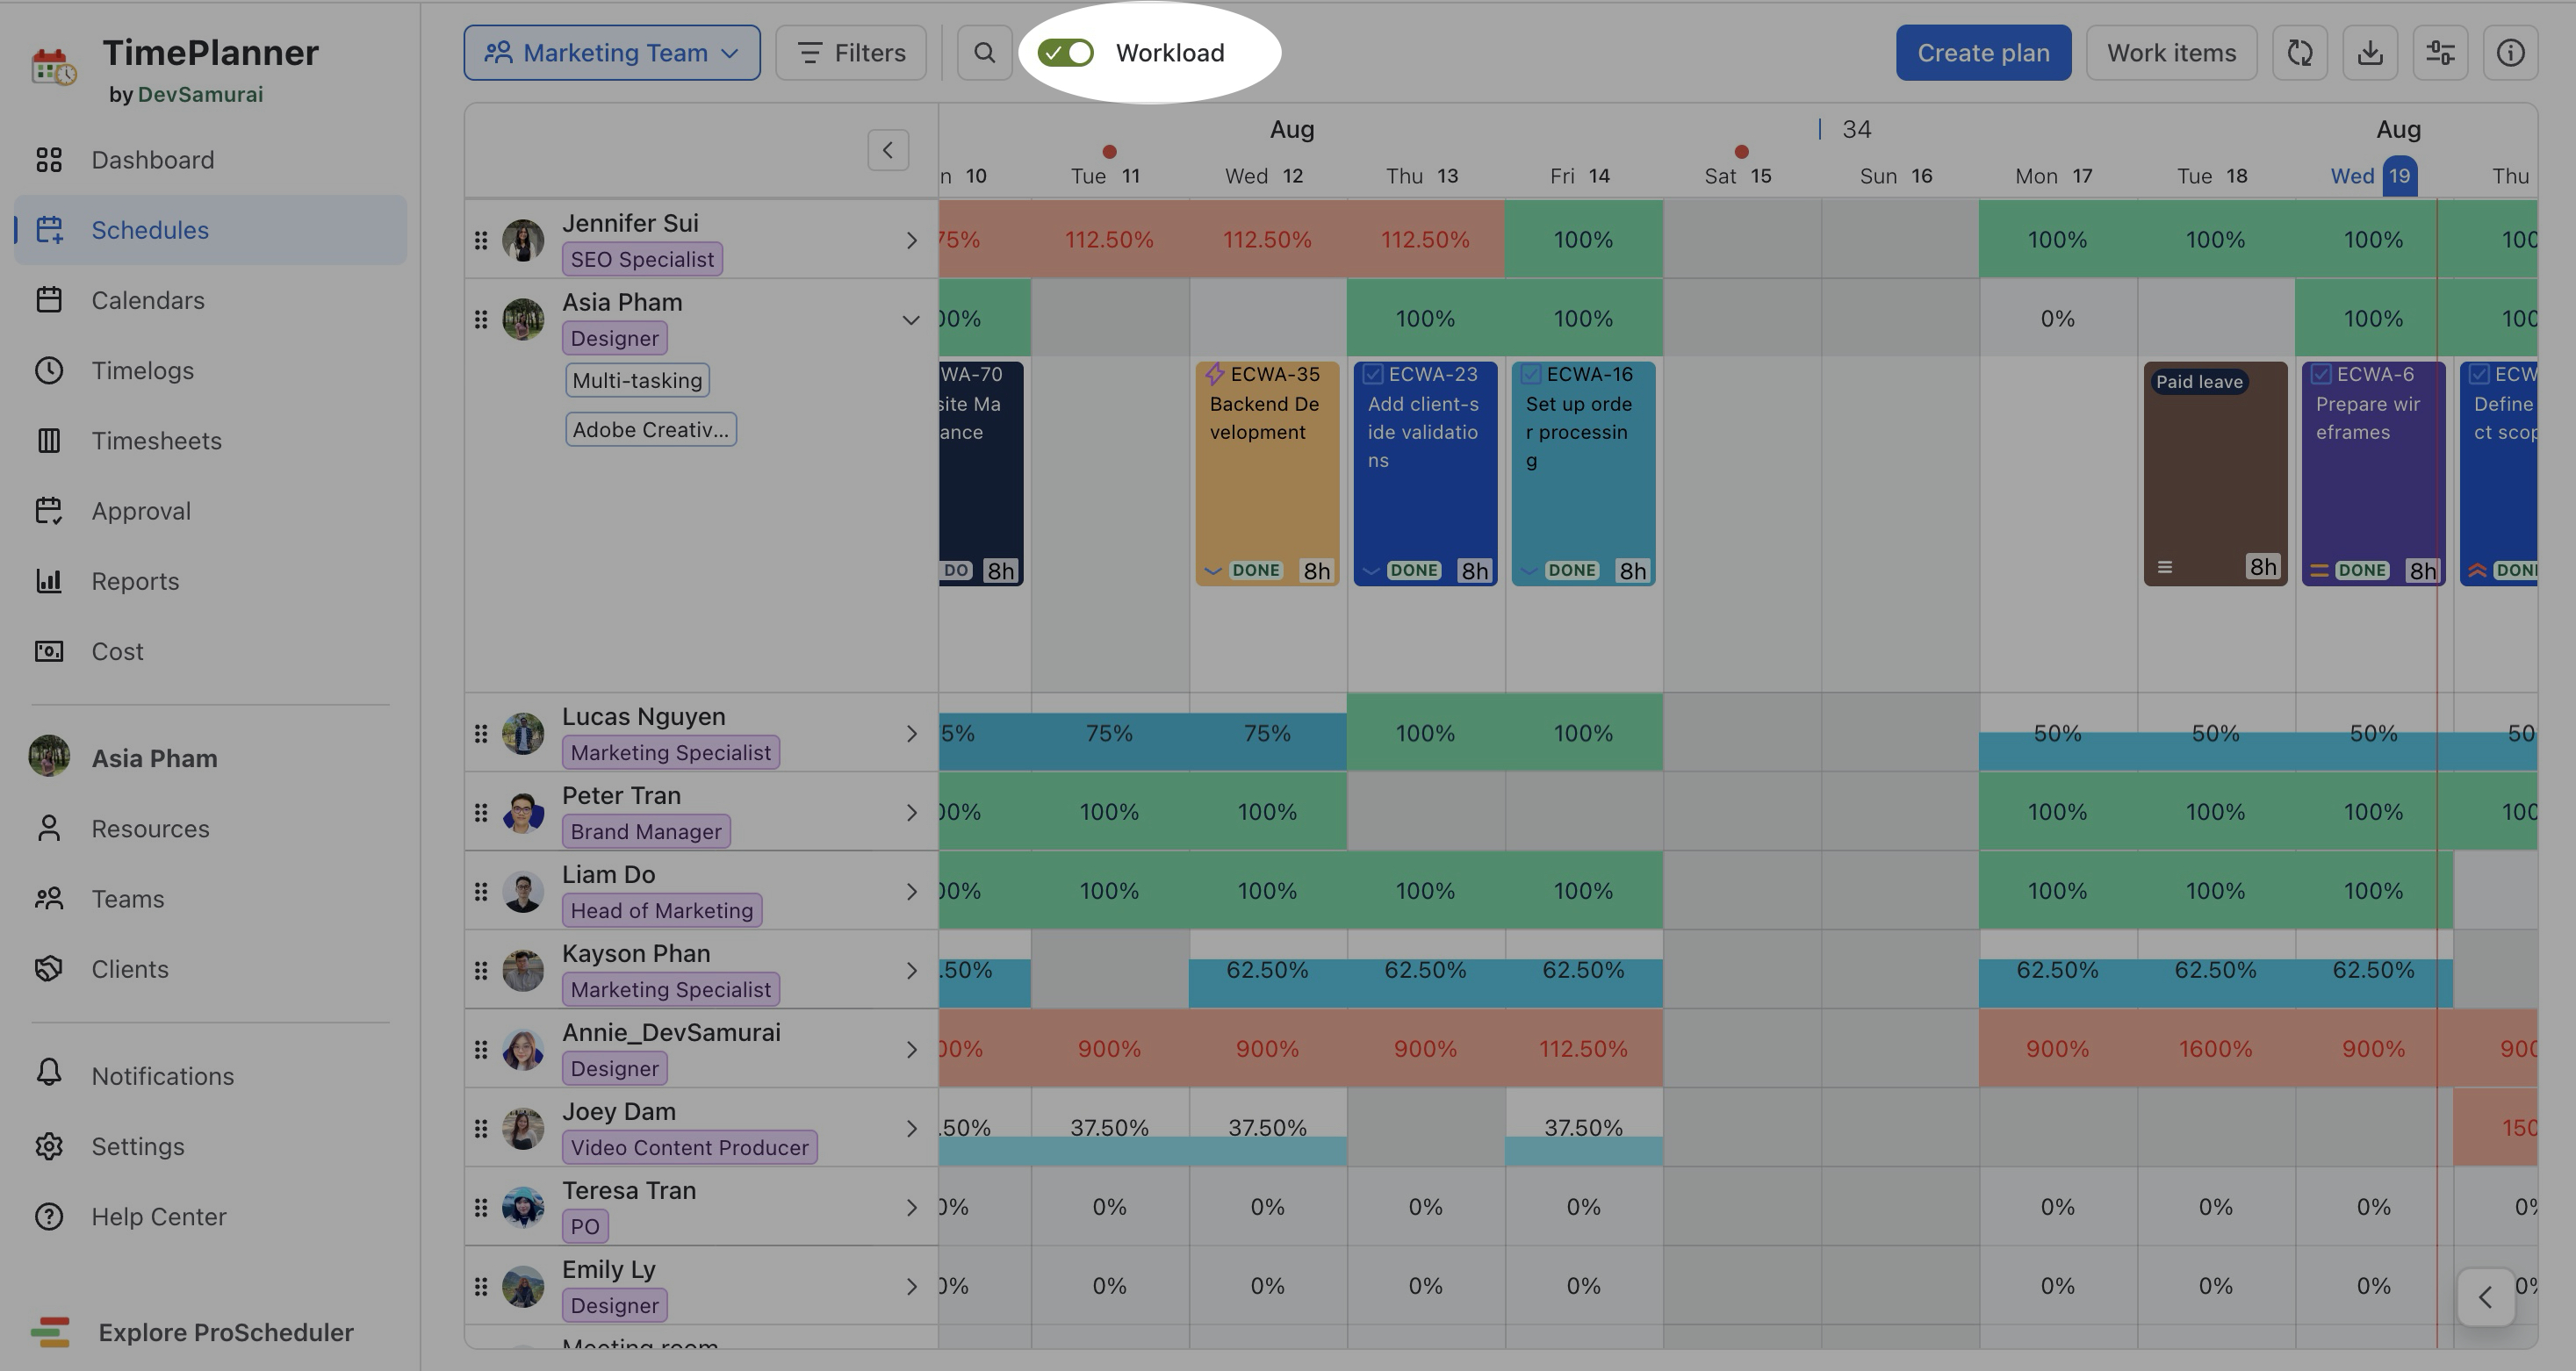
Turn on Workload from the Schedule Board toolbar.
Understanding the workload indicators
The color coding system helps you visually track the workload of each team member. By looking at the colors on the Schedule Board, you can quickly determine whether a team member is under-booked, fully booked, or overloaded for the day. Here's what each color represents:
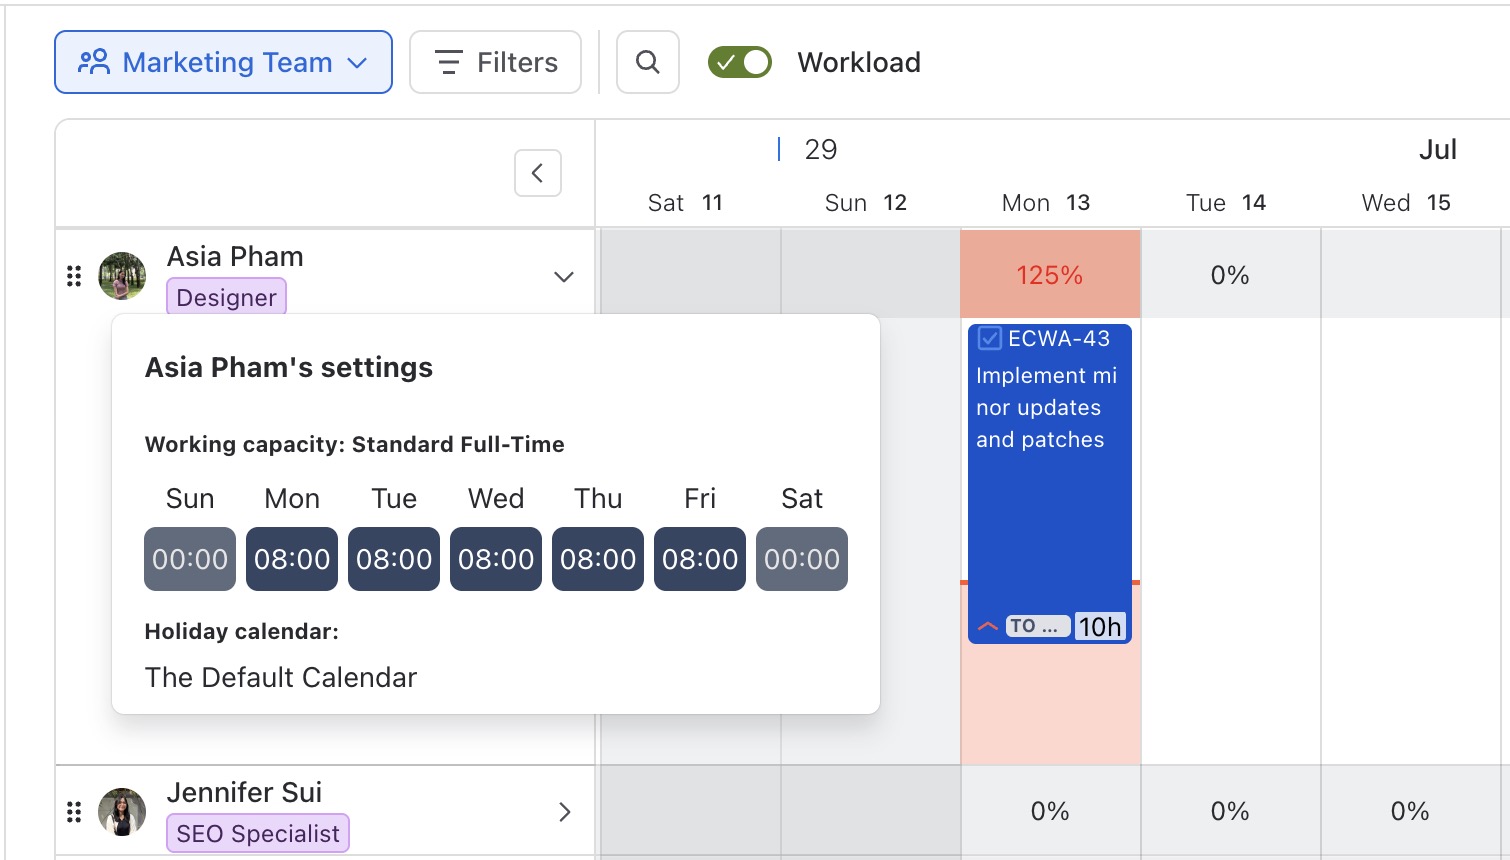
RED INDICATOR : Overloaded Workload
The person has more tasks assigned than they can handle within a day. This indicates they are overloaded, and their workload exceeds their capacity for that day.
Example
Scheduled Hours: 10 hours of tasks are planned for the day.
Working Capacity: The daily capacity is 8 hours.
→ The workload cell will be red, showing 125%
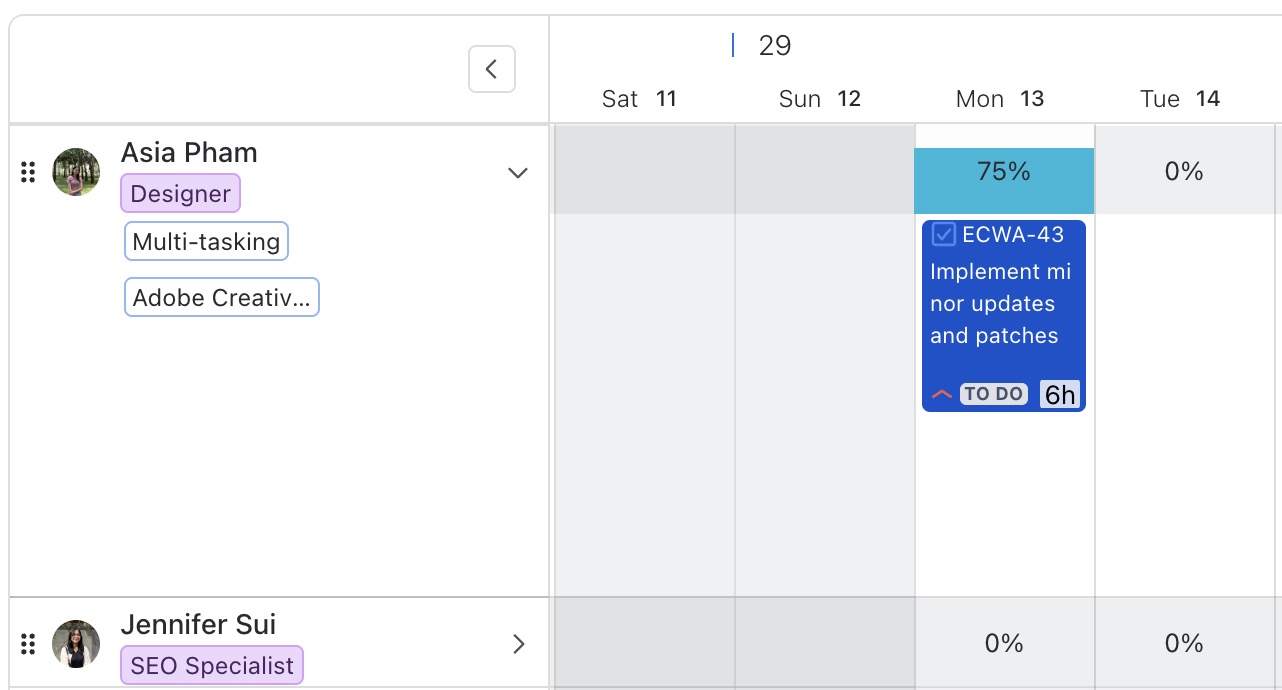
BLUE INDICATOR : Lighter Workload
The person has fewer tasks assigned than they can handle within a day. This indicates they are underutilized, and their workload is less than their capacity for that day.
Example
-
Scheduled Hours: 6 hours of tasks are planned for the day.
-
Working Capacity: The daily capacity is 8 hours.
→ The workload cell will be blue, showing 75%.
GREEN INDICATOR : Balanced Workload
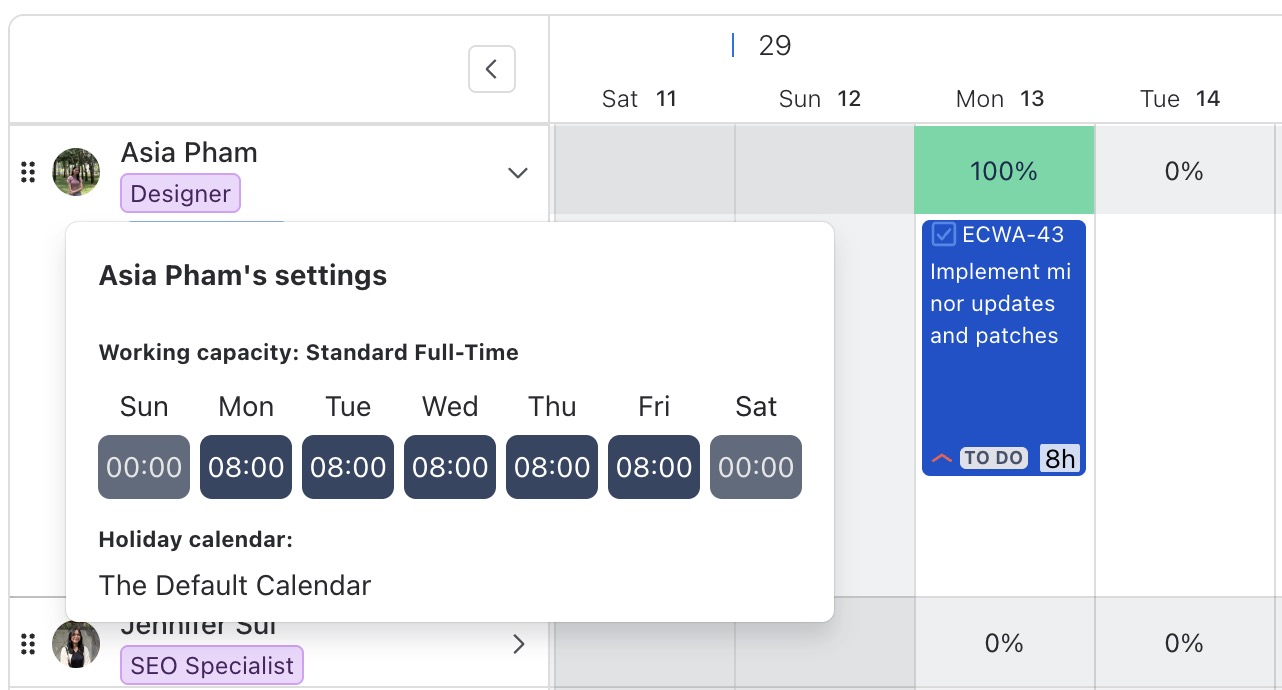
The person has tasks assigned that perfectly match their available capacity for the day.
Example
-
Scheduled Hours: 8 hours of tasks are planned for the day.
-
Working Capacity: The daily capacity is 8 hours.
→ The workload cell will be green, showing 100%.
Tip for Managing Workload
-
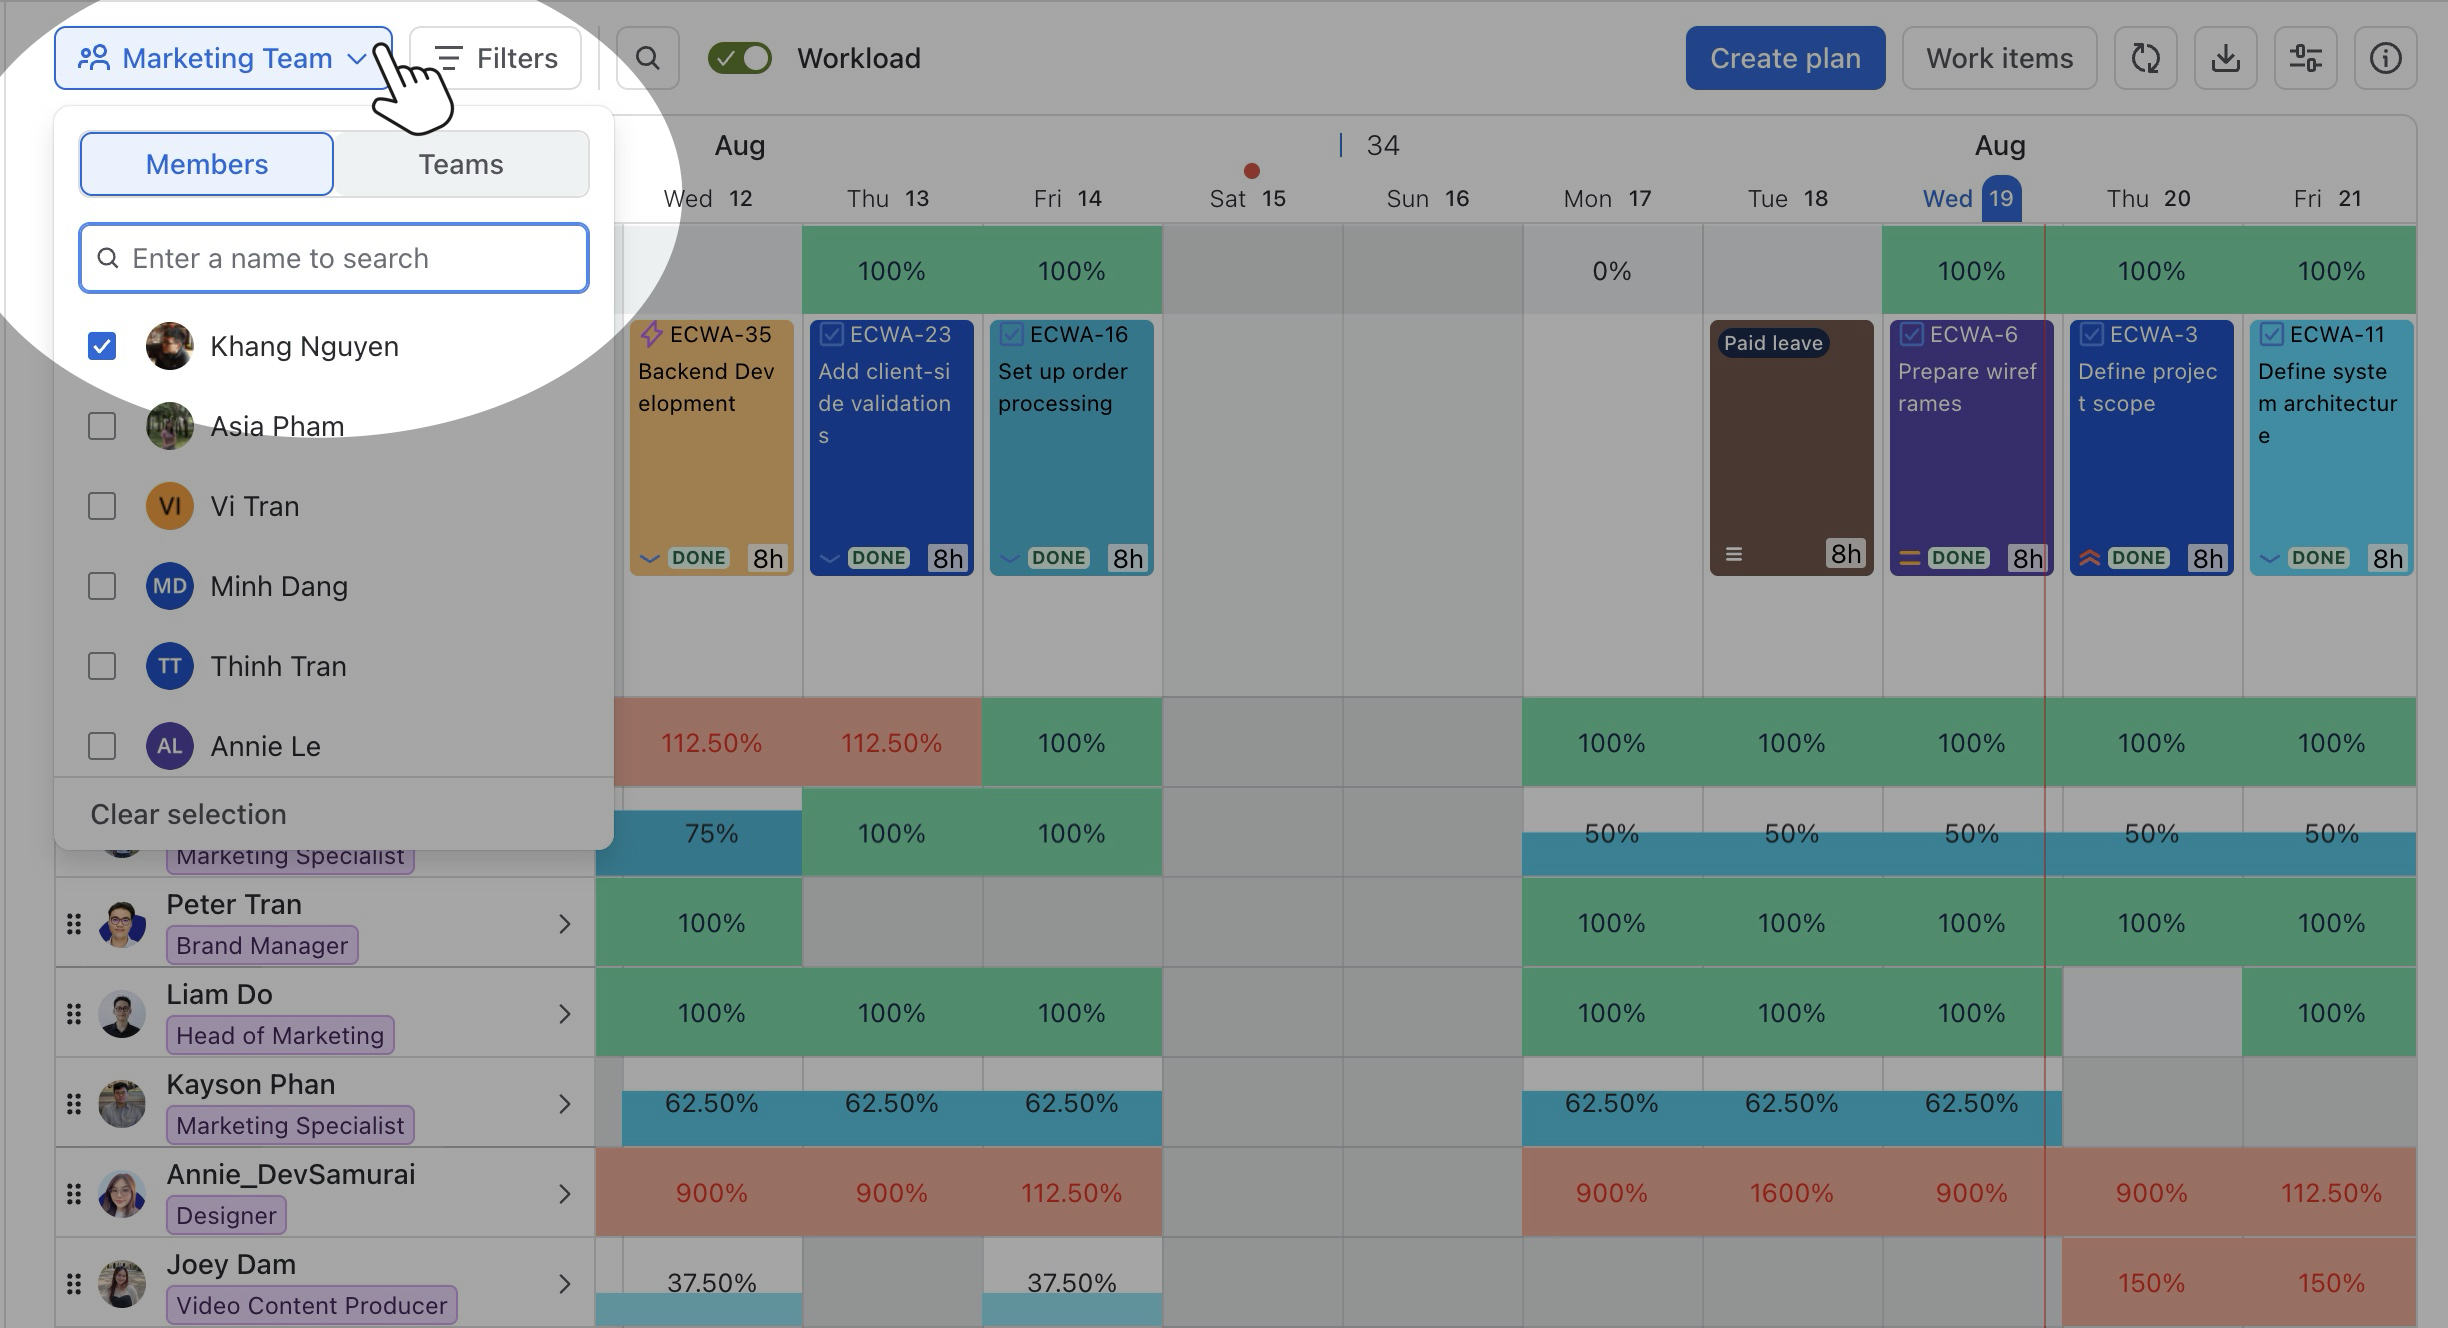
Focus on specific groups: Switch between Members or Teams view to concentrate on the workload of particular teams or individuals.
-
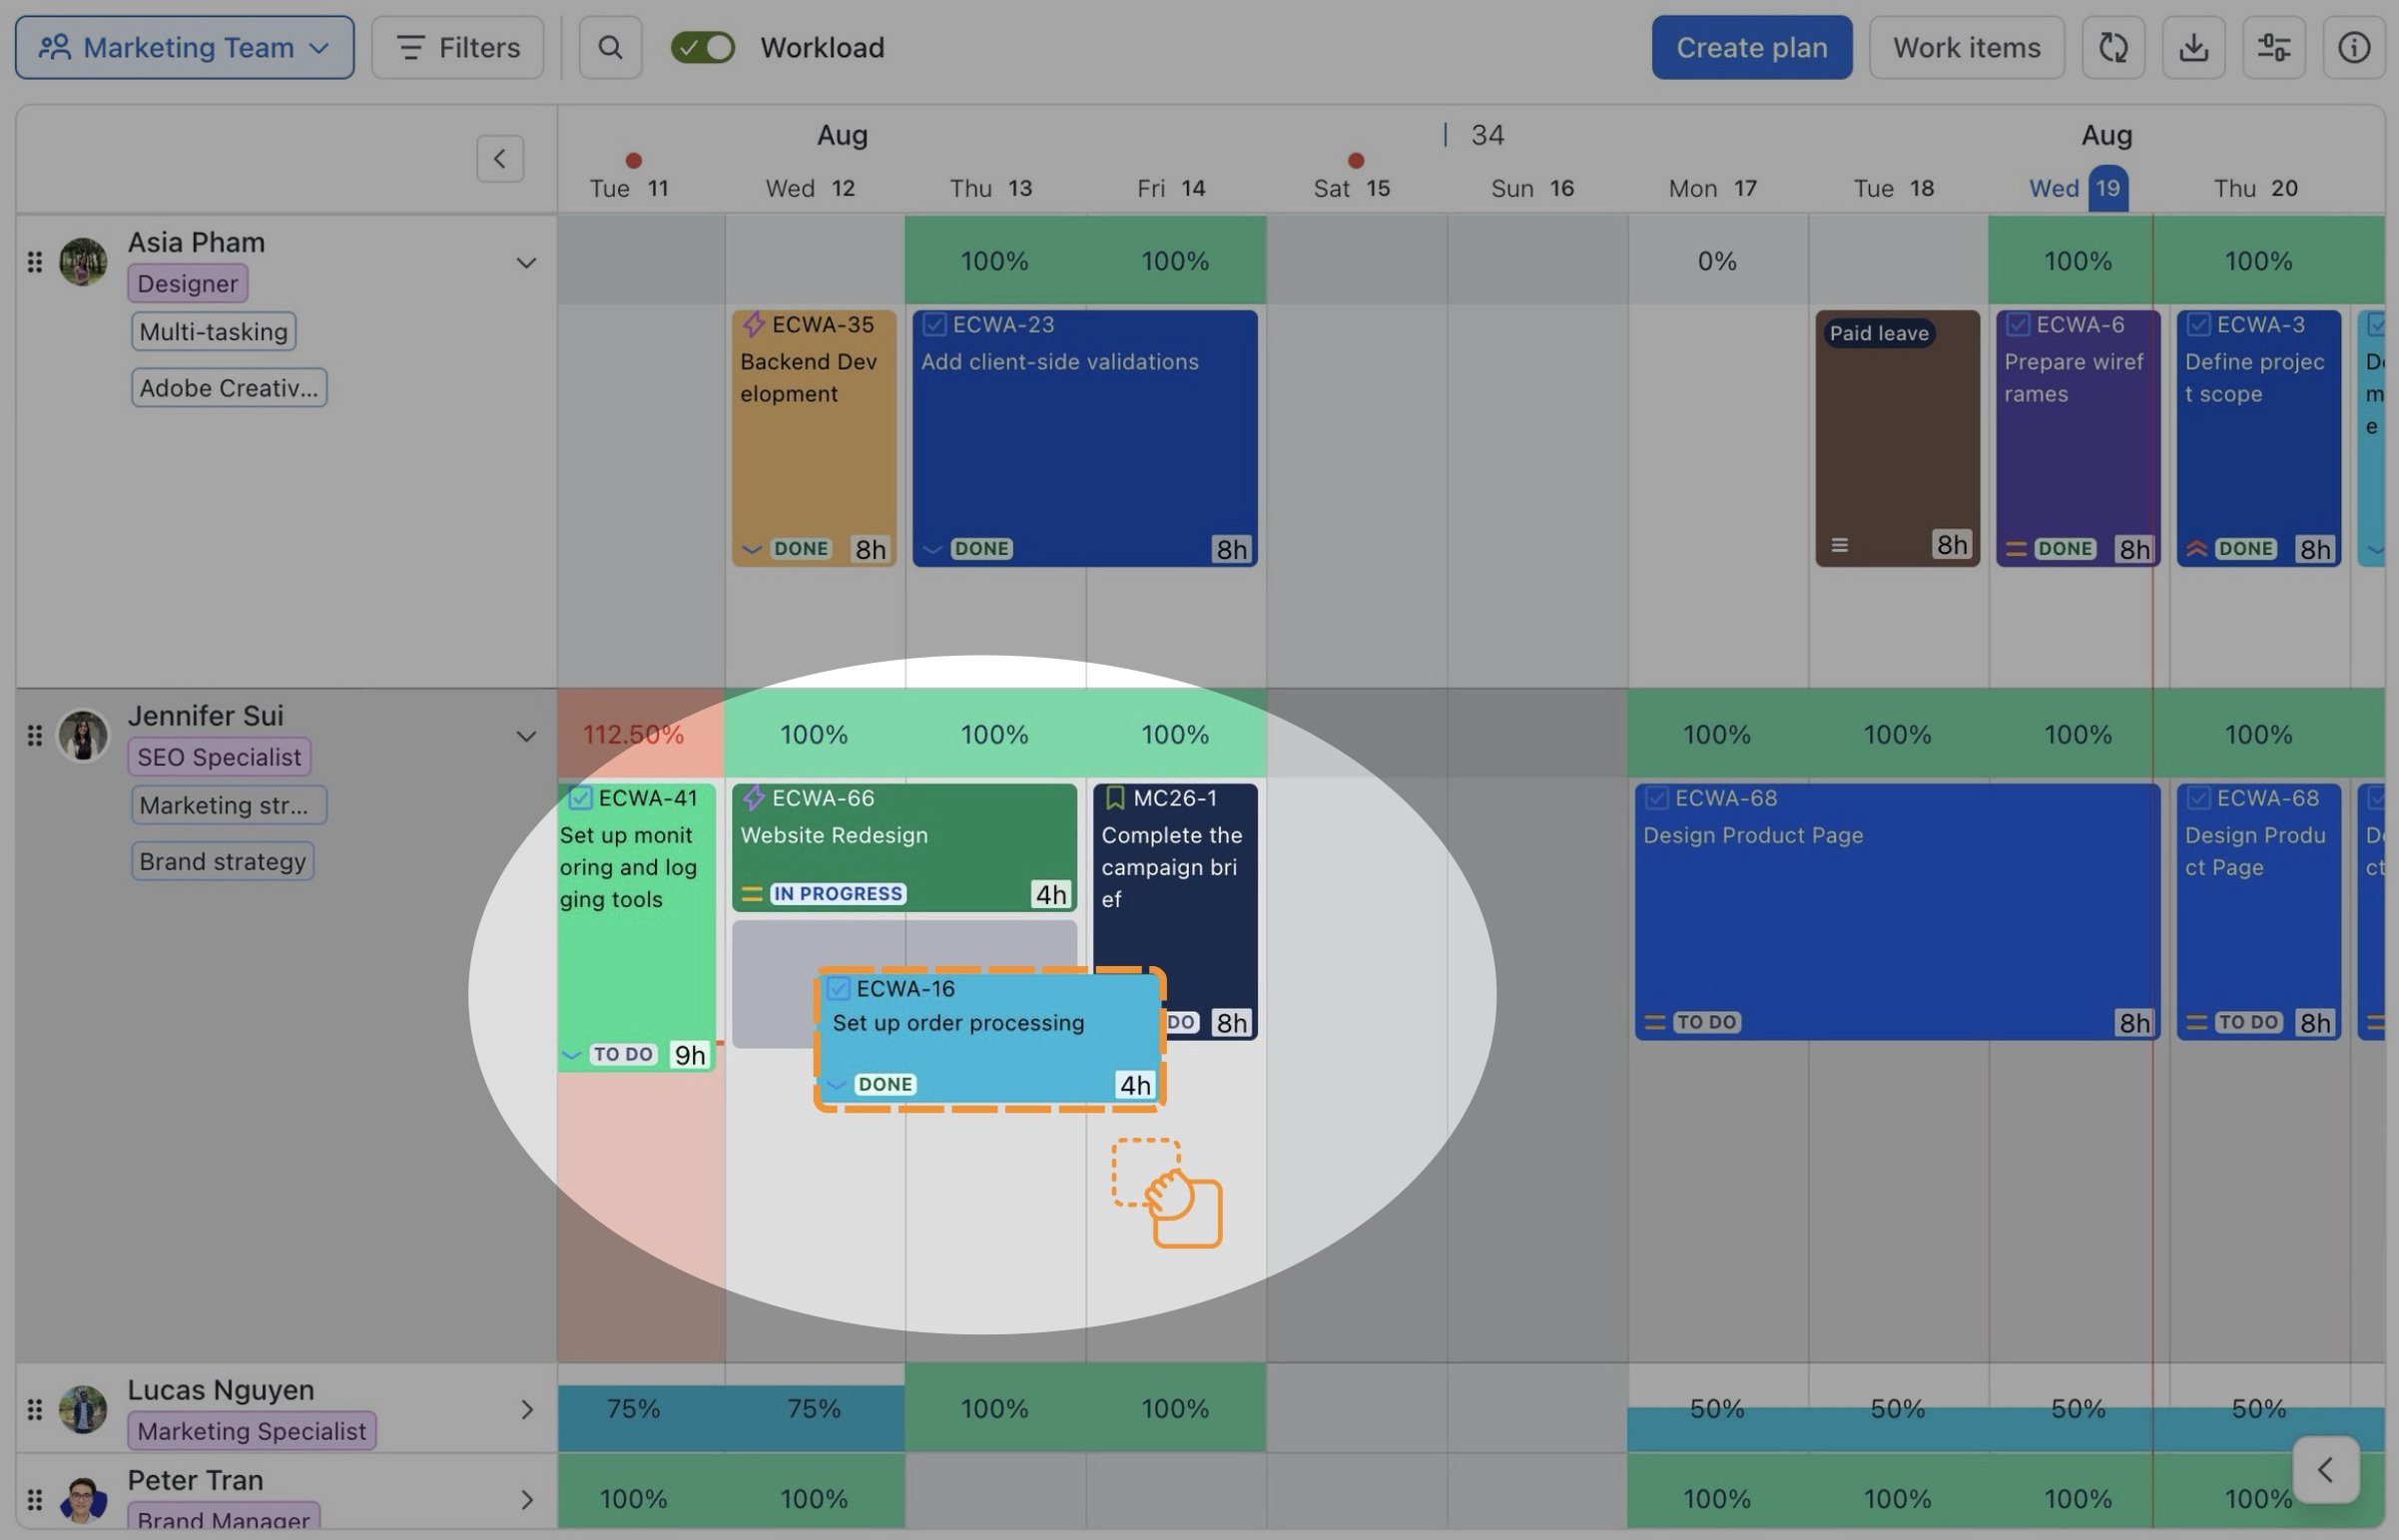
Reassign tasks easily: Drag and drop tasks to redistribute work and balance workloads across the team.
-
Check individual capacity: Click on member avatars to see each person’s available capacity before assigning new tasks.