.png)
The Statistics feature in Advanced Kanban provides a quick overview of task distribution across your board. It helps you understand workload balance, identify bottlenecks, and track progress at a glance – all without leaving the board view.
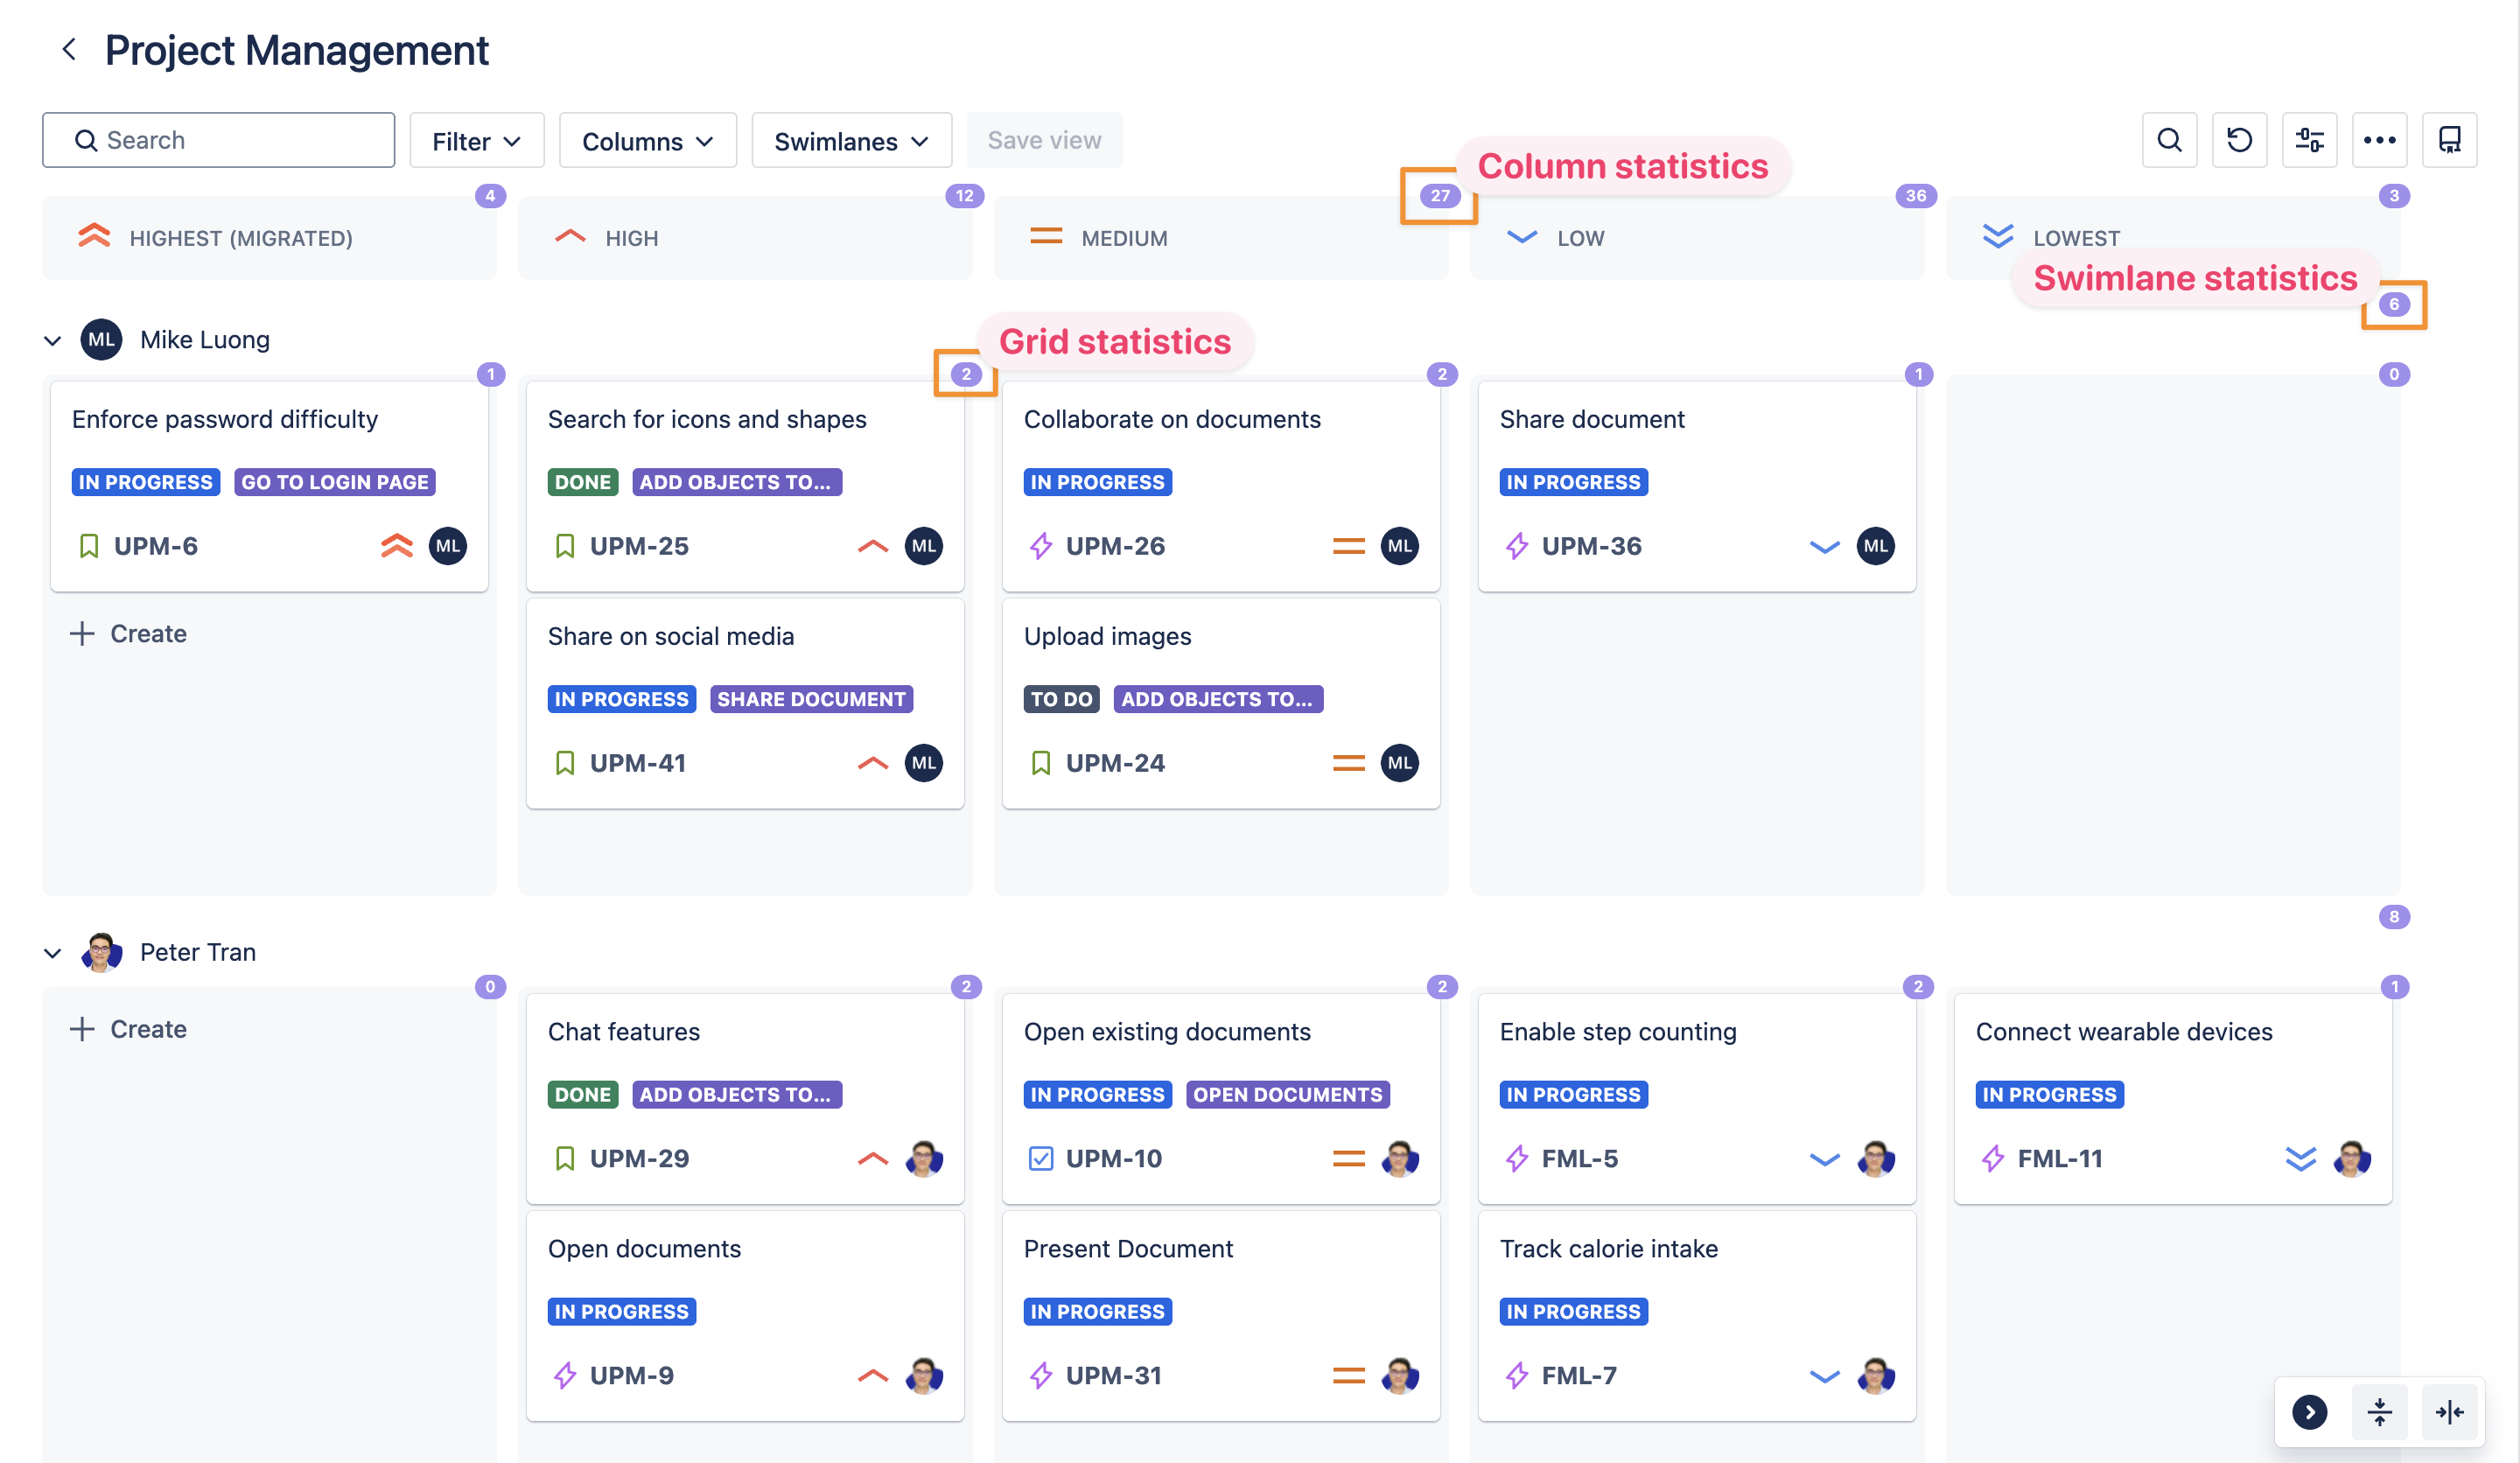
What Are Statistics?
Statistics display the total number of work items (cards) in each column, swimlane, or grid/container.
This feature gives you a clear picture of how tasks are spread across your workflow, helping teams monitor progress and workload distribution efficiently.
For example, if one column or swimlane has a significantly higher number of tasks, it may indicate a potential bottleneck or an area that needs attention.
Locate the Statistics
Statistics are displayed at the top-right corner of each board section:
-
Column: Shows the total number of cards within that column.
-
Swimlane: Shows the total number of cards within that swimlane.
-
Grid/Container: Shows the total number of cards within the selected area.
These dynamic counts update automatically as cards are created, moved, or deleted, ensuring that your data stays accurate and up to date.
Enable or Disable Statistics
You can manage the visibility of Statistics through User settings.
When enabled, task counts will appear on your board in real time. When disabled, they will be hidden to keep your view cleaner.