.png)
1. Overview
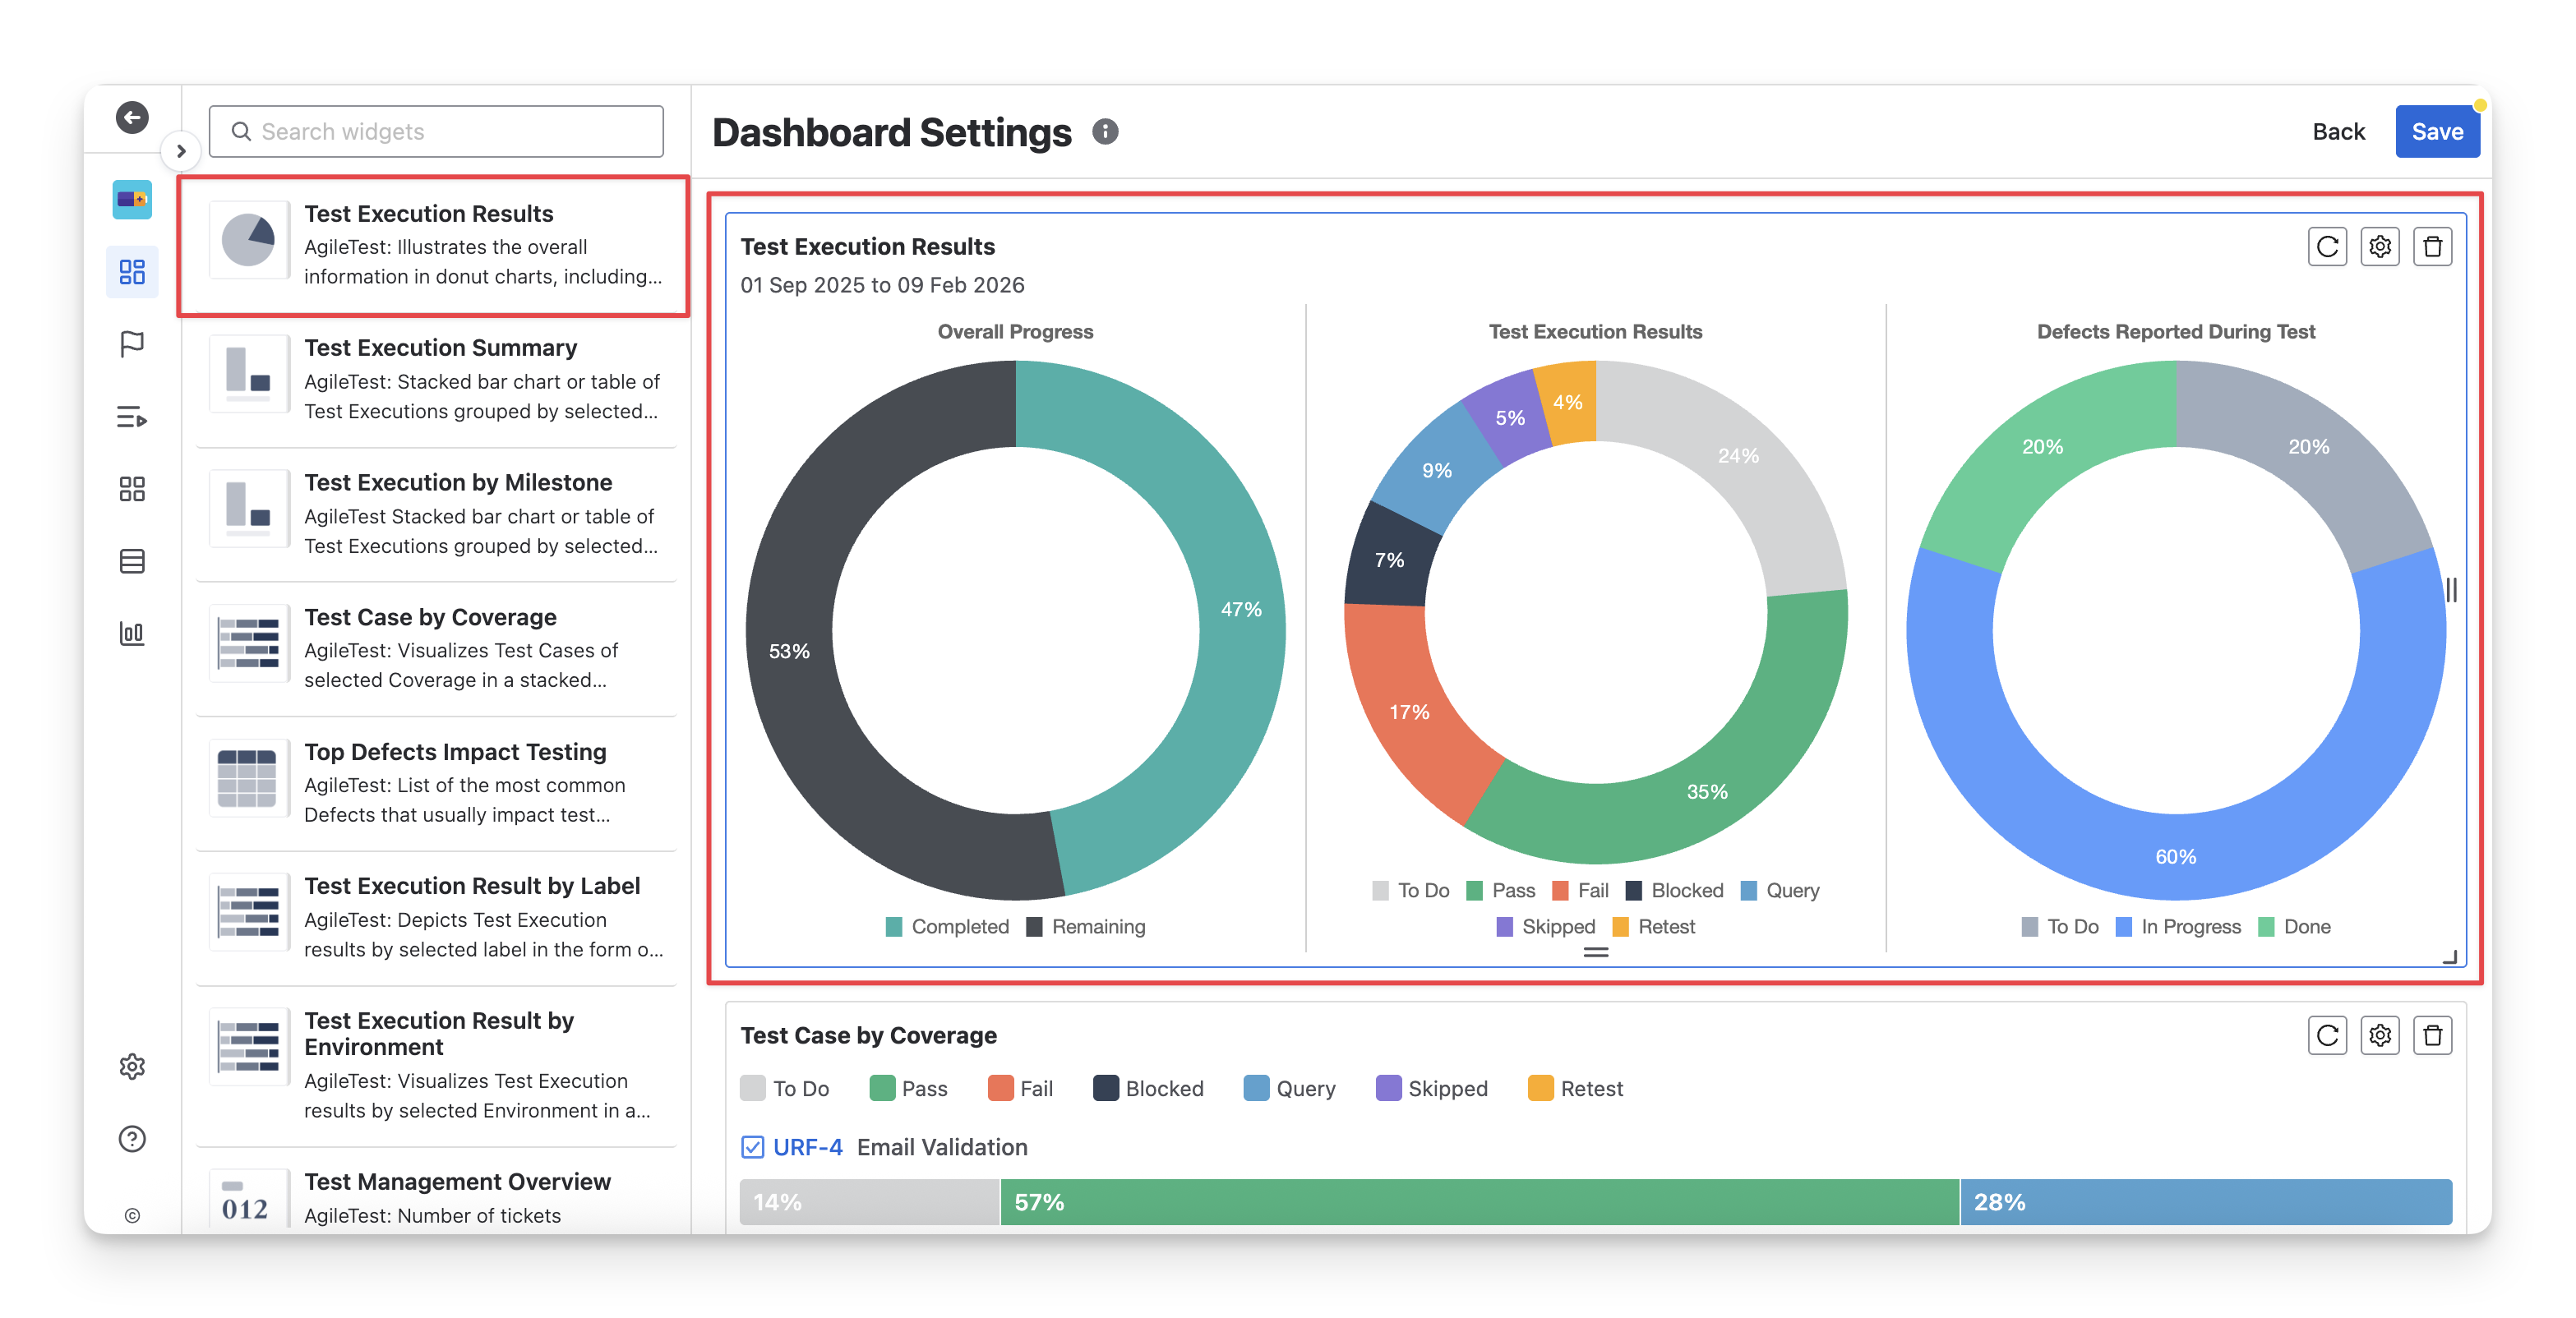
The Test Execution Results is ideal for tracking overall results of test executions, including the test progress, detailed test outcomes, and defects found during testing. Here you can view information about:
-
Overall Progress: This chart shows the percentage of completed vs. remaining test executions. From this data, you can track how many executions are still pending and plan your testing effort accordingly.
-
Test Execution Results: This chart displays the percentage of test execution statuses ( Fail pass skipped blocked query todo retest ). You can quickly assess test outcomes and identify failures or blockers that require immediate attention.
-
Defects Reported During Test: This chart shows the distribution of Jira defect statuses ( todo in progress done ) in your project. You can understand how many defects are unresolved, in progress, or completed, and evaluate the impact of defects on testing progress.
2. Configuration
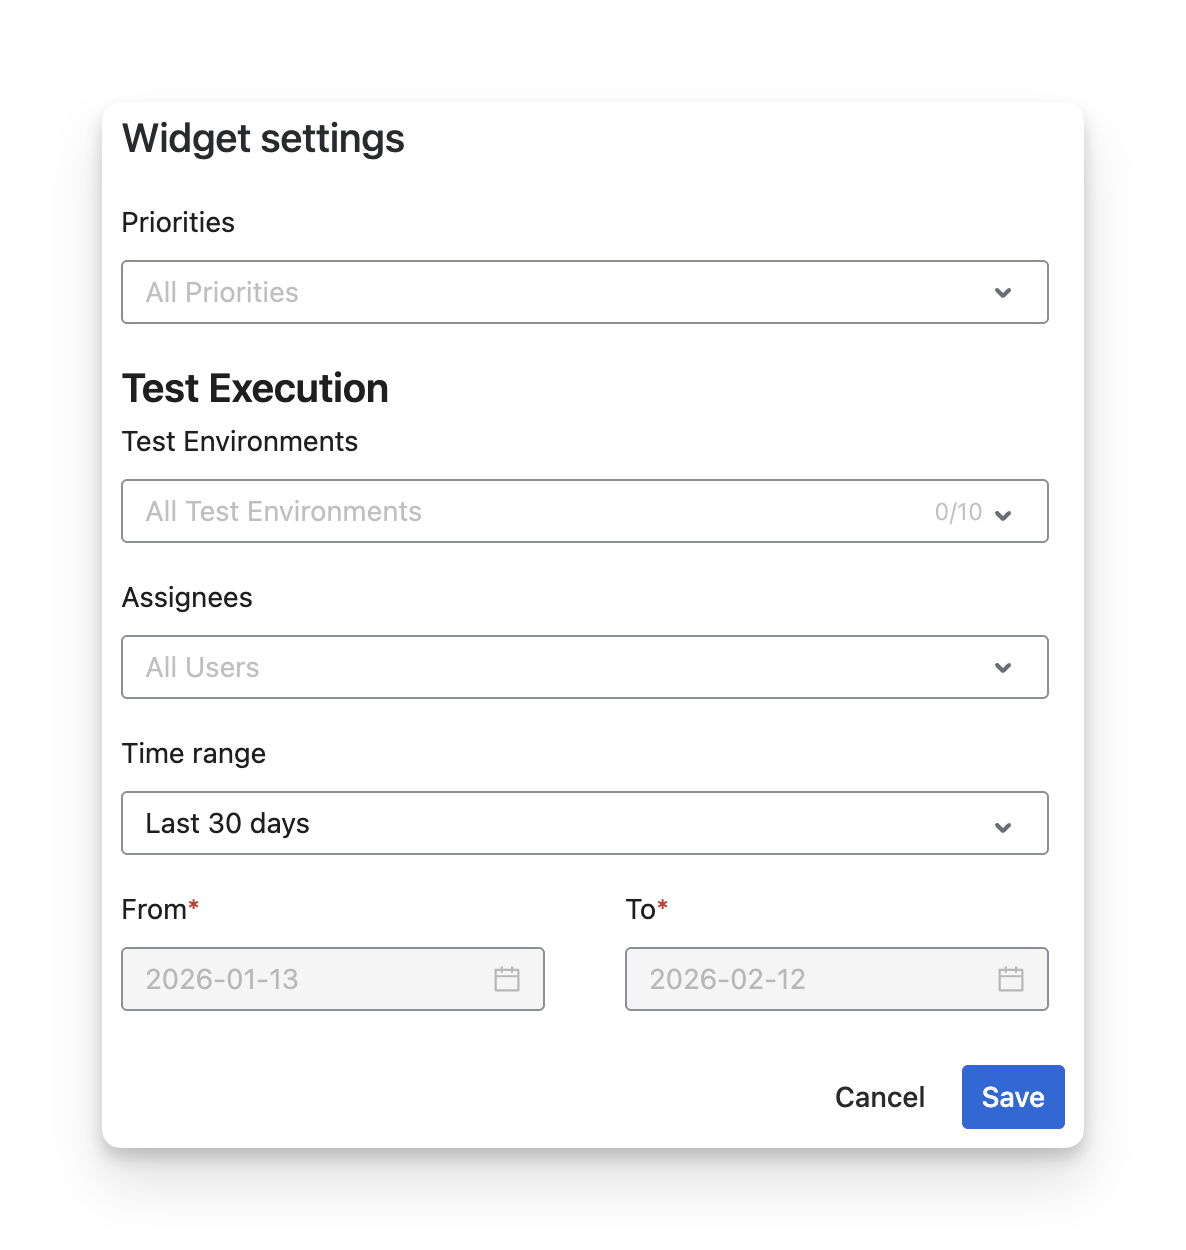
With this widget, you can:
-
Customize the widget name to match your reporting purpose or dashboard context.
-
Filter test cases by priority to focus on high, medium, or low-priority testing.
-
Select specific test environments (up to 10) to analyze results per environment.
-
Filter by assignees to review execution results for specific QA members.
-
Adjust the time range using preset ranges (e.g., Last 30 days) or custom From–To dates.
Should you need any assistance or further AgileTest inquiries, contact our 24/7 Support Desk!