.png)
1. Overview
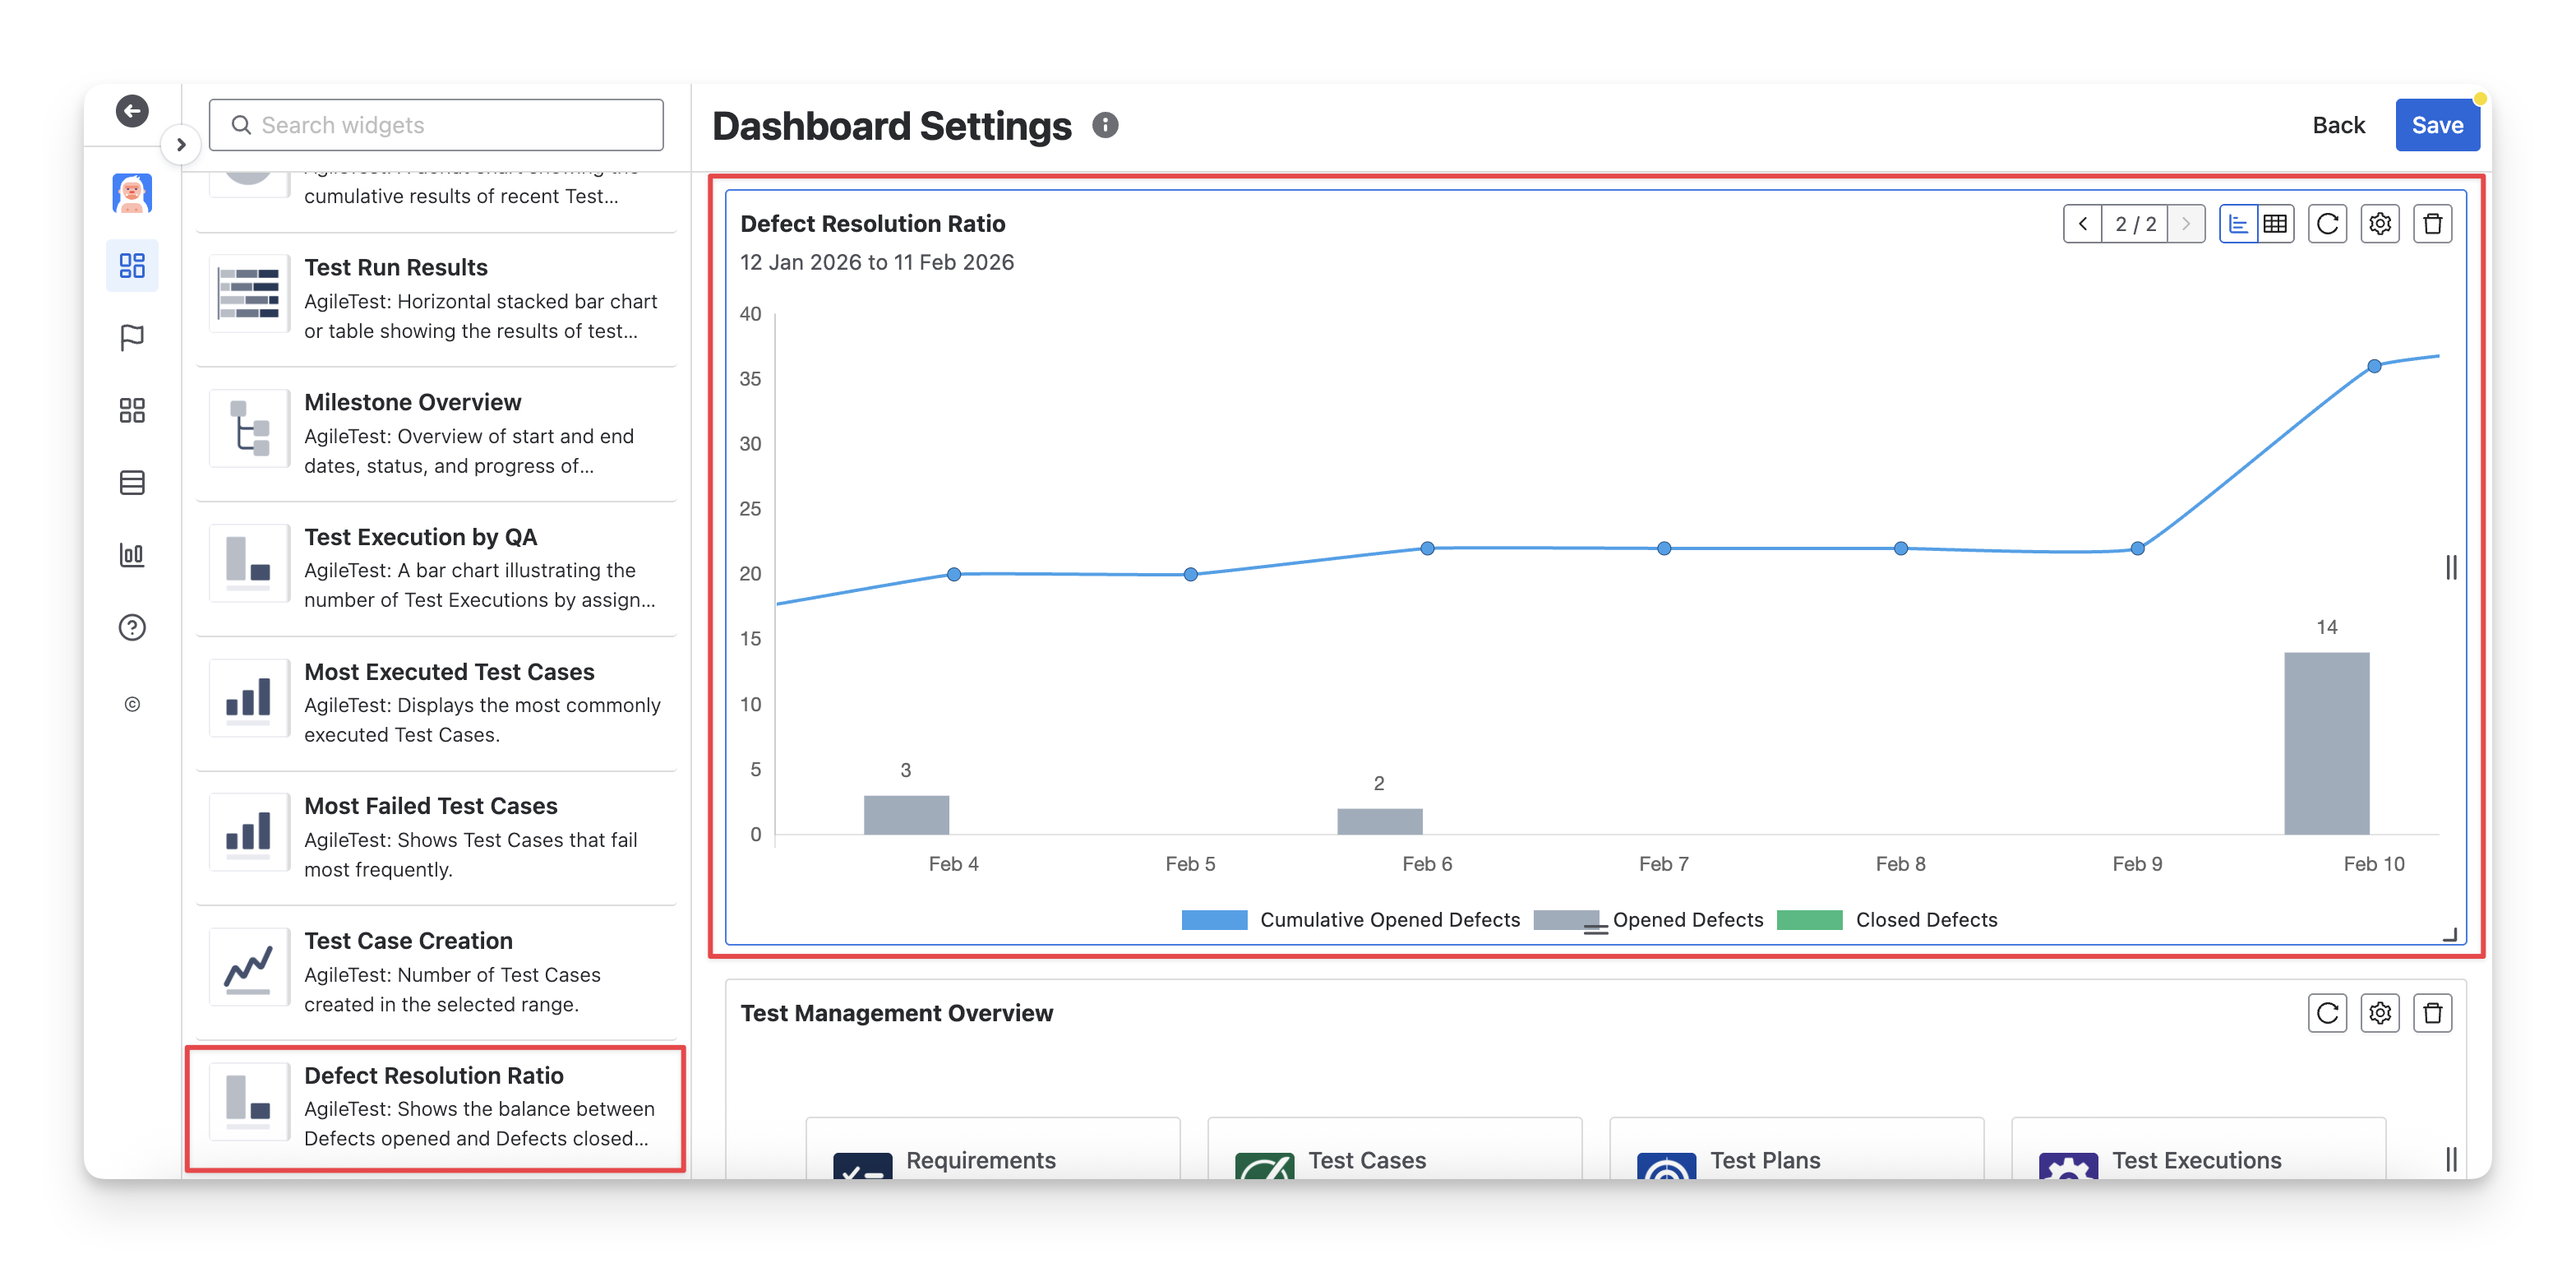
The Defect Resolution Ratio widget provides an overview of defect resolution progress by tracking all defects in your instance, including both defects linked and unlinked defects that match the configured defect mapping. It helps teams understand how many defects are being opened versus resolved over time, offering clear insight into overall product stability and testing health.
This widget has 2 display formats: chart and table. You can switch between these two formats by clicking on the “Switch format” button.
1.1 Chart Format
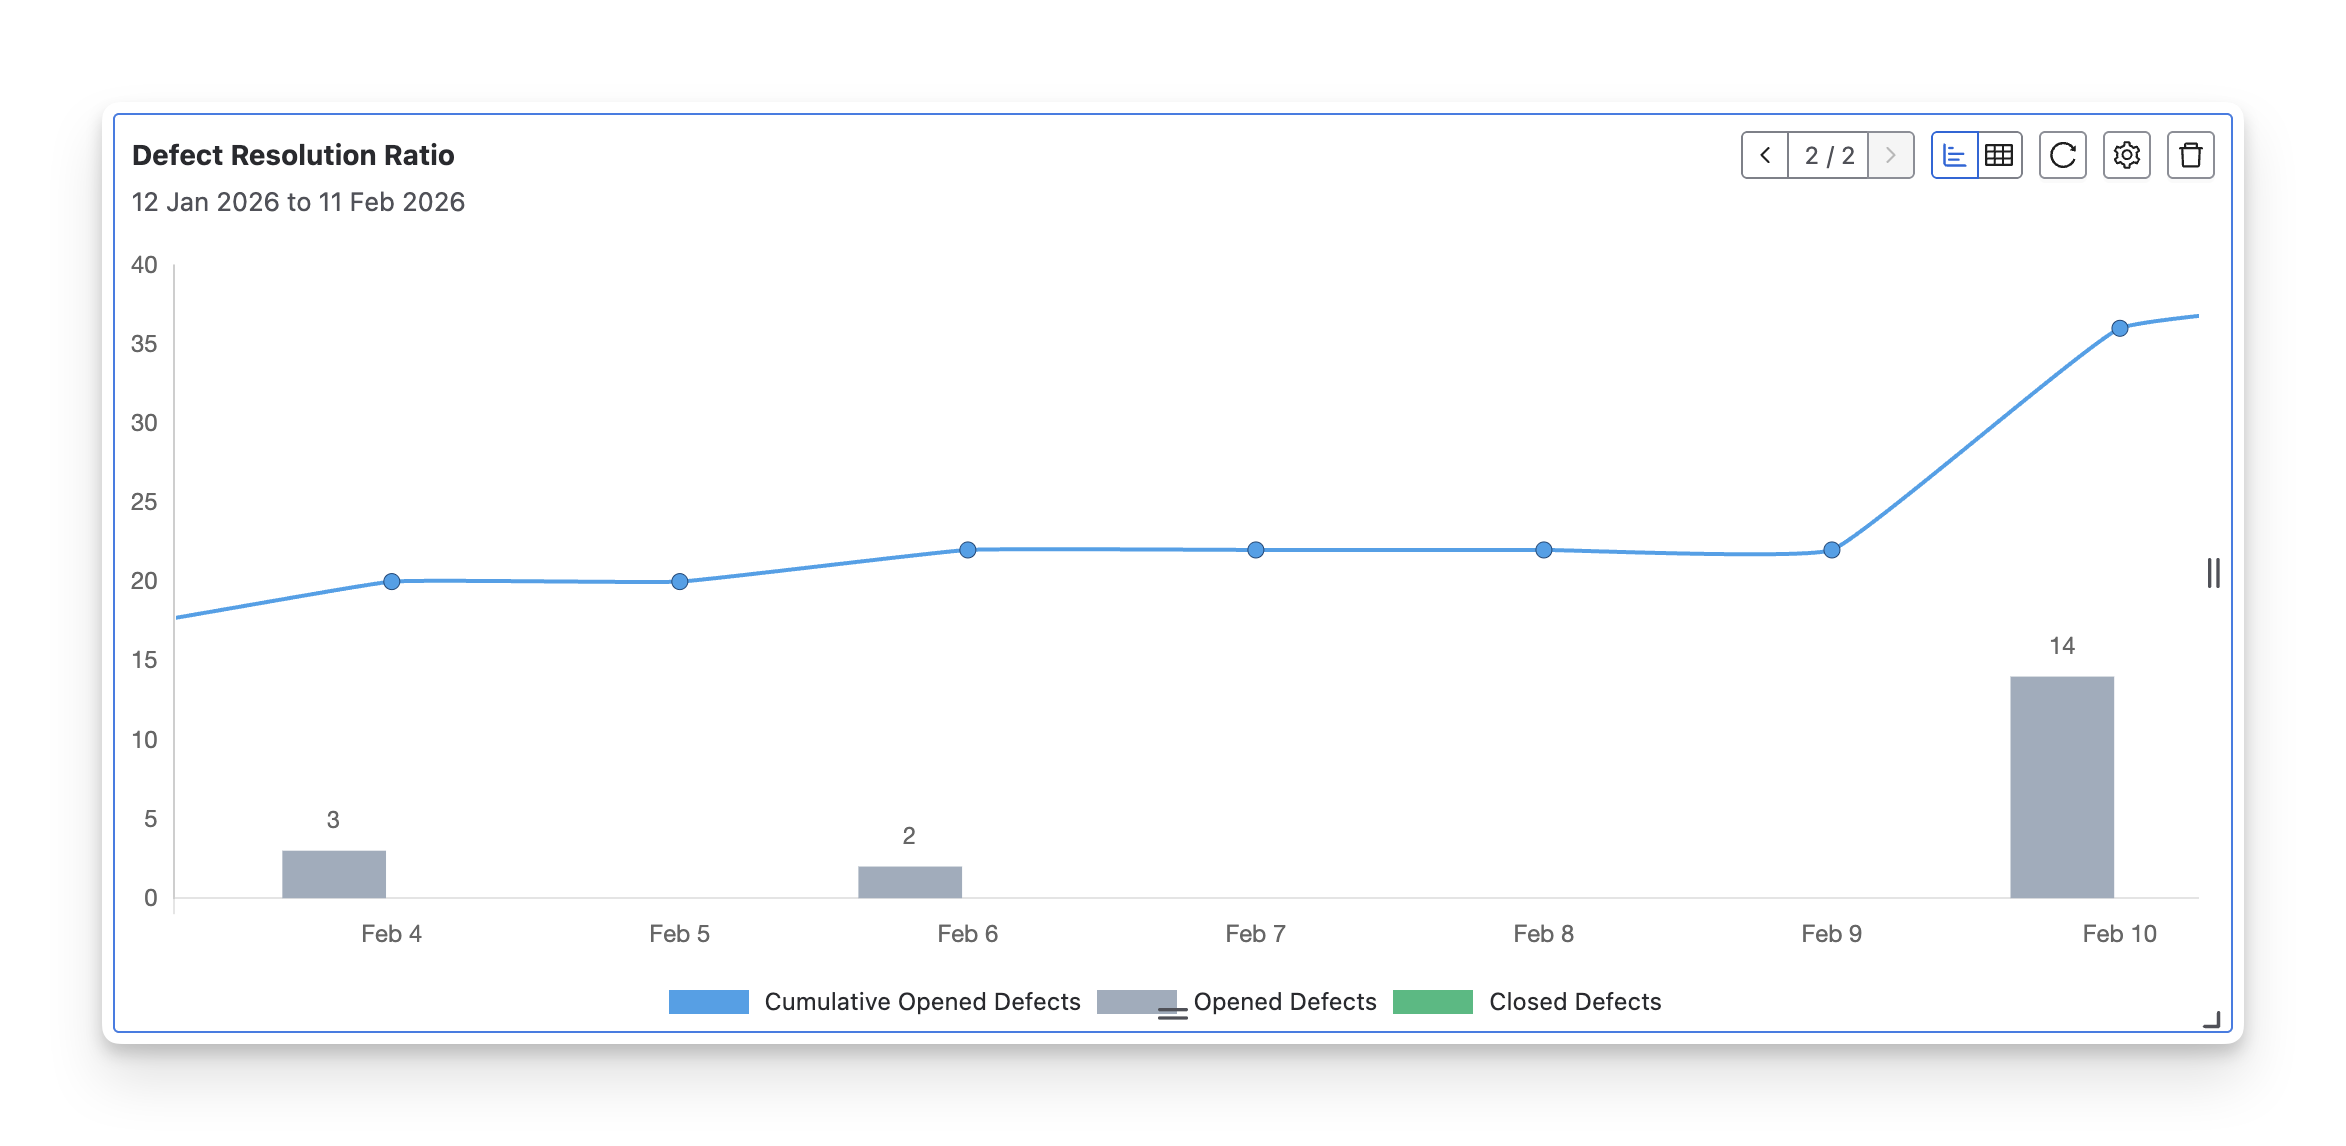
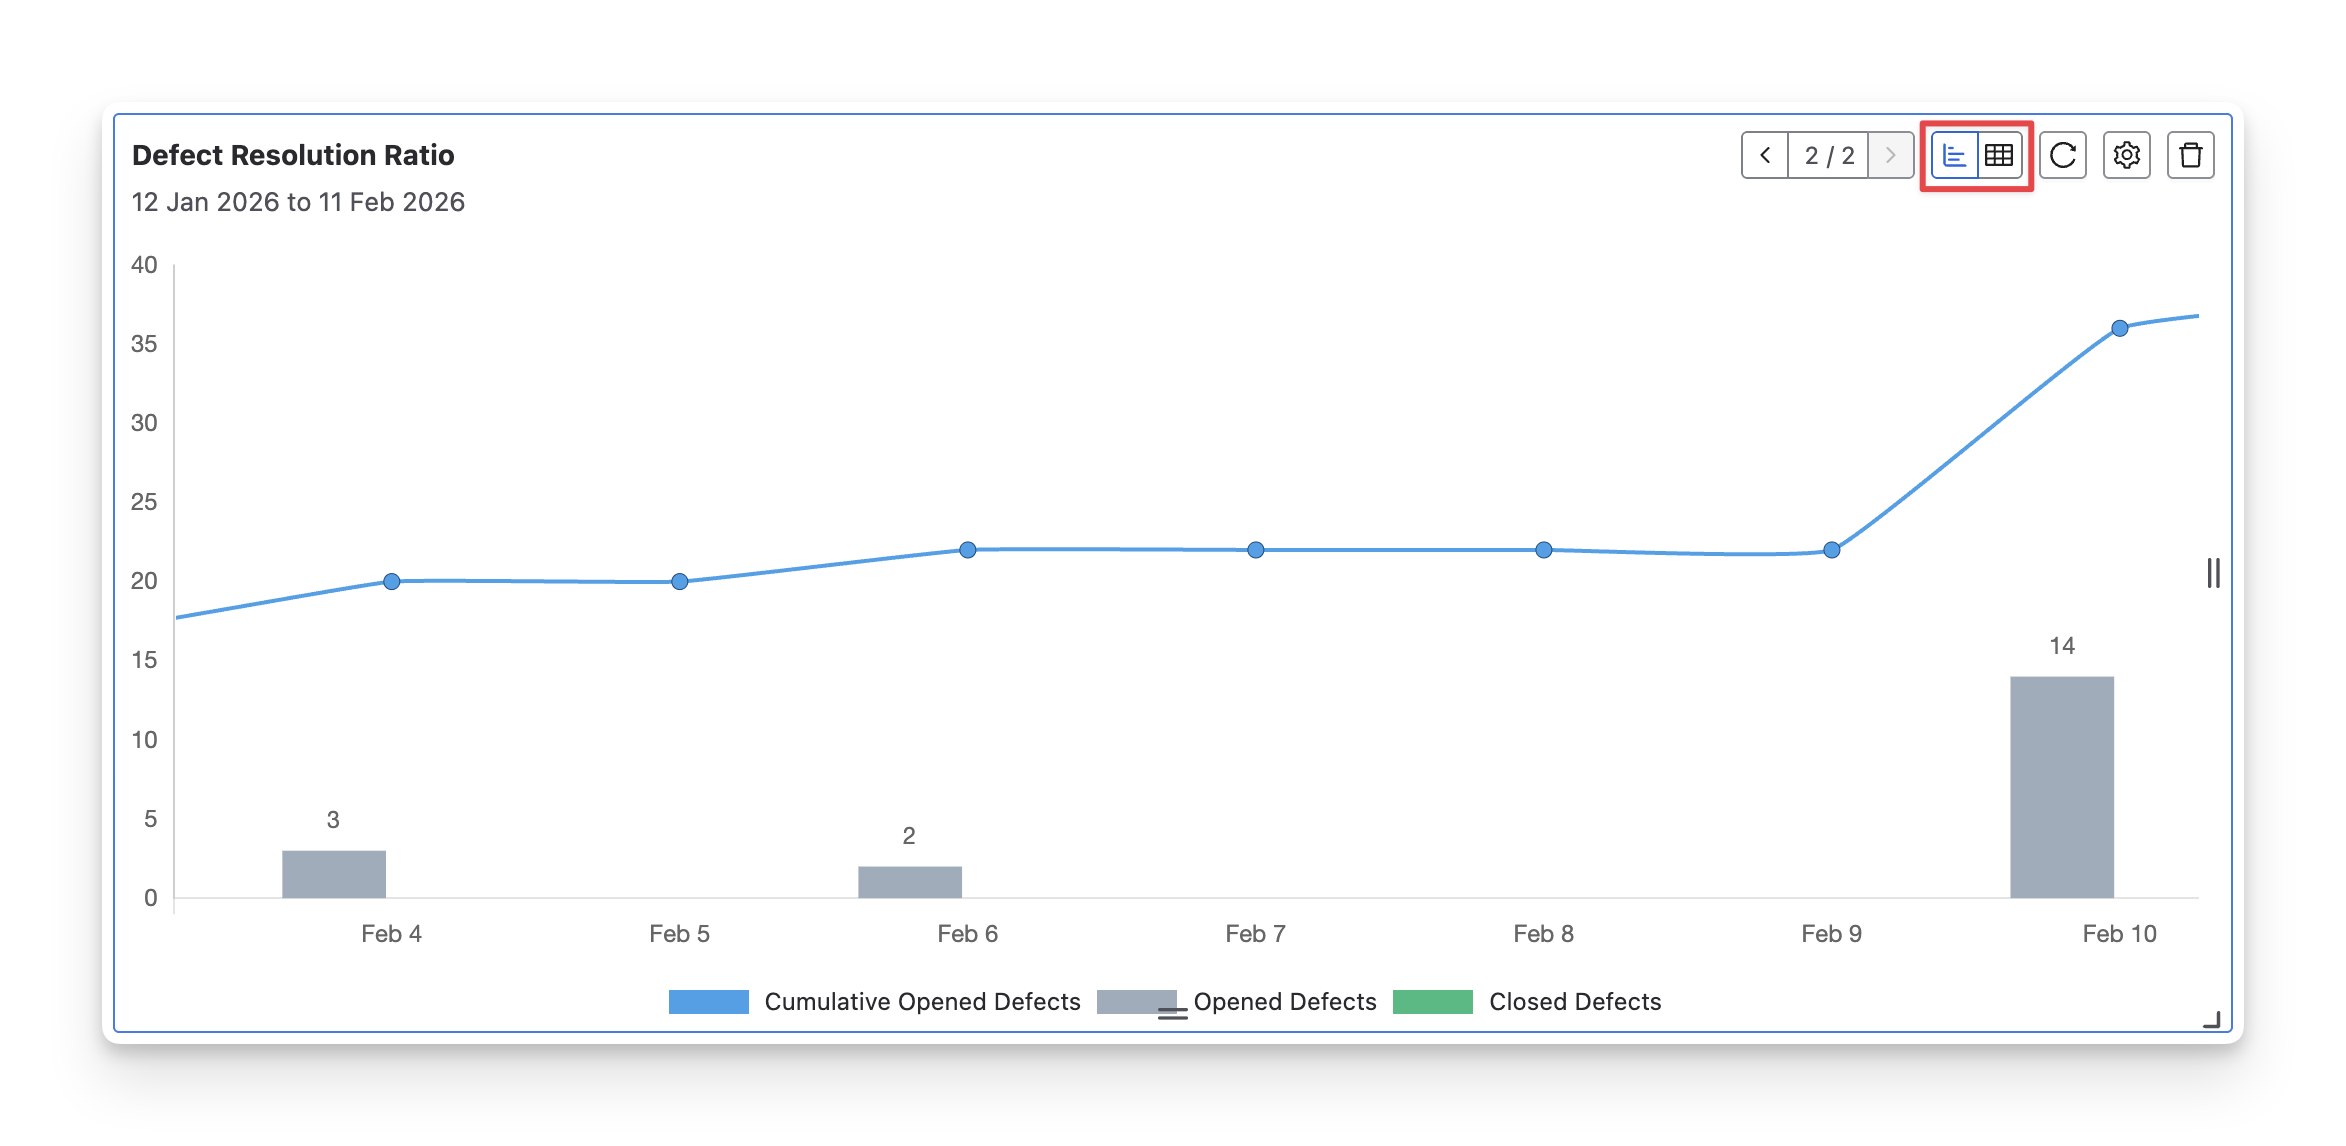
The Defect Resolution Ratio chart visualizes how defects are opened and resolved over time. It typically shows newly opened defects, closed defects, and the cumulative number of open defects within the selected period.
This format is particularly useful when QA teams need to:
-
Monitor defect trends over time: See whether defects are being closed as fast as they are reported.
-
Identify risk periods: Spot spikes in opened defects or slow resolution rates that may impact release readiness.
-
Support release and sprint reviews: Provide stakeholders with a high-level visual of testing health and defect stability.
1.2 Table Format
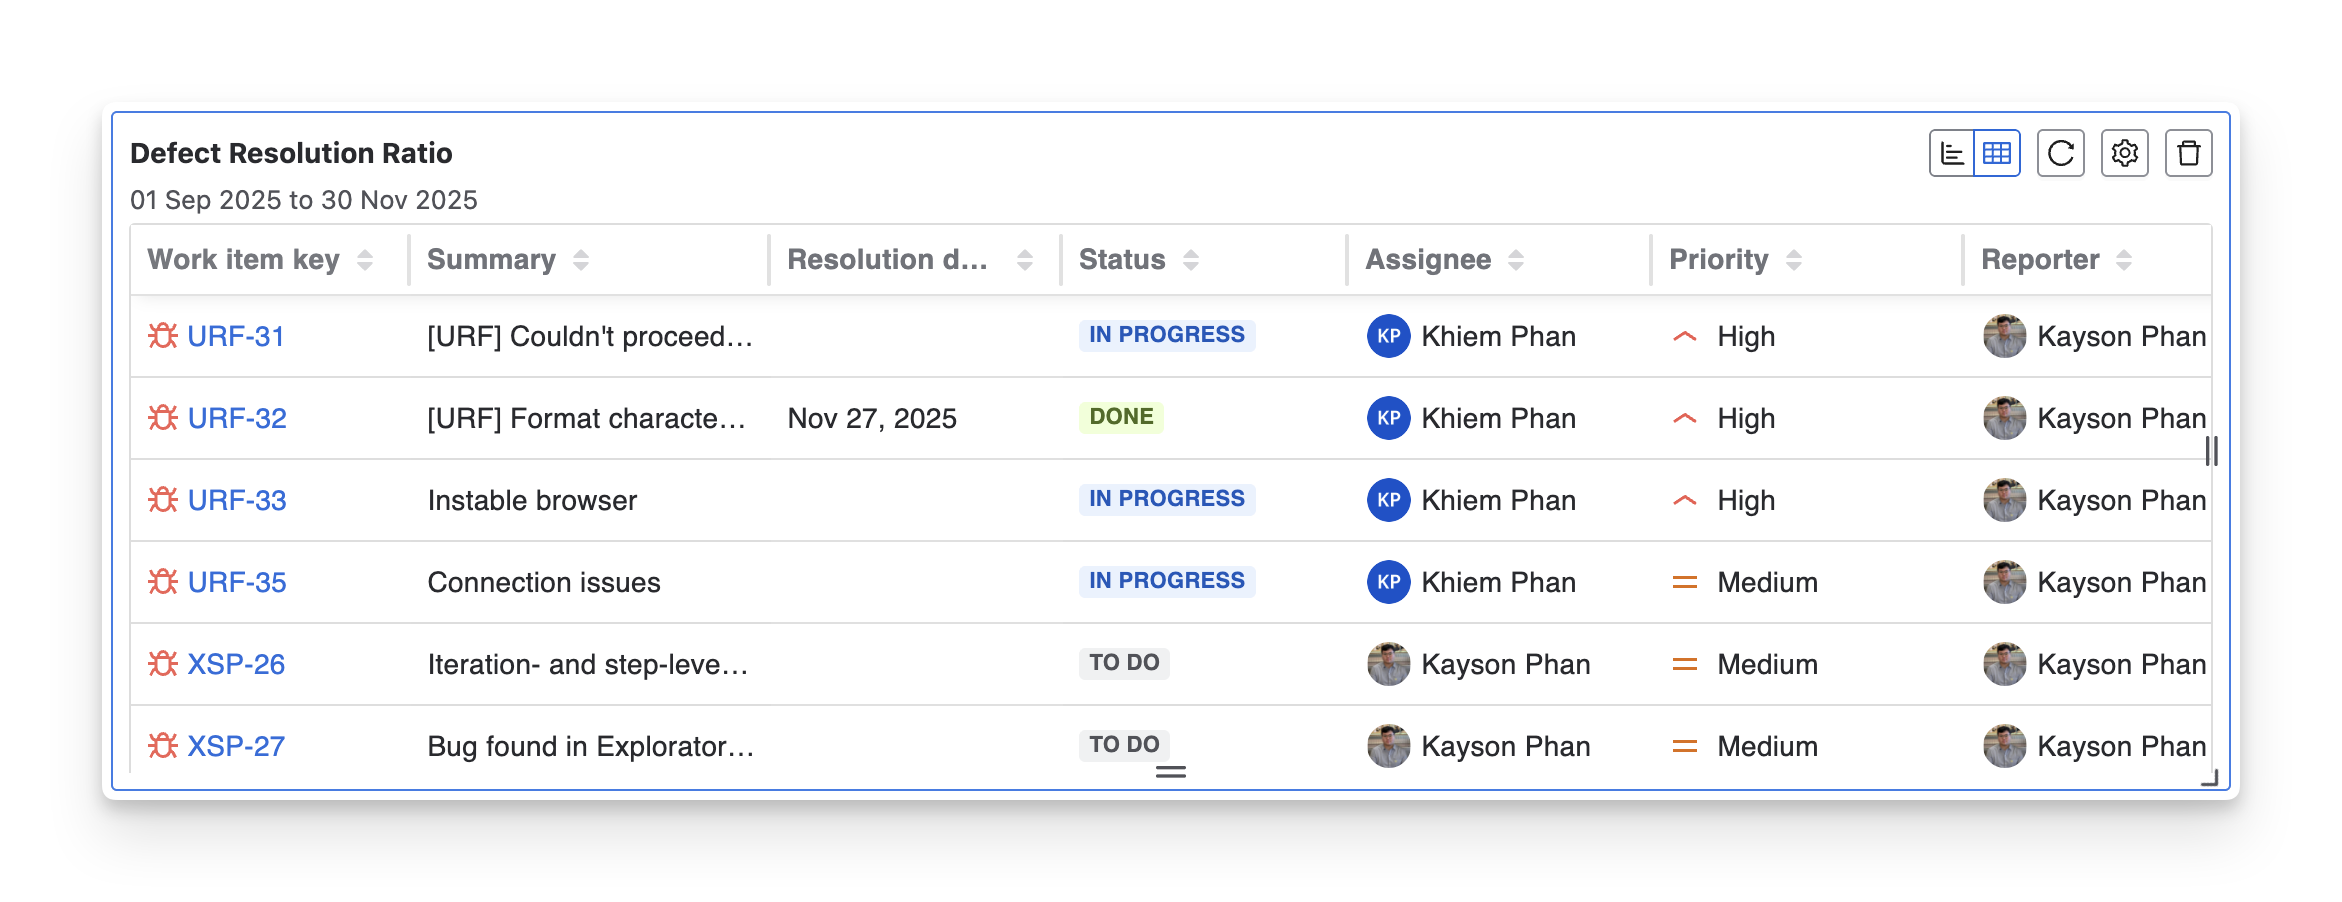
The Defect Resolution Ratio table provides a detailed, item-level view of defects included in the ratio. Each row represents a defect and shows key information such as work item key, summary, resolution date, current status, assignee, priority, reporter, last updated, and created time.
This format is particularly useful when QA teams need to:
-
Track individual defect progress: See detailed information on defects that are still open, in progress, or resolved.
-
Prioritize defect resolution: Identify high-priority or long-running defects that require immediate attention.
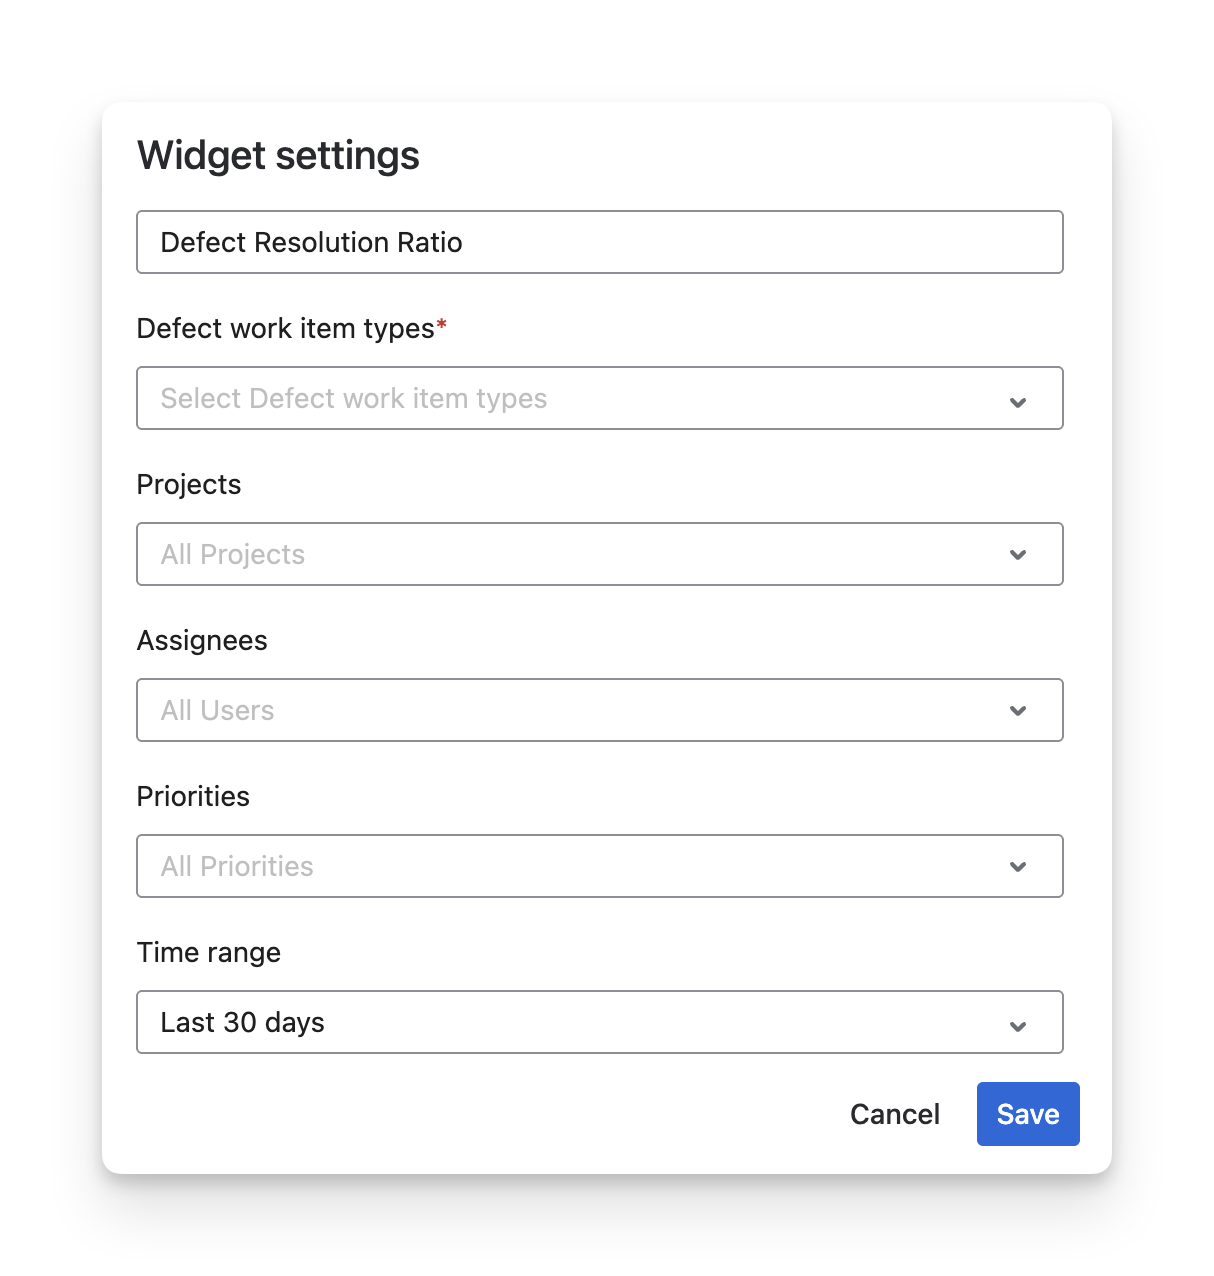
2. Configurations
-
Rename the widget to match your reporting purpose (e.g., Defect Fix Rate, Bug Closure Trend).
-
Select defect work item types to define which types of defects are included in the calculation.
-
Filter by projects to focus on specific products or teams.
-
Filter by assignees to analyze resolution performance by individual contributors.
-
Filter by priorities to evaluate how quickly high-severity defects are being resolved.
-
Select a time range using presets or define a custom From–To date range to control the reporting period.
-
Choose the default display mode (Chart or Table) depending on whether you prefer a visual trend or detailed data.
Should you need any assistance or further AgileTest inquiries, contact our 24/7 Support Desk!