.png)
The Defect Summary Report in AgileTest gathers all defects identified during testing, helping teams understand the current quality status of the product. By presenting all defect data across test executions and requirements into a single view, you can quickly identify critical issues, monitor defect resolution progress, and assess the overall impact of defects on the testing and release readiness.
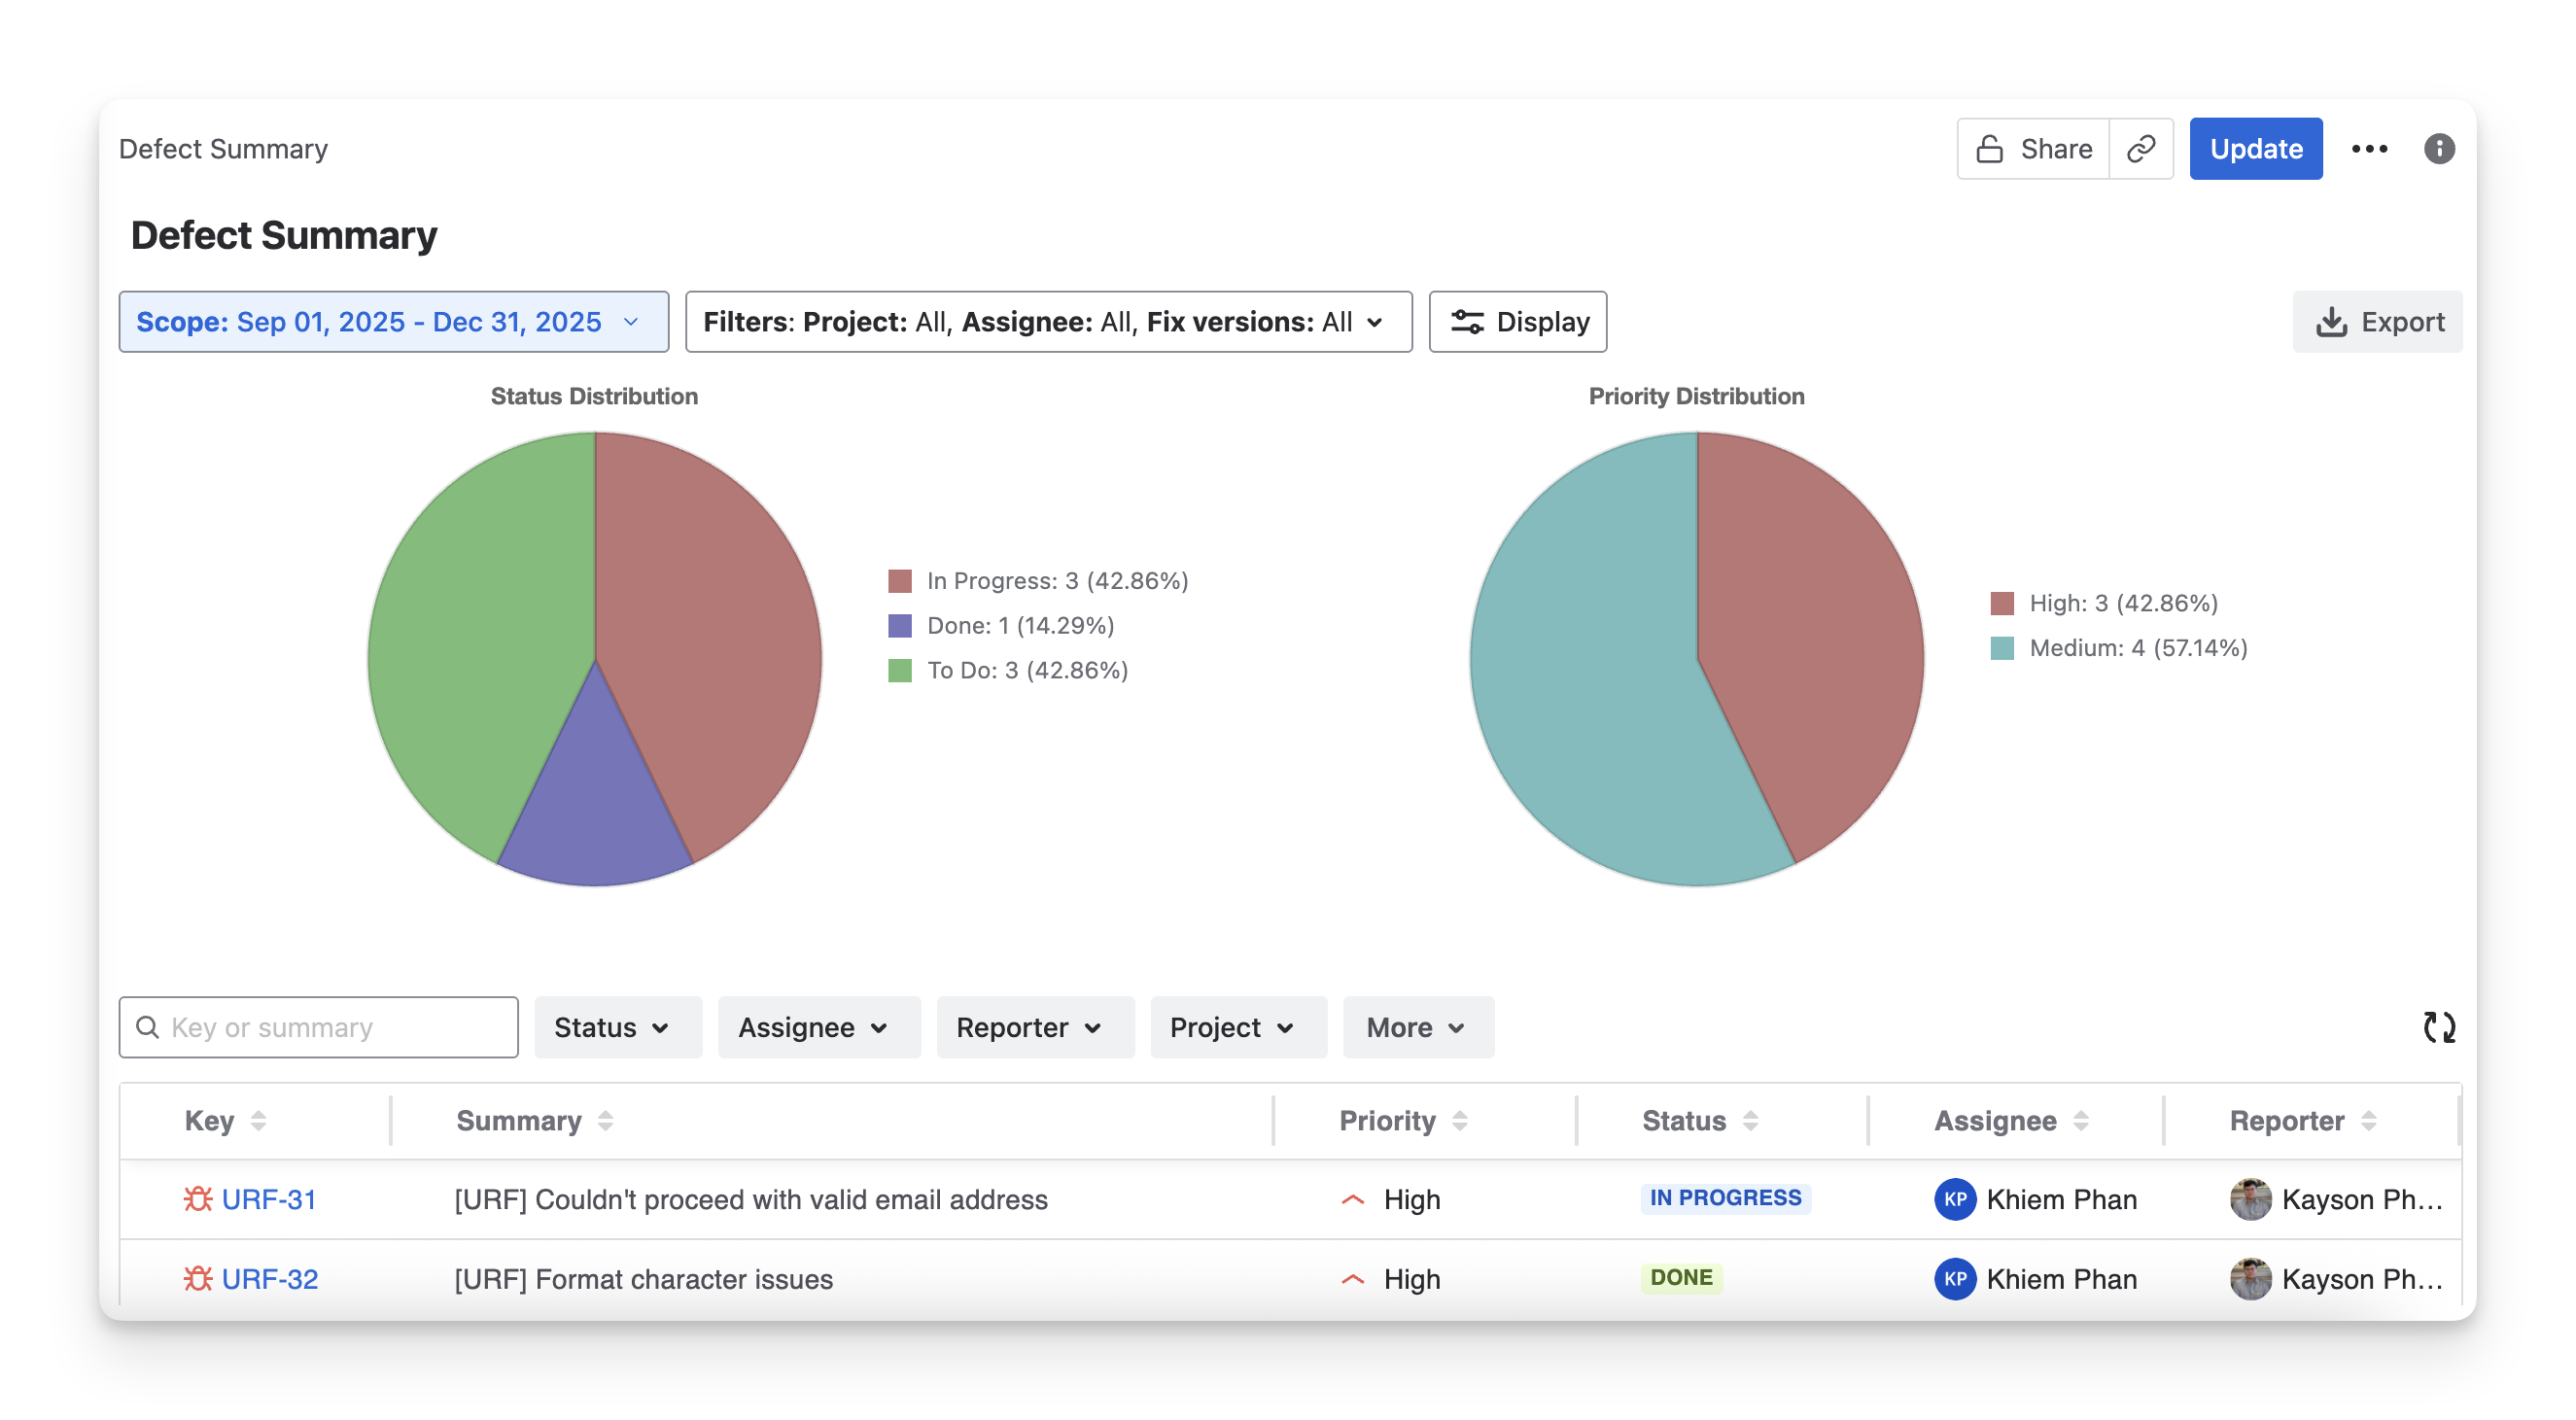
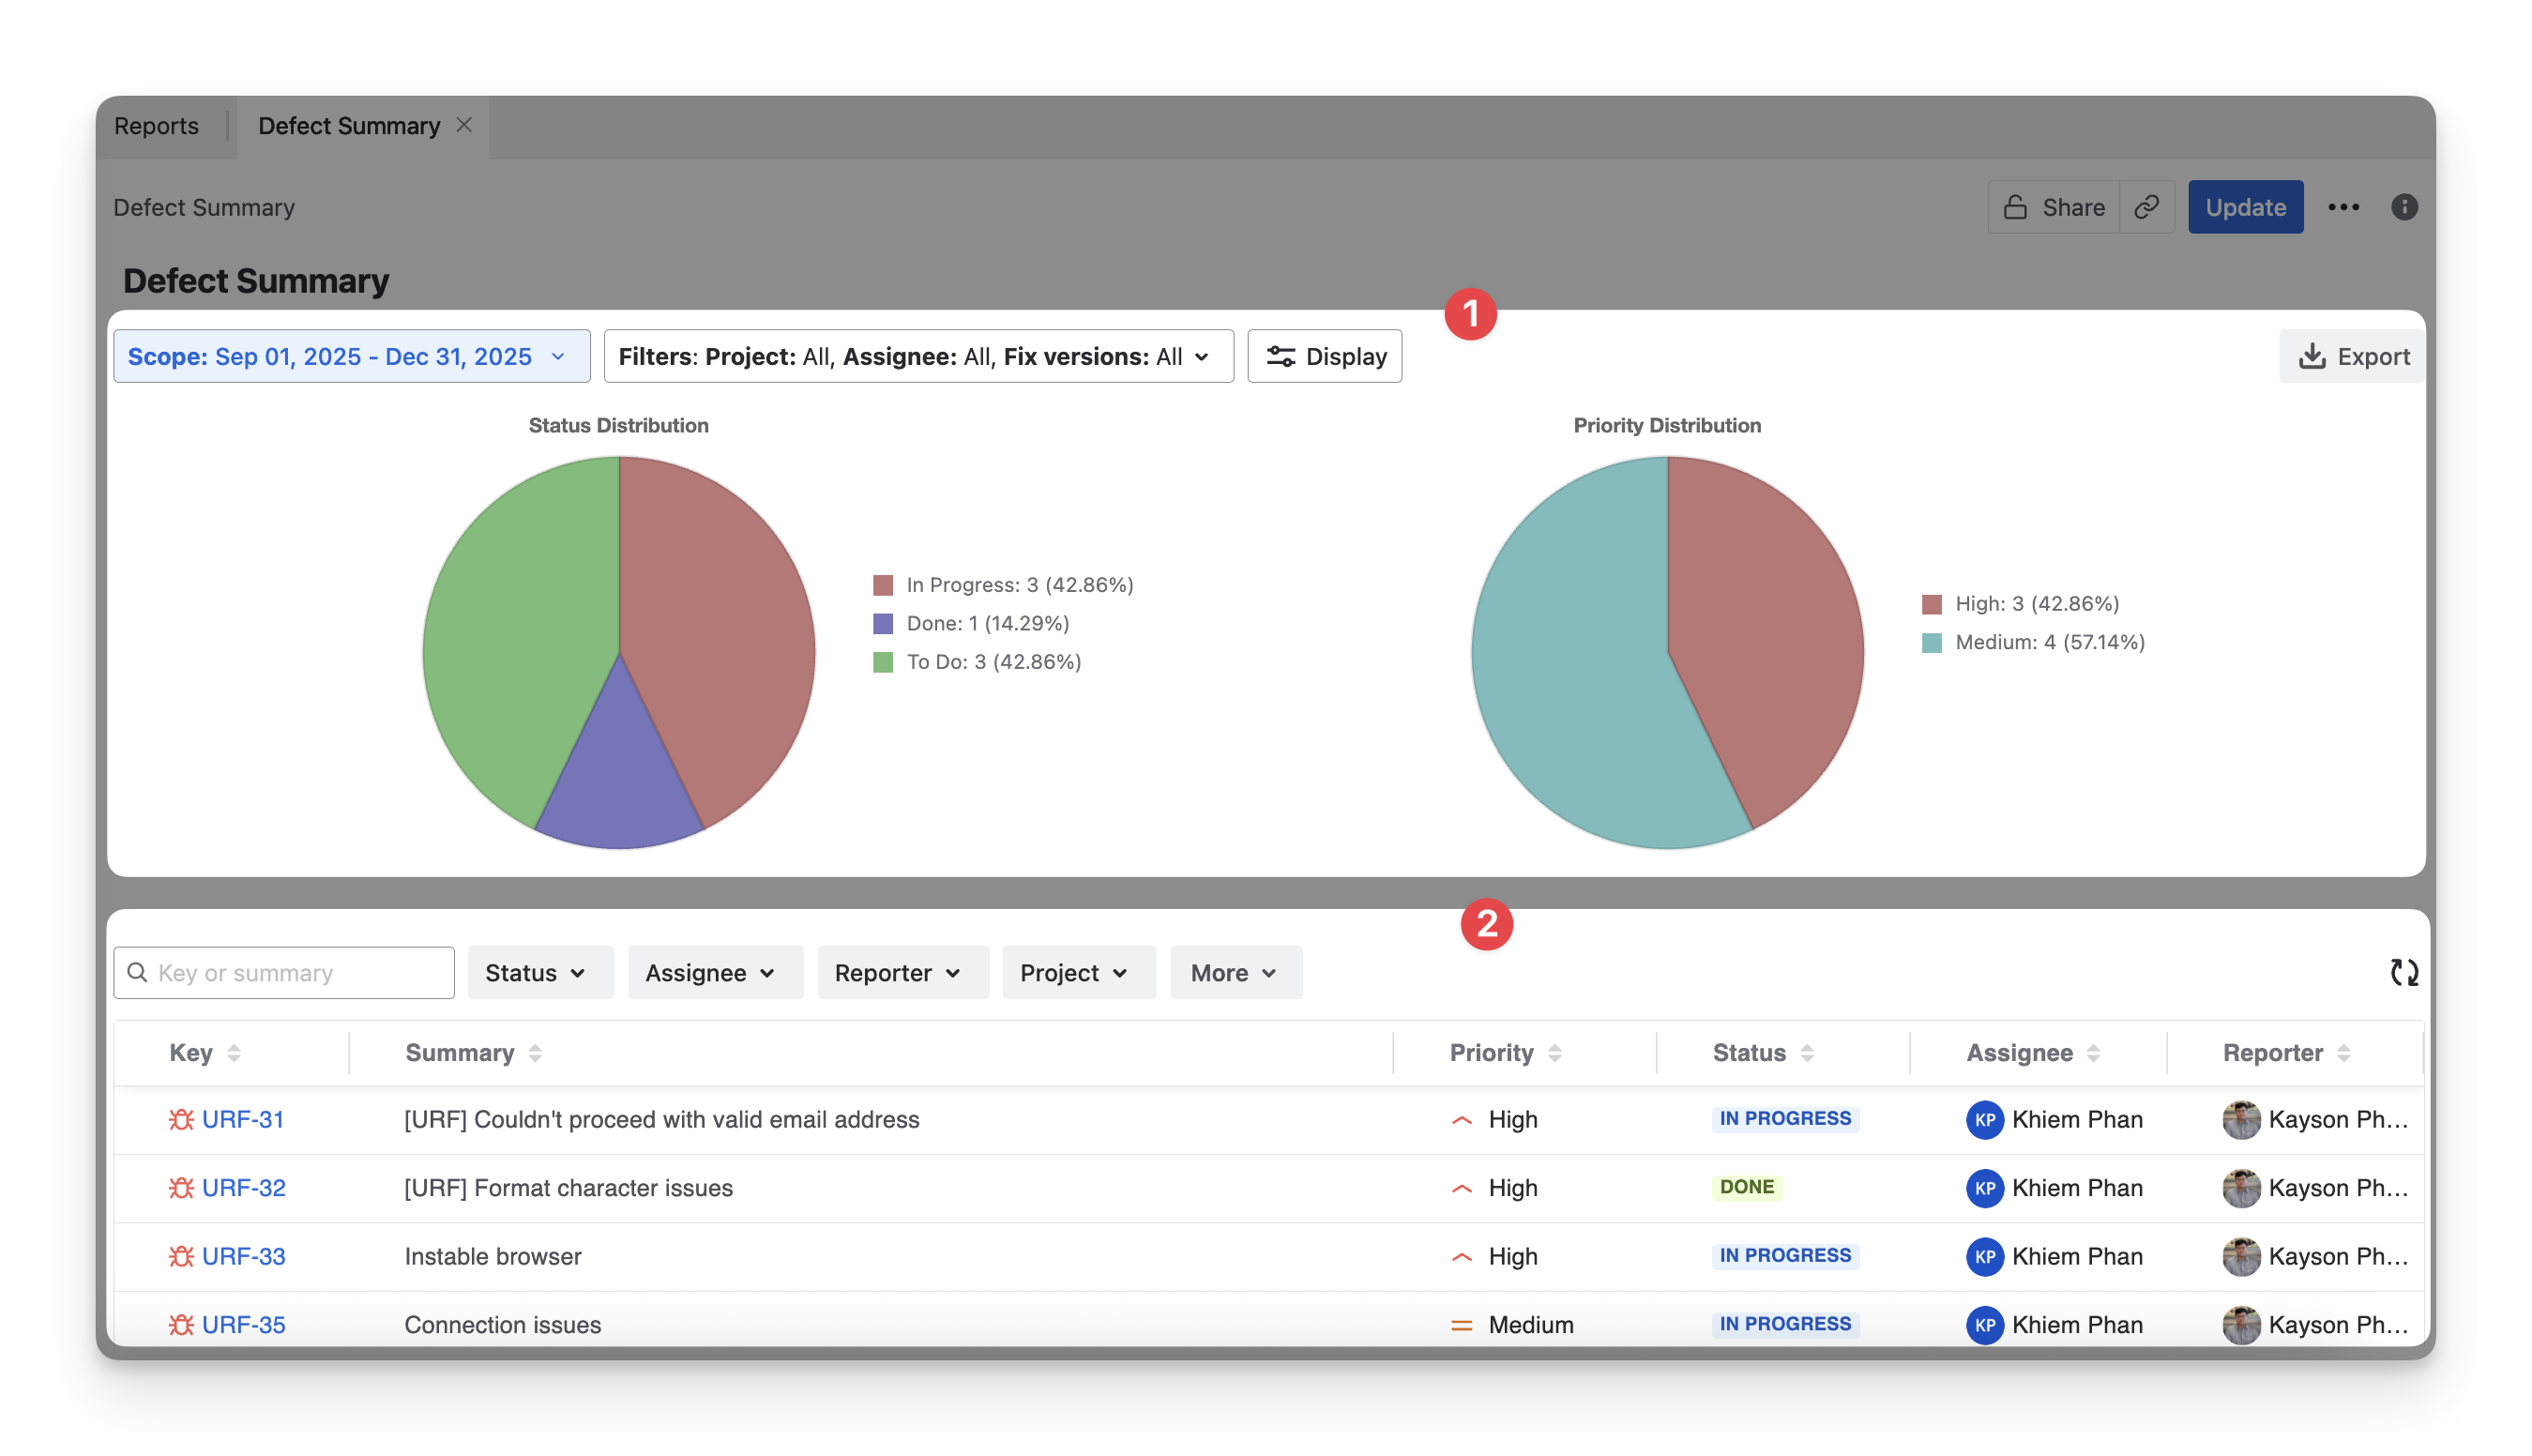
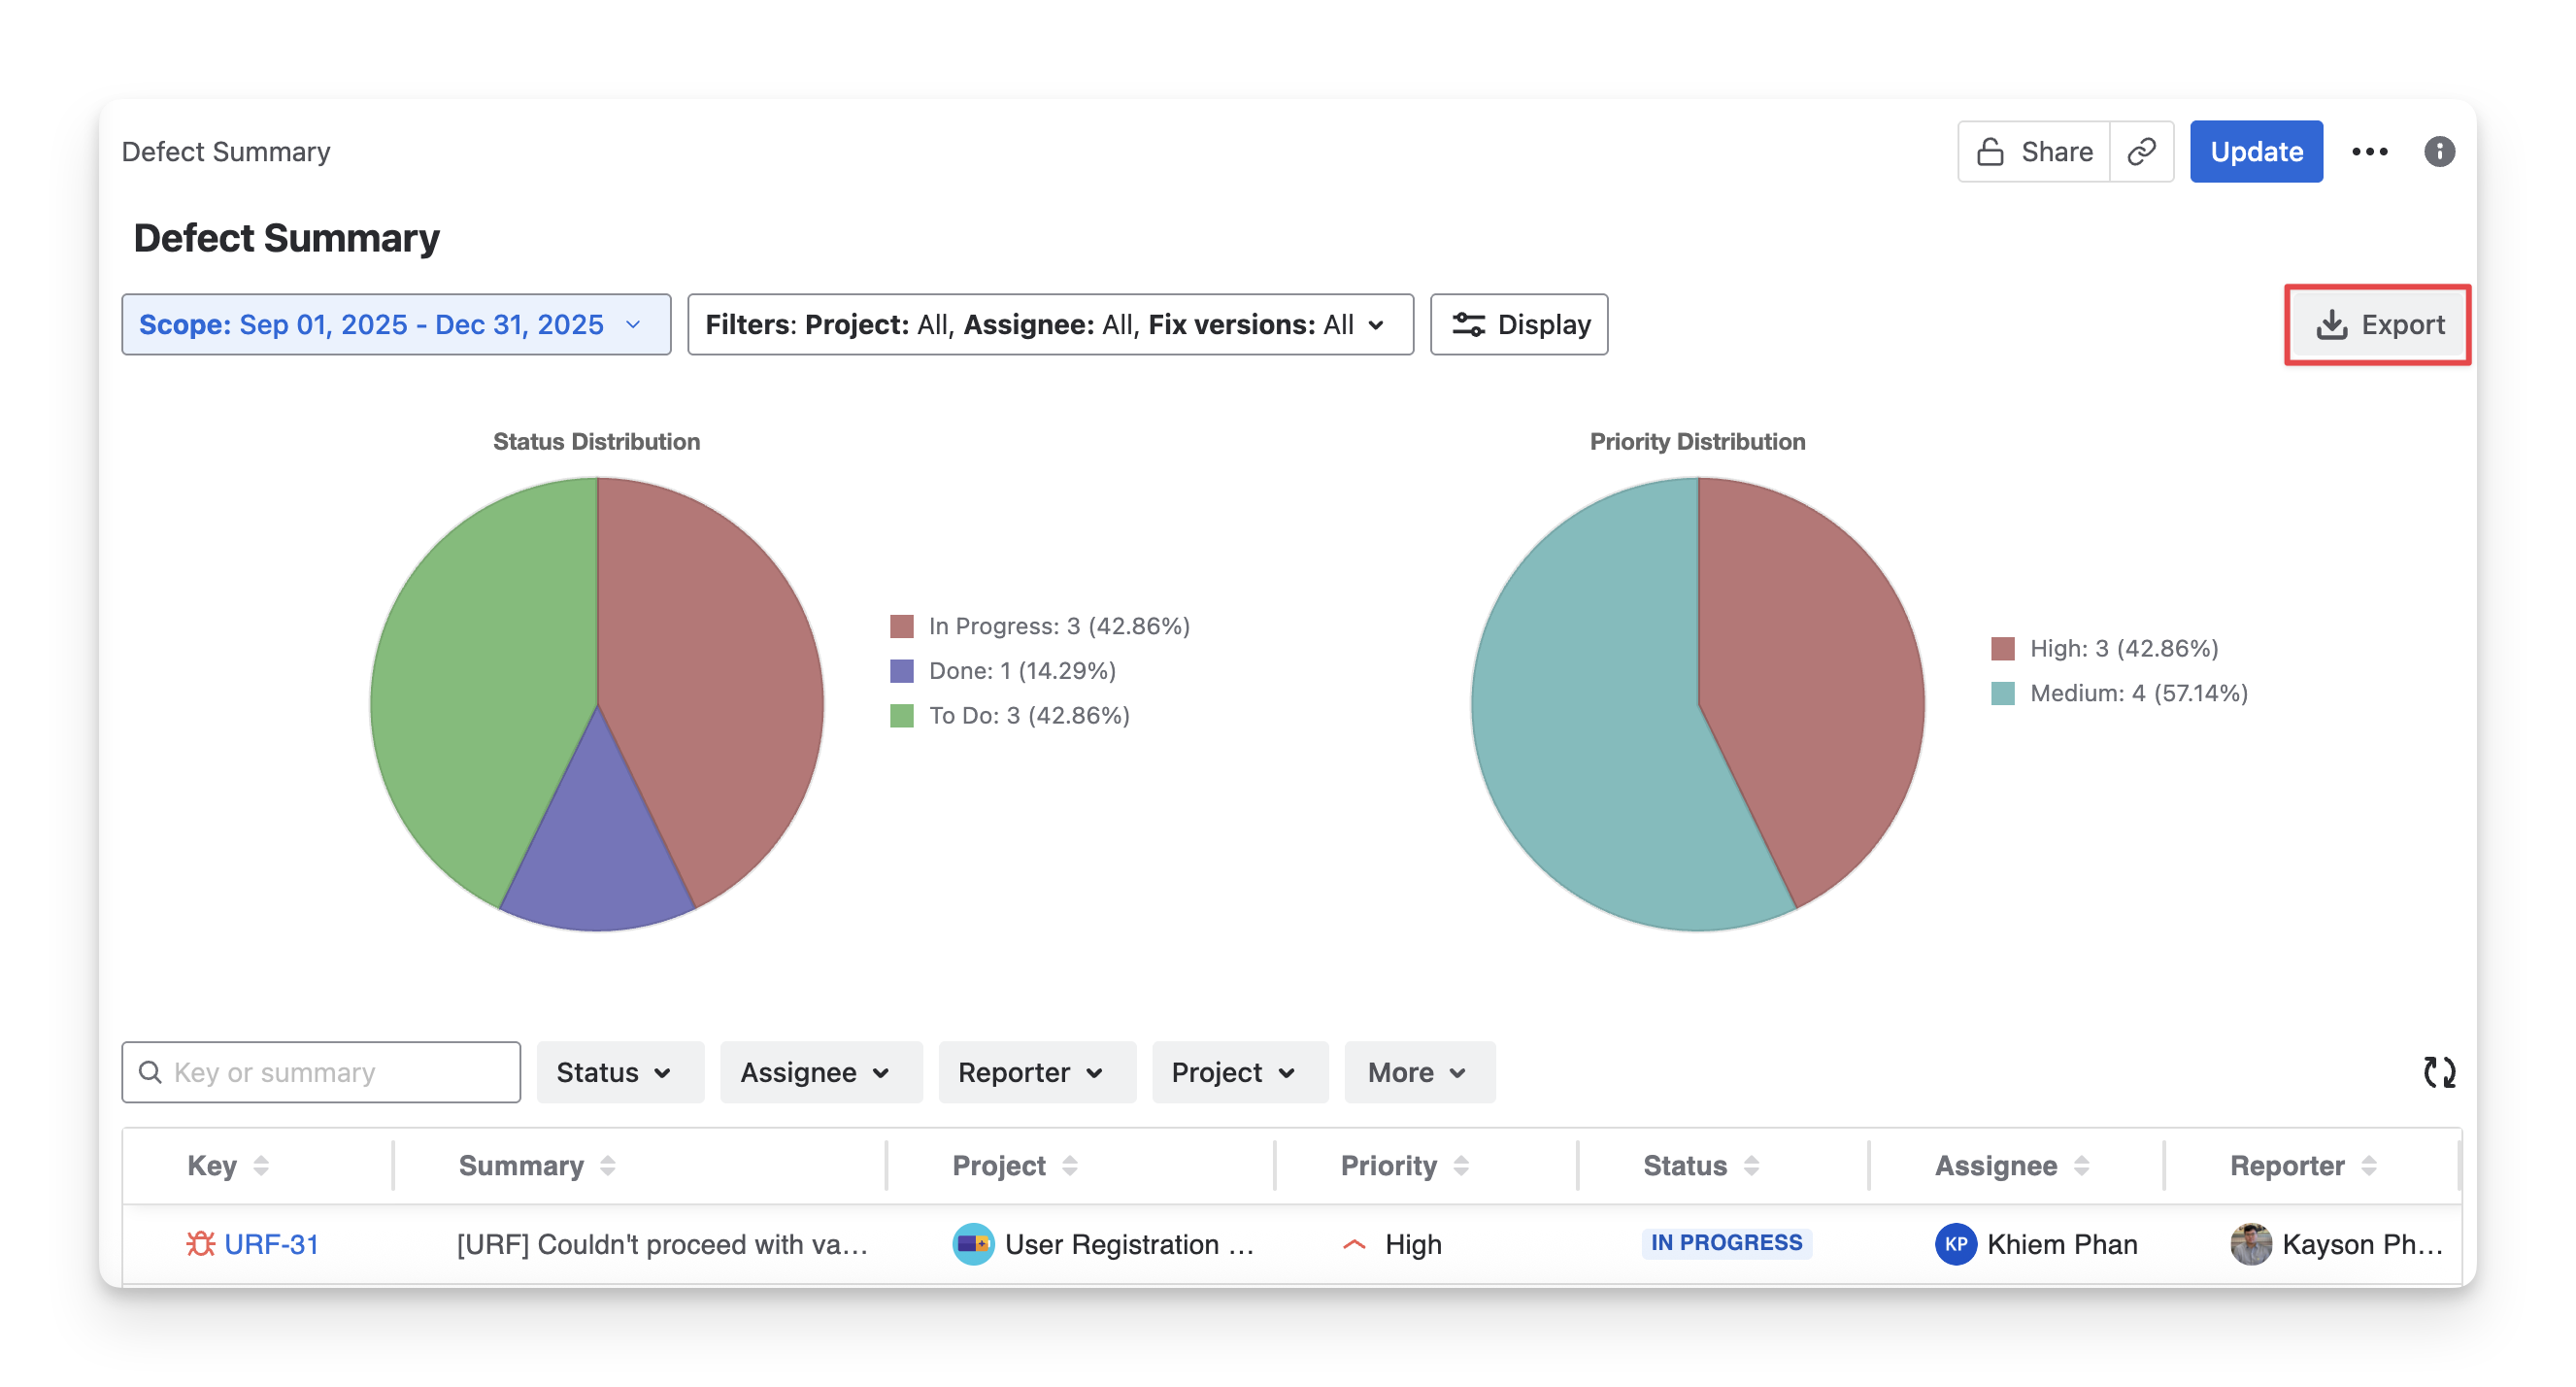
In each Defect Summary Report, you will see 2 main sections:
-
Defect Distribution Chart: A visual overview showing how defects are distributed by status, severity, or priority, helping you quickly identify problem areas and trends.
-
Defect Table: A list of defects with detailed attributes.
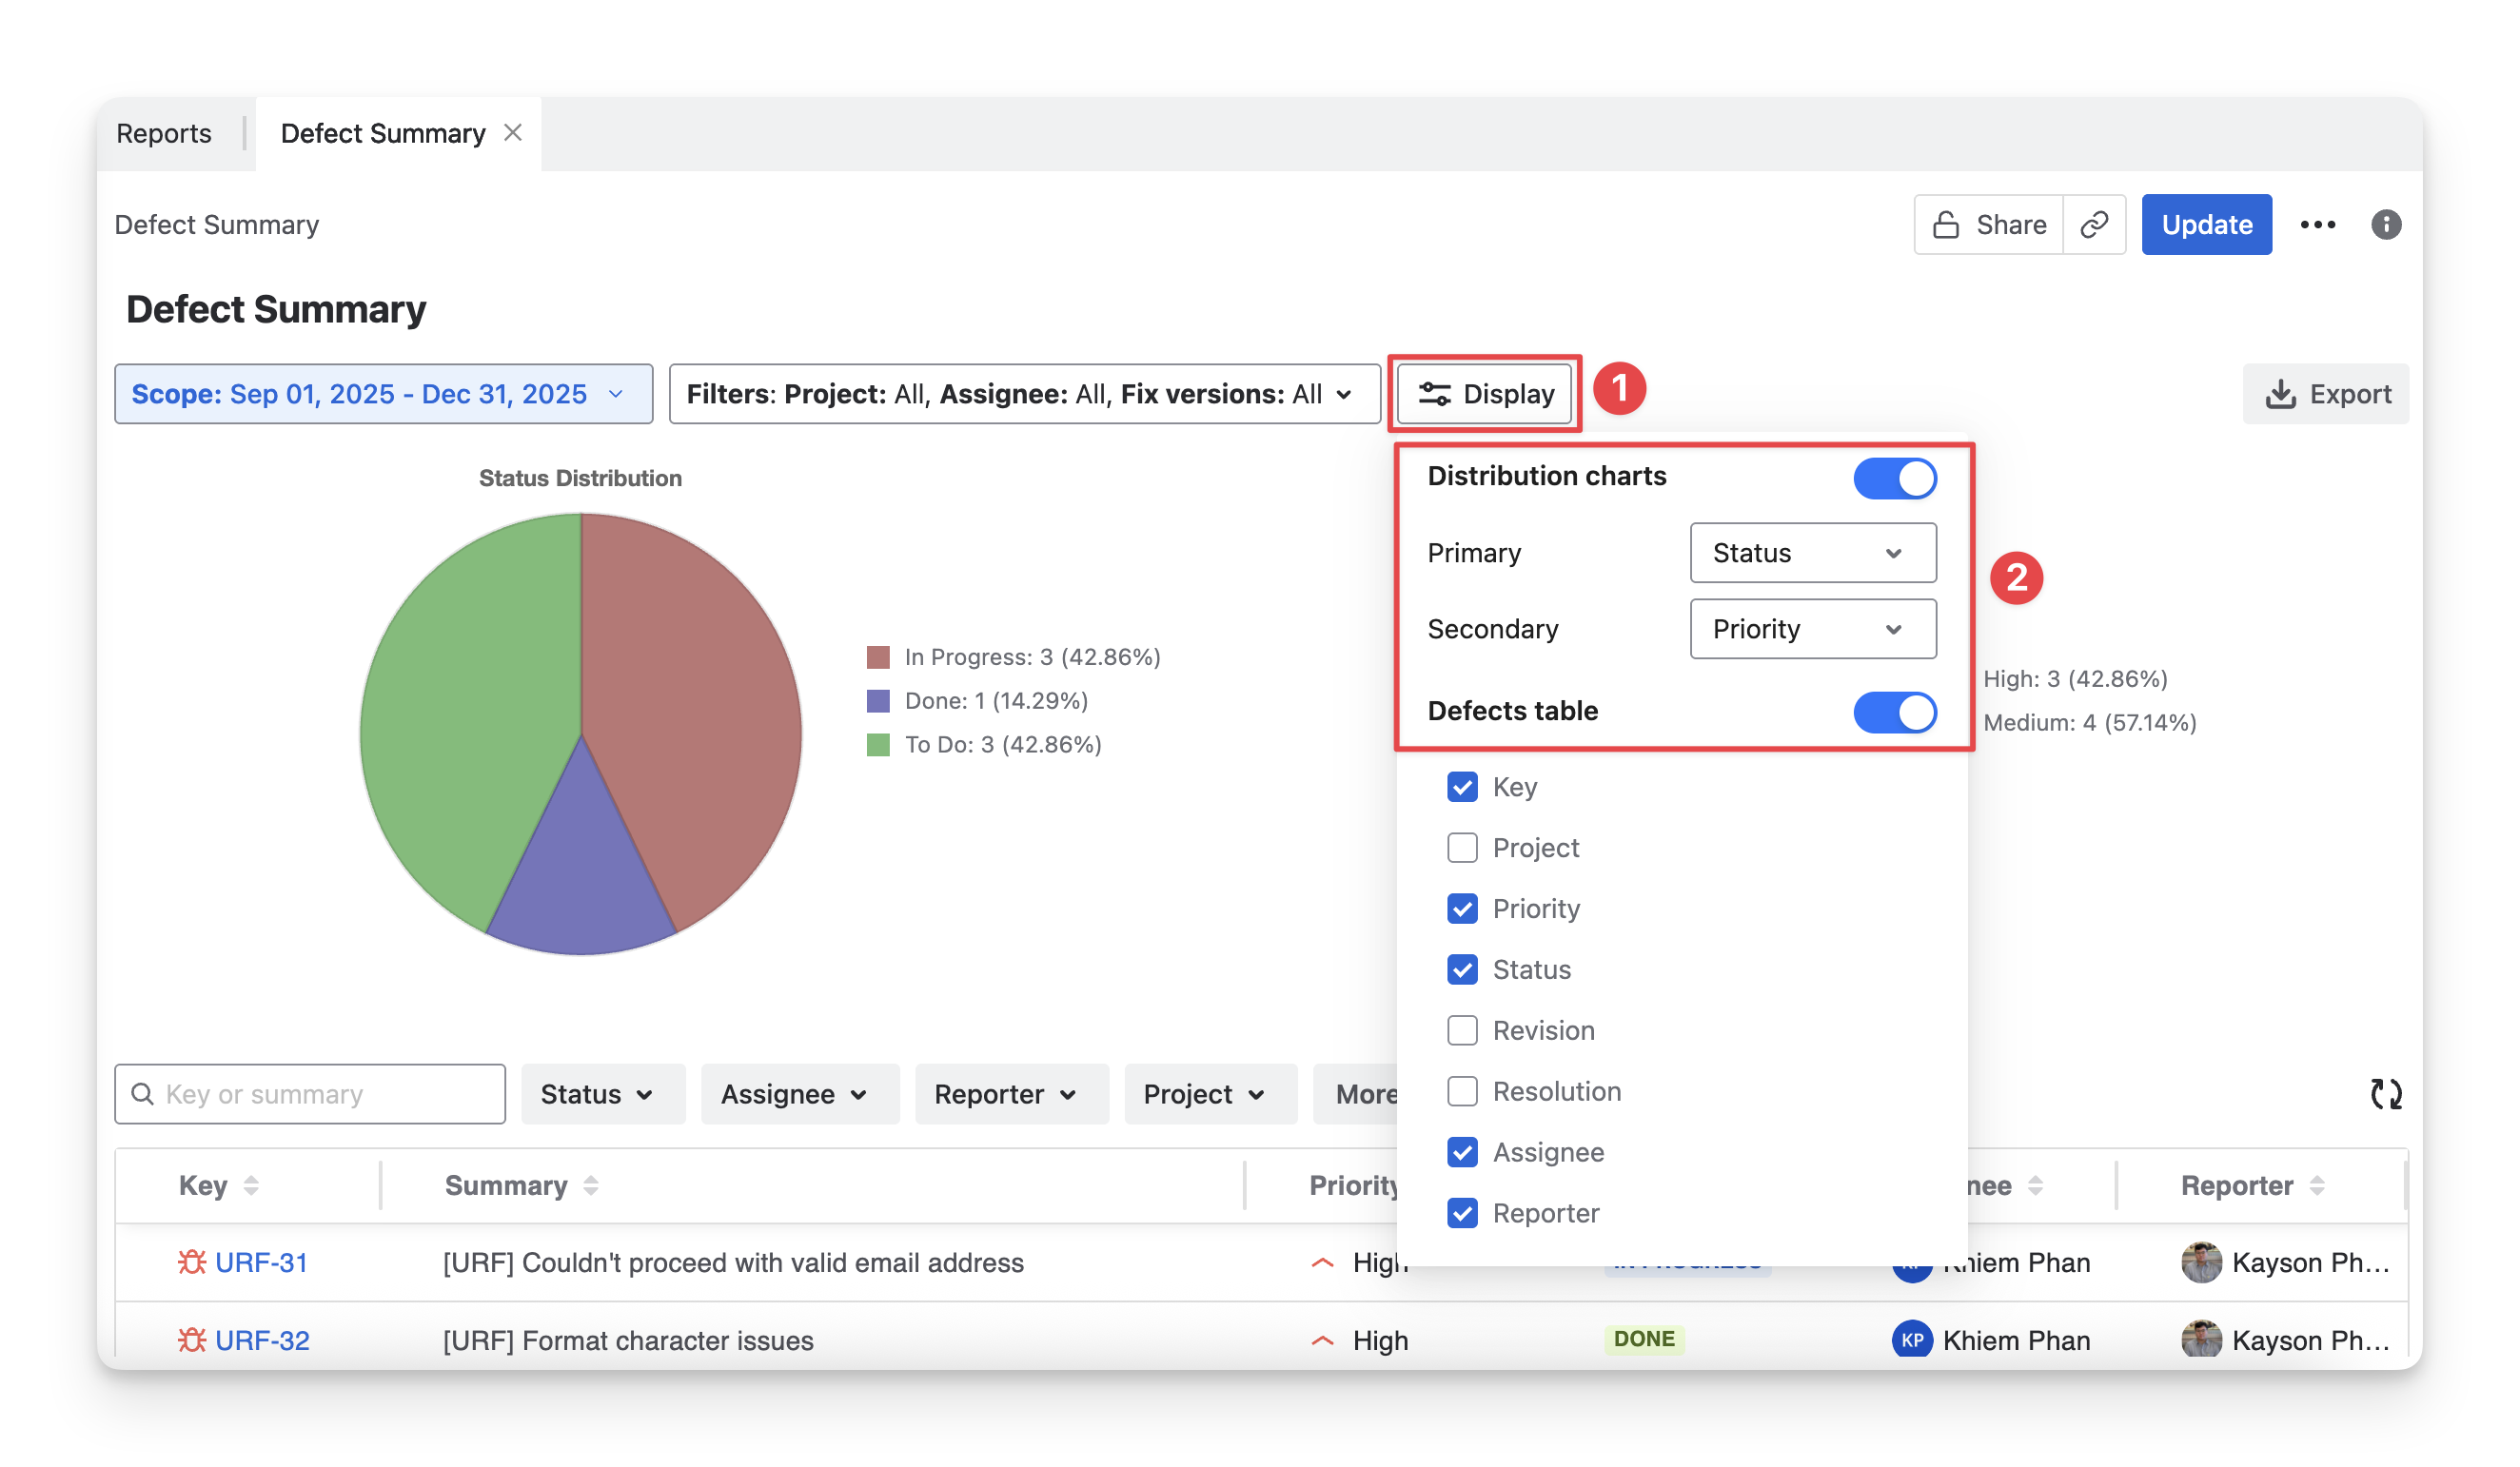
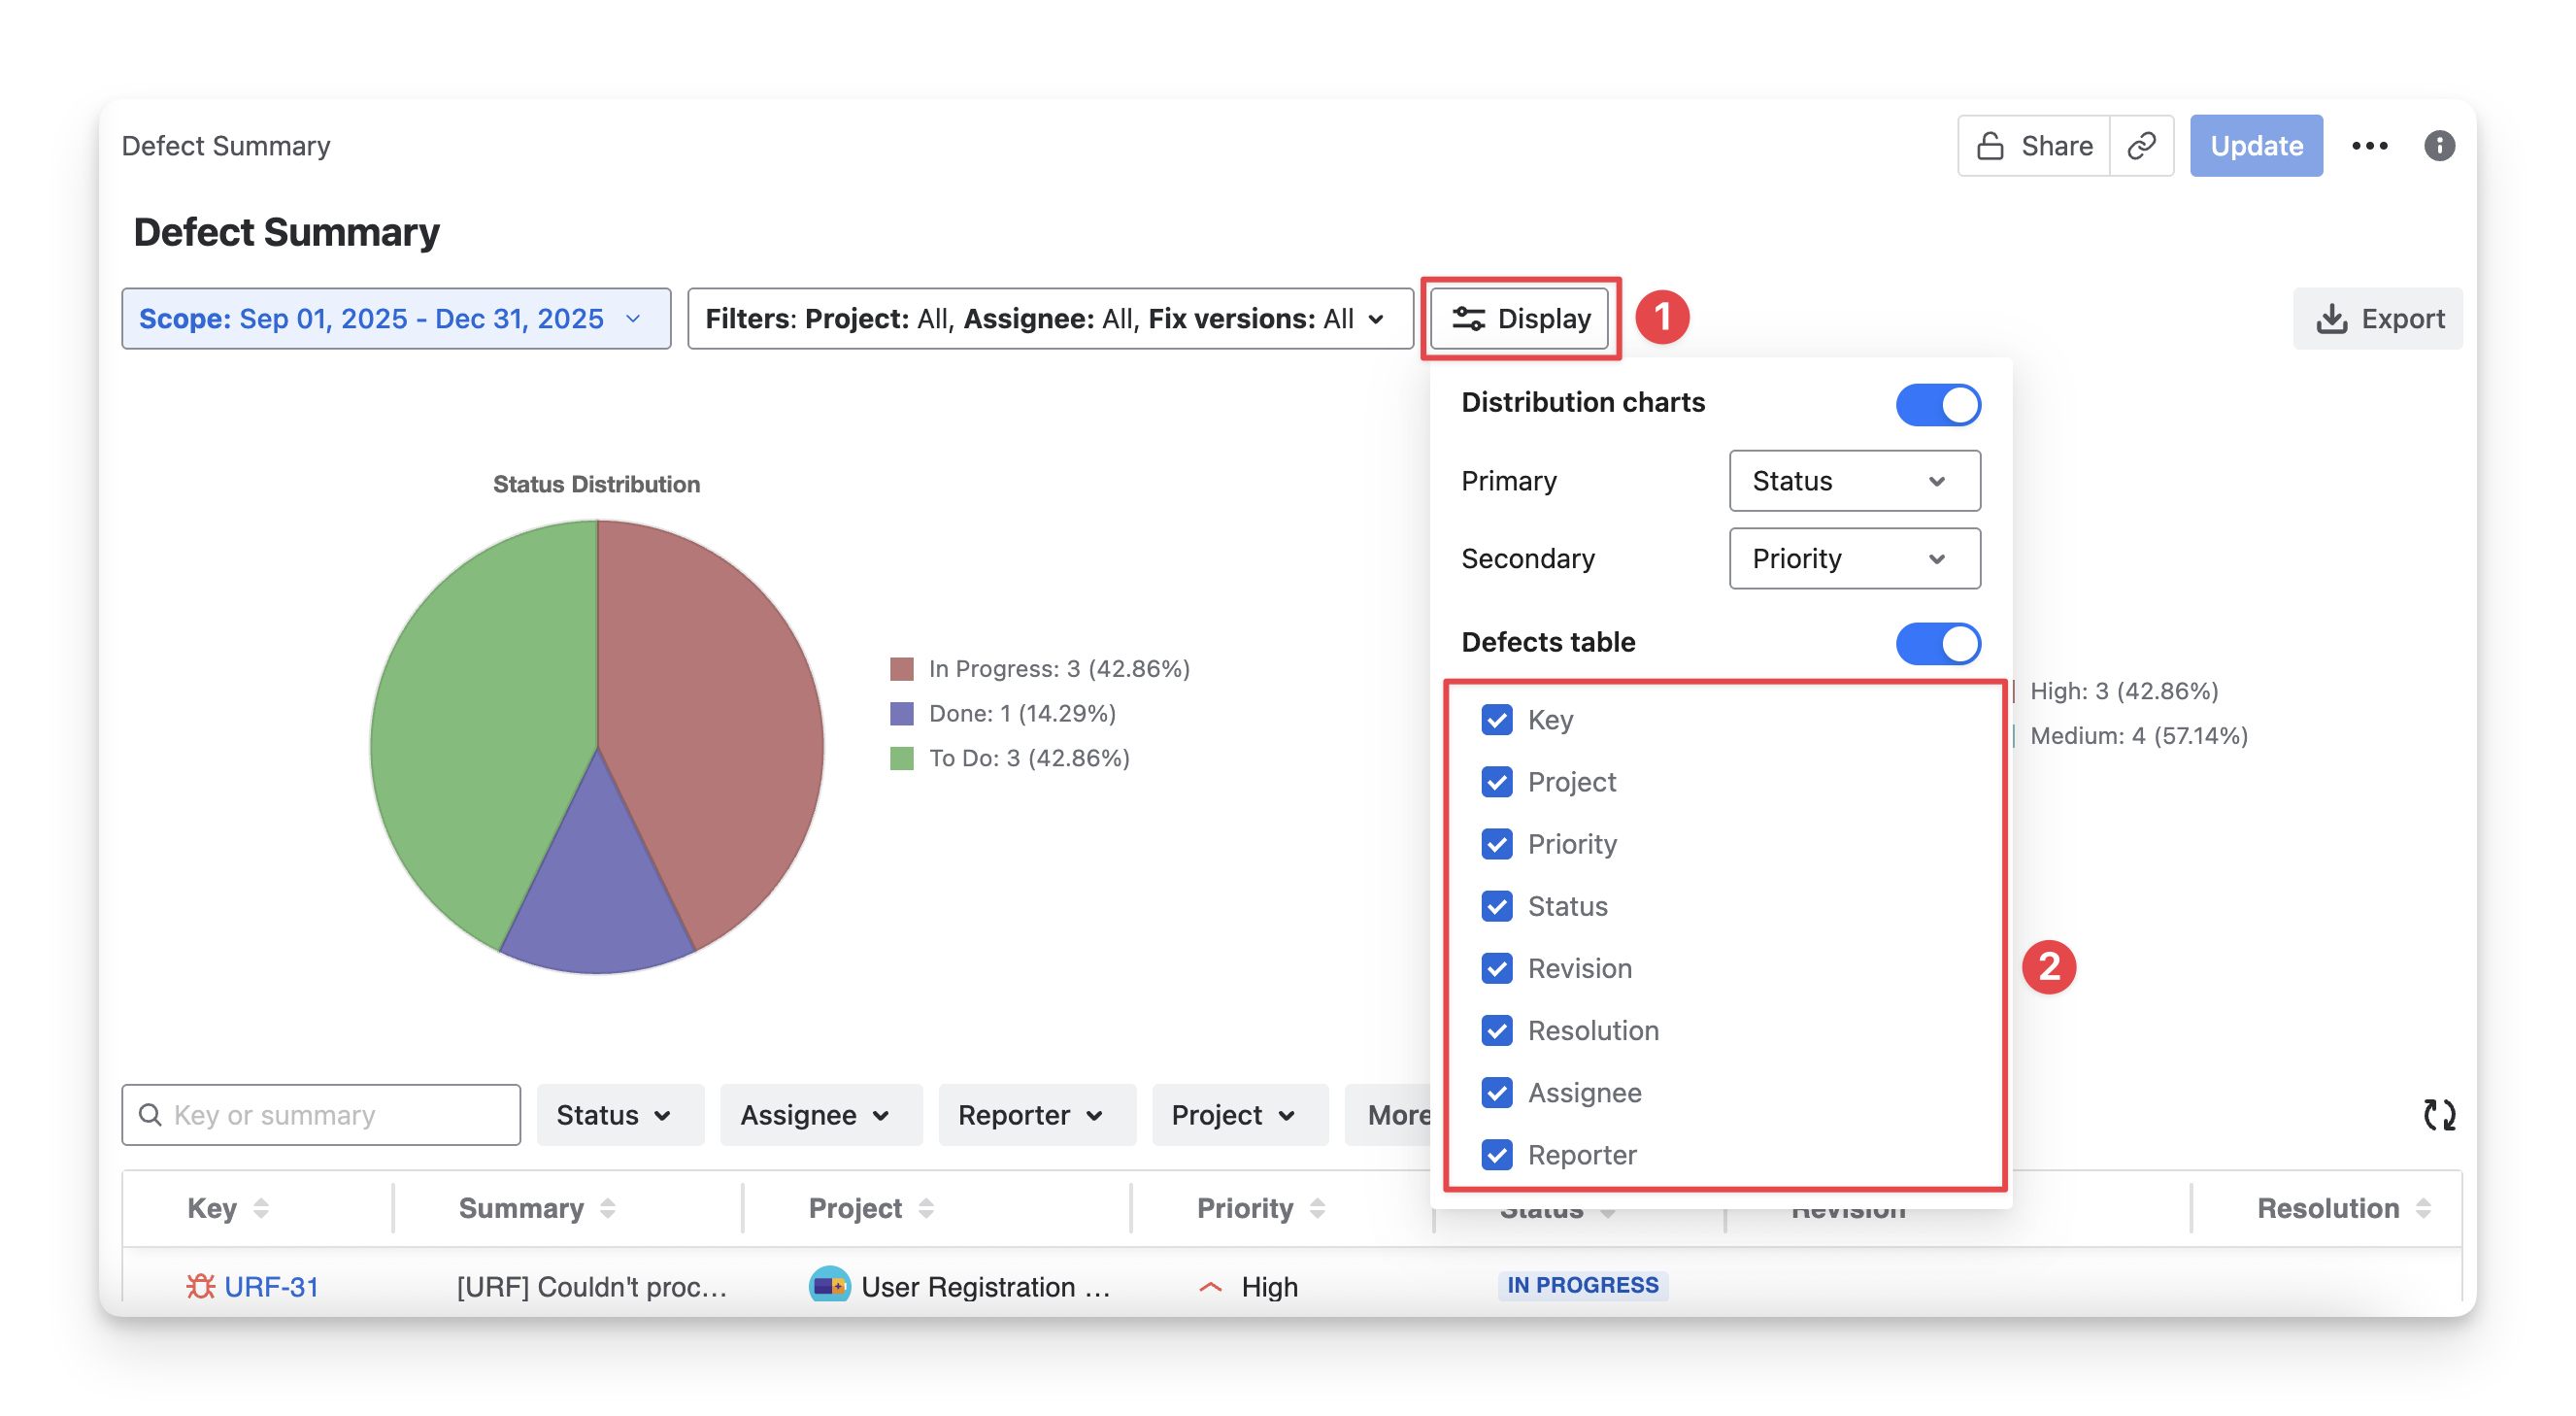
To show or hide any of the 2 sections in the Defect Summary report:
-
Click the Display button.
-
From there, you can turn on/off the switches to show or hide the whole Distribution chart and Defects table section.
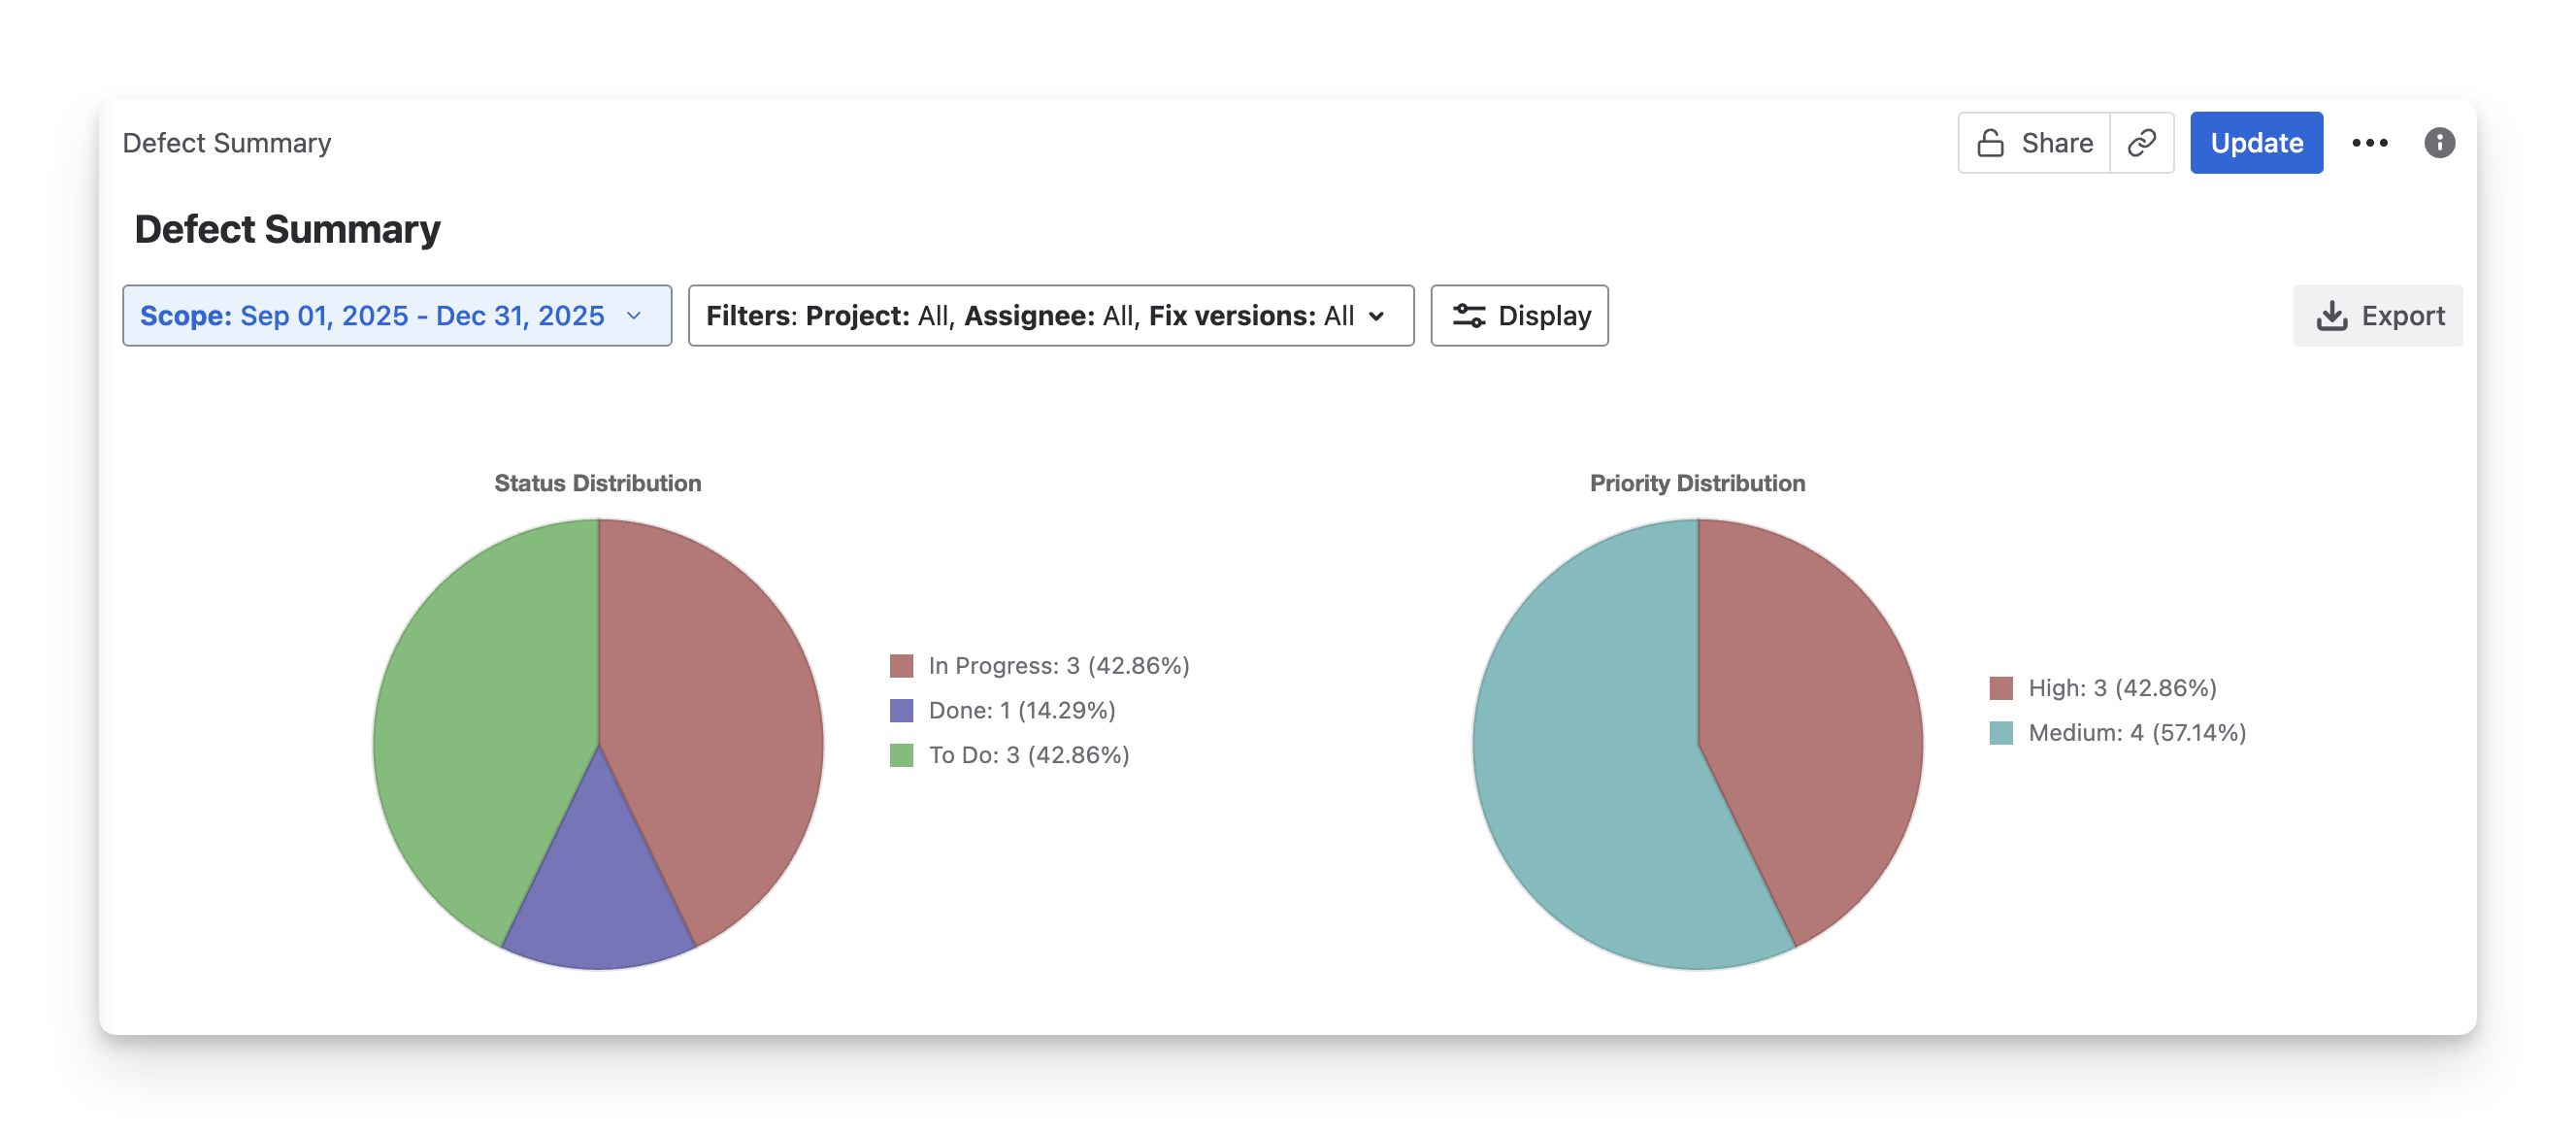
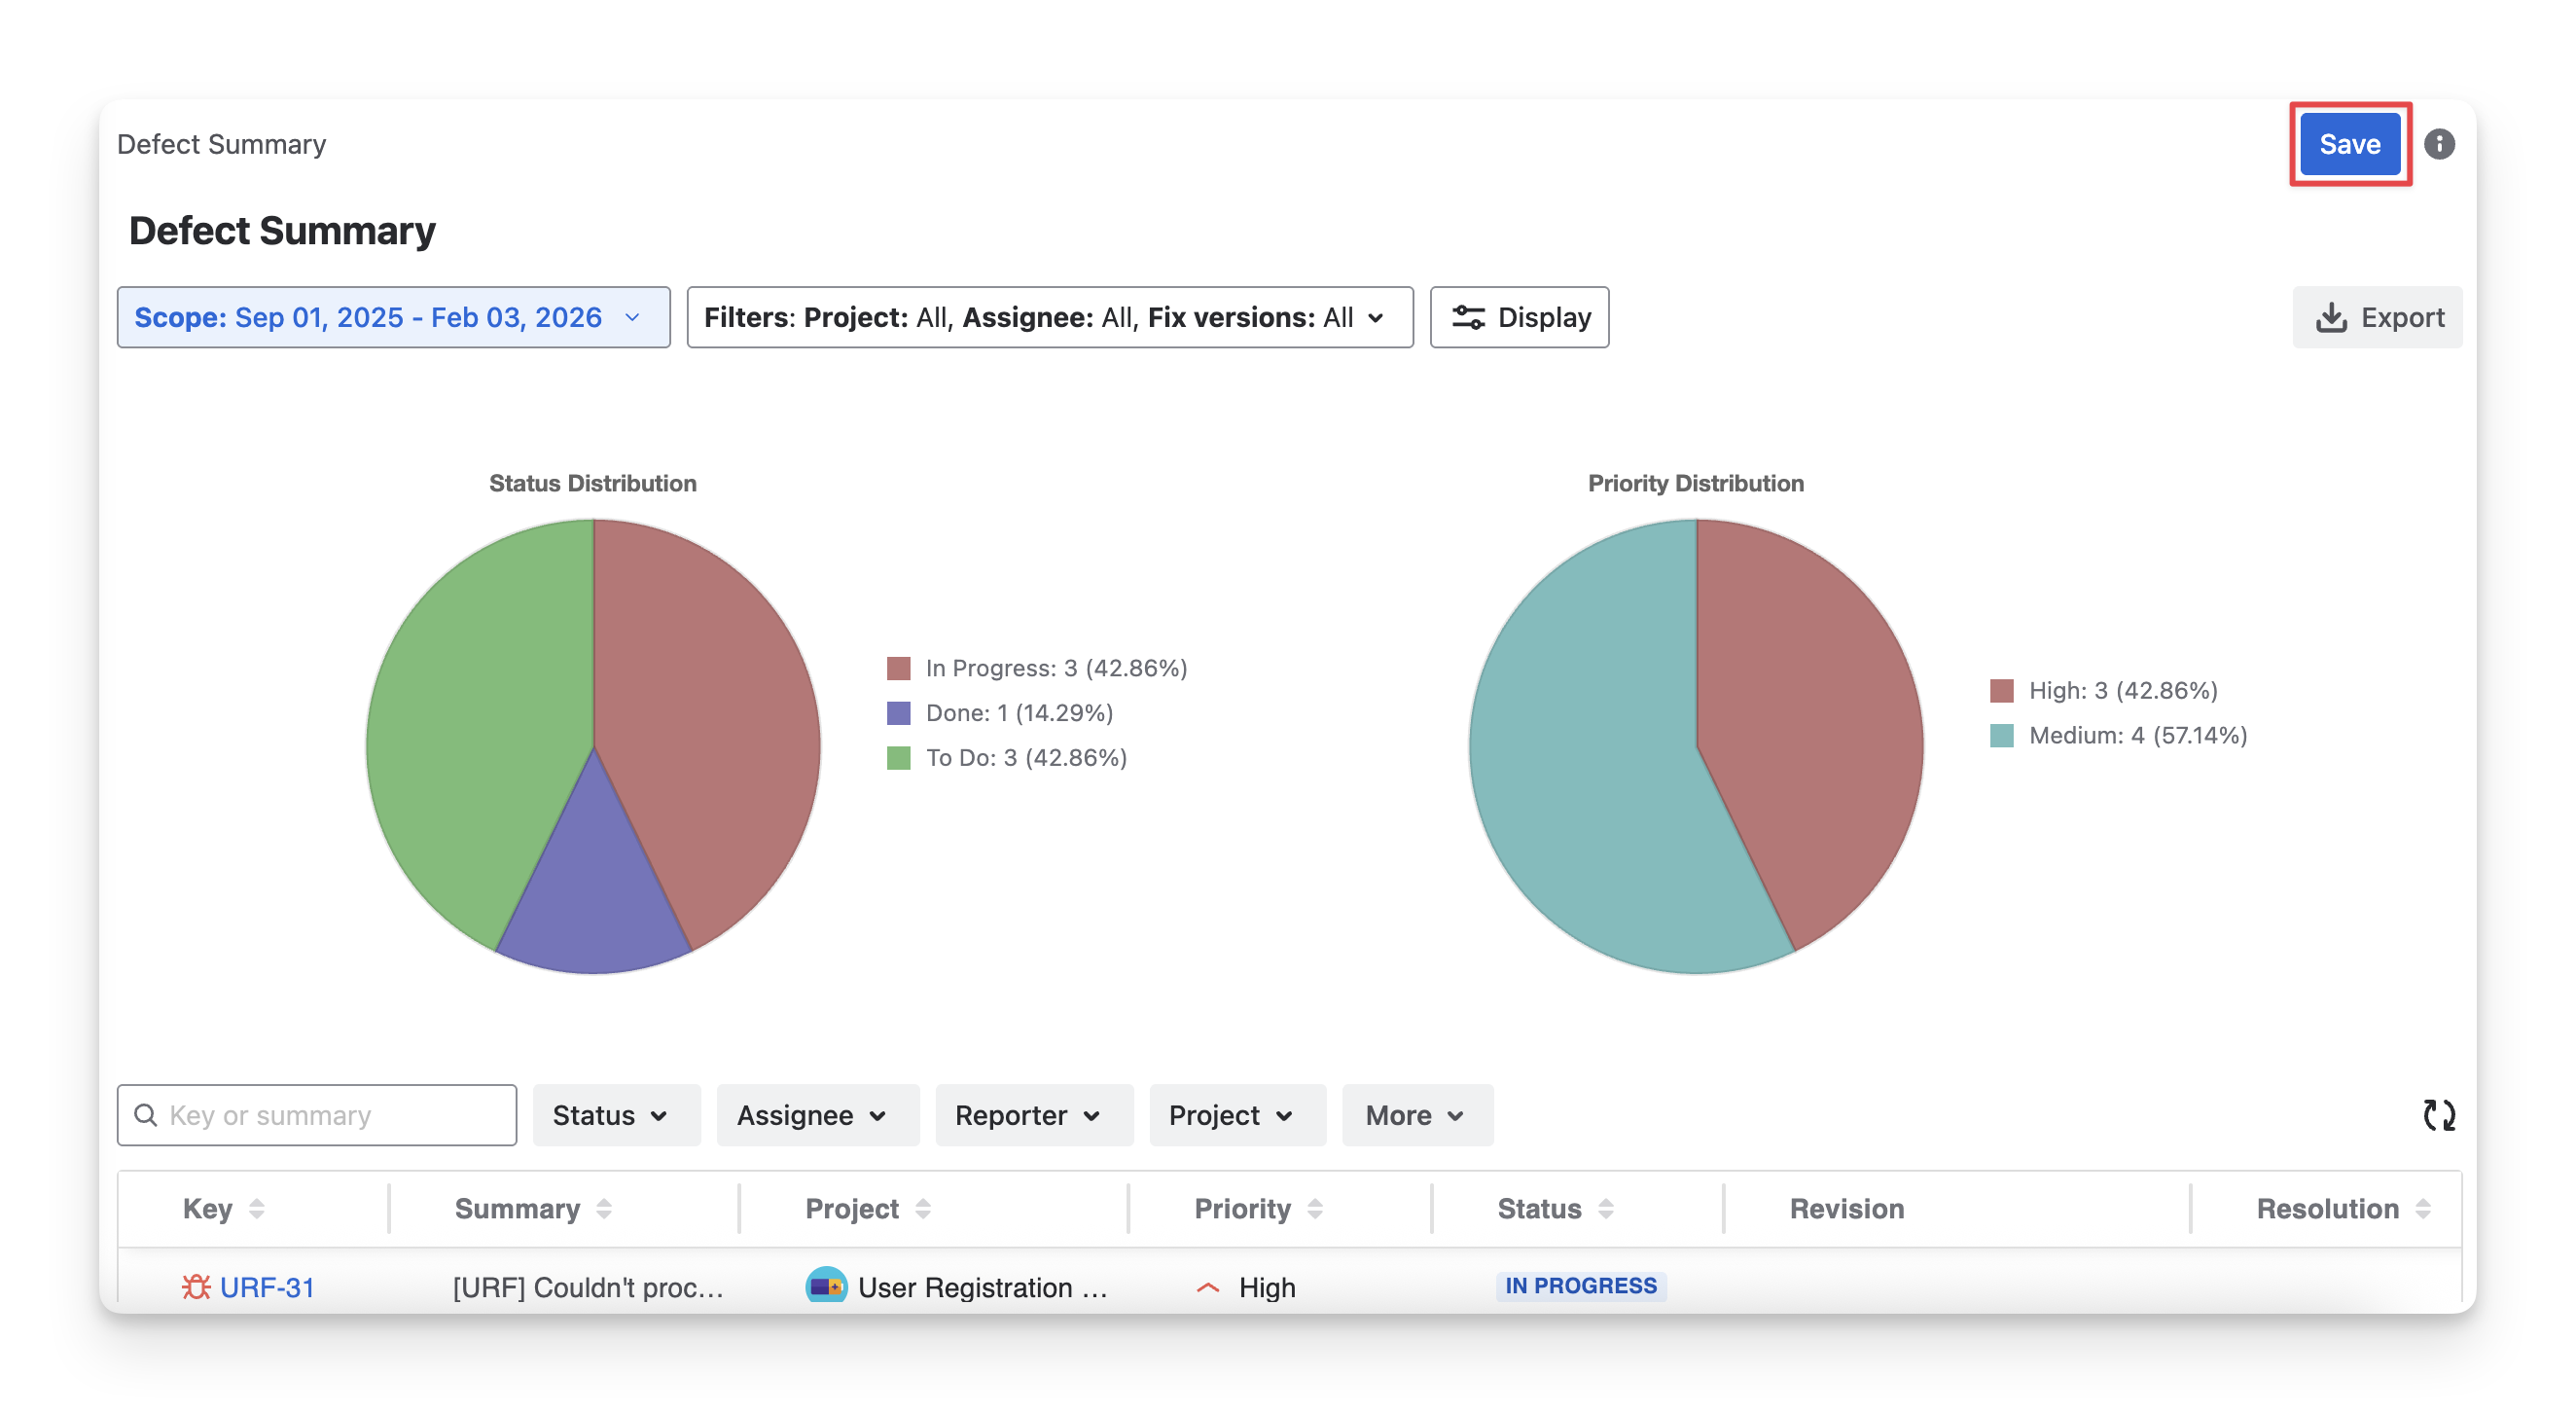
1. Defect Distribution Charts
This section displays two of the five available defect distribution charts. Each chart highlights a different aspect of defect data, allowing you to quickly analyze defect trends and focus on specific quality indicators.
Currently, five defect charts that AgileTest supports are:
|
Type of chart |
Description |
|
Status distribution |
Shows defects across statuses (e.g., Open, In Progress, Resolved, Closed). This helps you see overall progress and remaining defects. |
|
Priority distribution |
Displays defect counts by priority (e.g., High, Medium, Low). Use this to identify critical issues that may delay releases. |
|
Assignee distribution |
Breaks down defects by assigned team members. This helps you understand workload and spot bottlenecks. |
|
Project distribution |
Shows which projects or modules defects belong to. Useful for spotting areas with more defects. |
|
Revision distribution |
Groups defects by revision, build, or version found. This helps track defect trends across releases or cycles. |
In this section, you can:
-
Select which defect charts to display to focus on specific defect insights.
-
Manage the data scope using Analysis & Scope to control which defects are included in the report.
-
Refine the displayed results by applying filters.
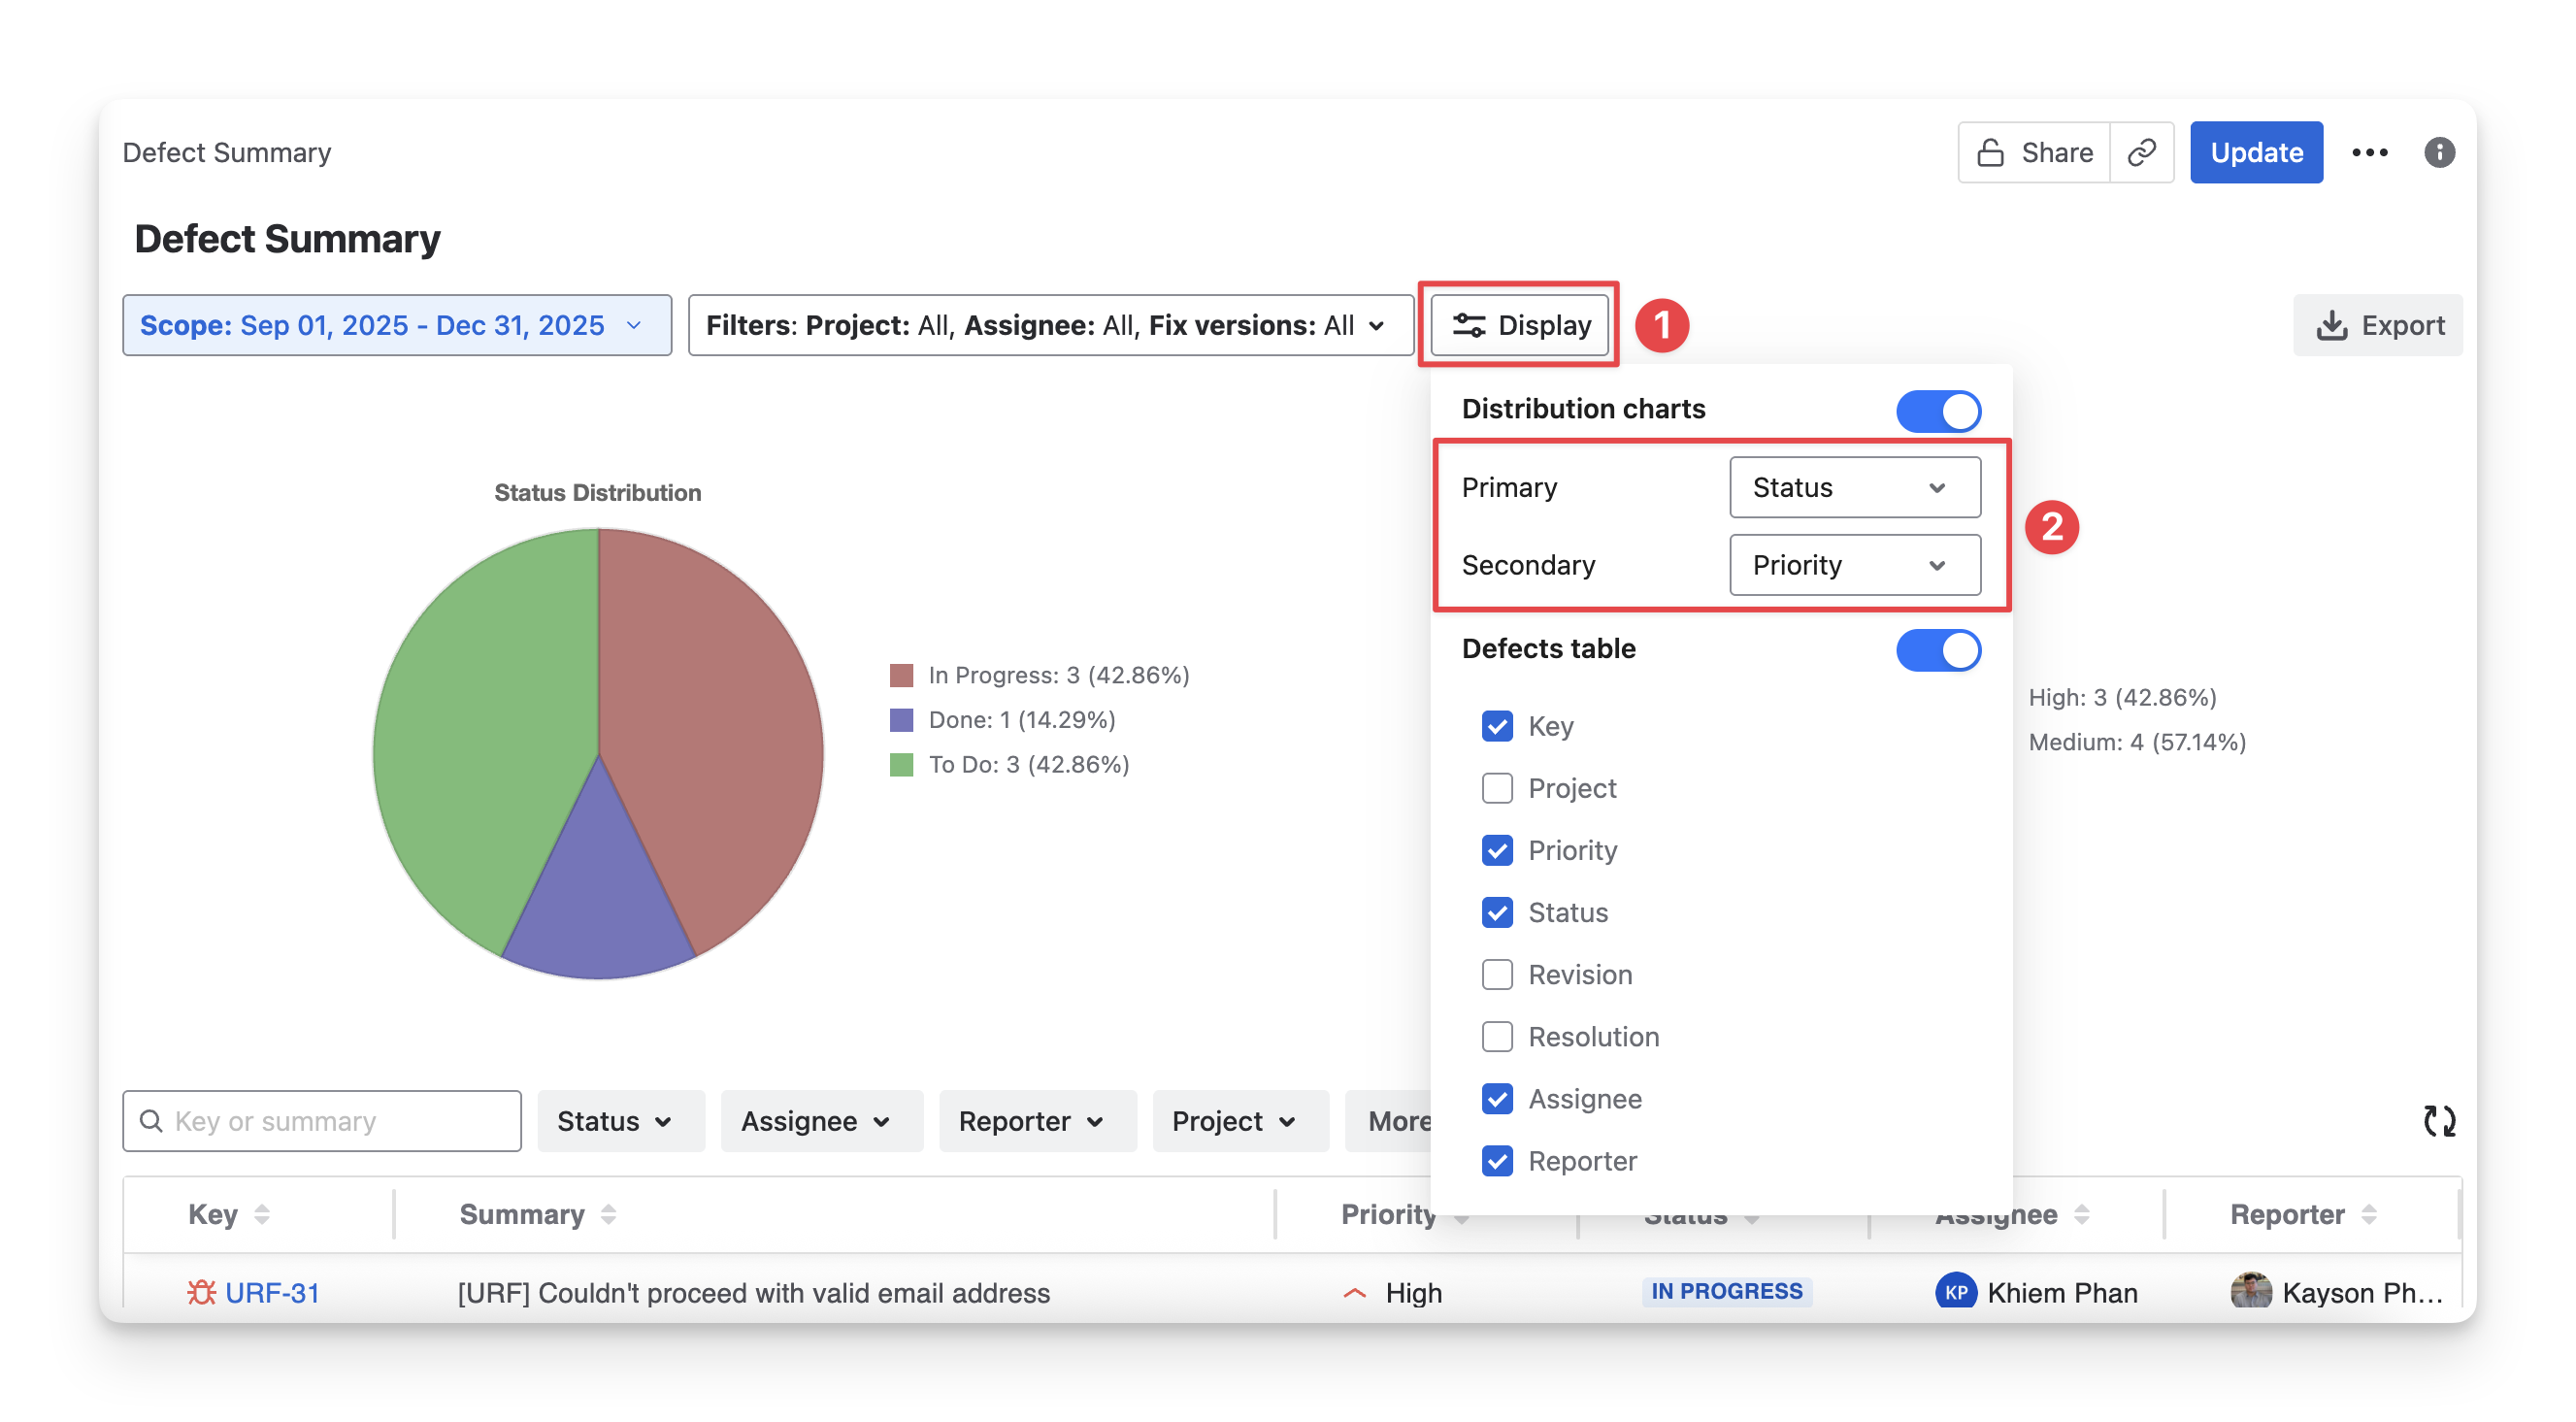
1.1 Select Defect Charts
You can switch between chart types to explore defect distribution from different perspectives. To do this, follow these steps:
-
Click on the Display button.
-
Click on the dropdown menu to select 2 among 5 supported charts
-
The Primary chart will be displayed on the left-hand side.
-
The Secondary chart will be displayed on the right-hand side.
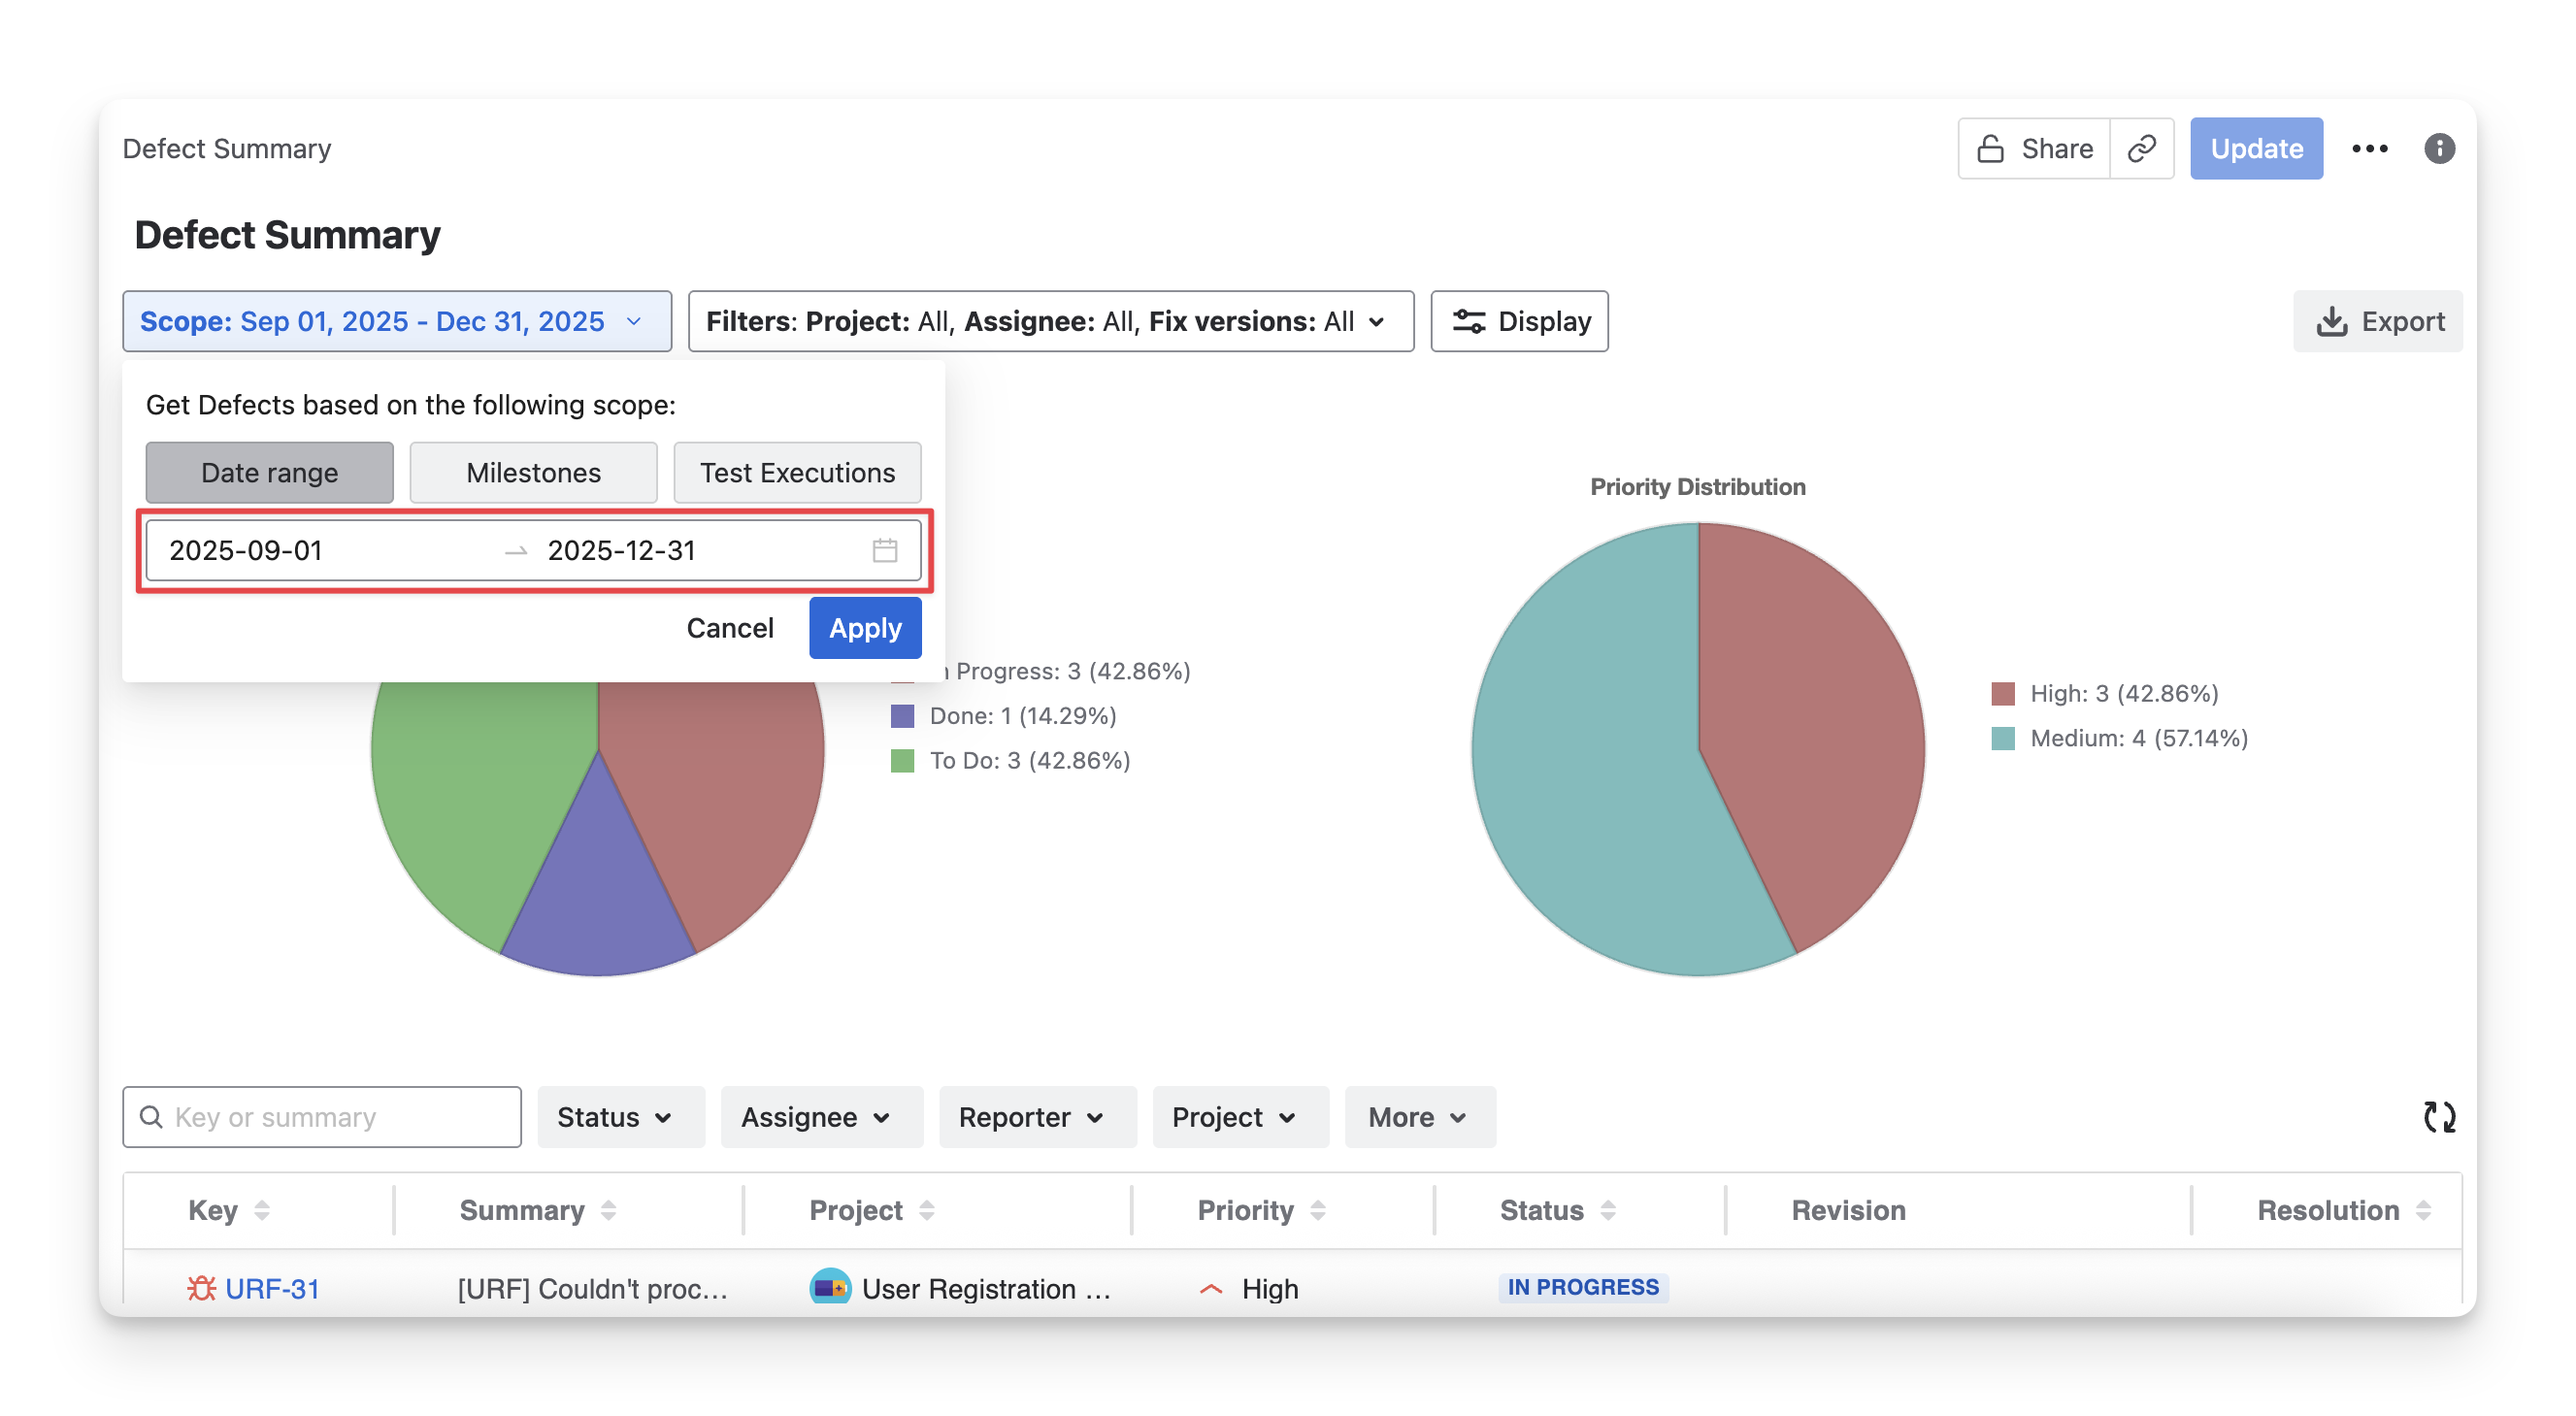
1.2 Analysis and Scope
The Scope lets you select the defect source. It can be a timeline to gather related defects from your testing projects or an execution where the defect was found.

Here, you have the options to narrow down the scope by:
-
Date range: select the beginning and end dates. The report will display only the defects in this timeframe.
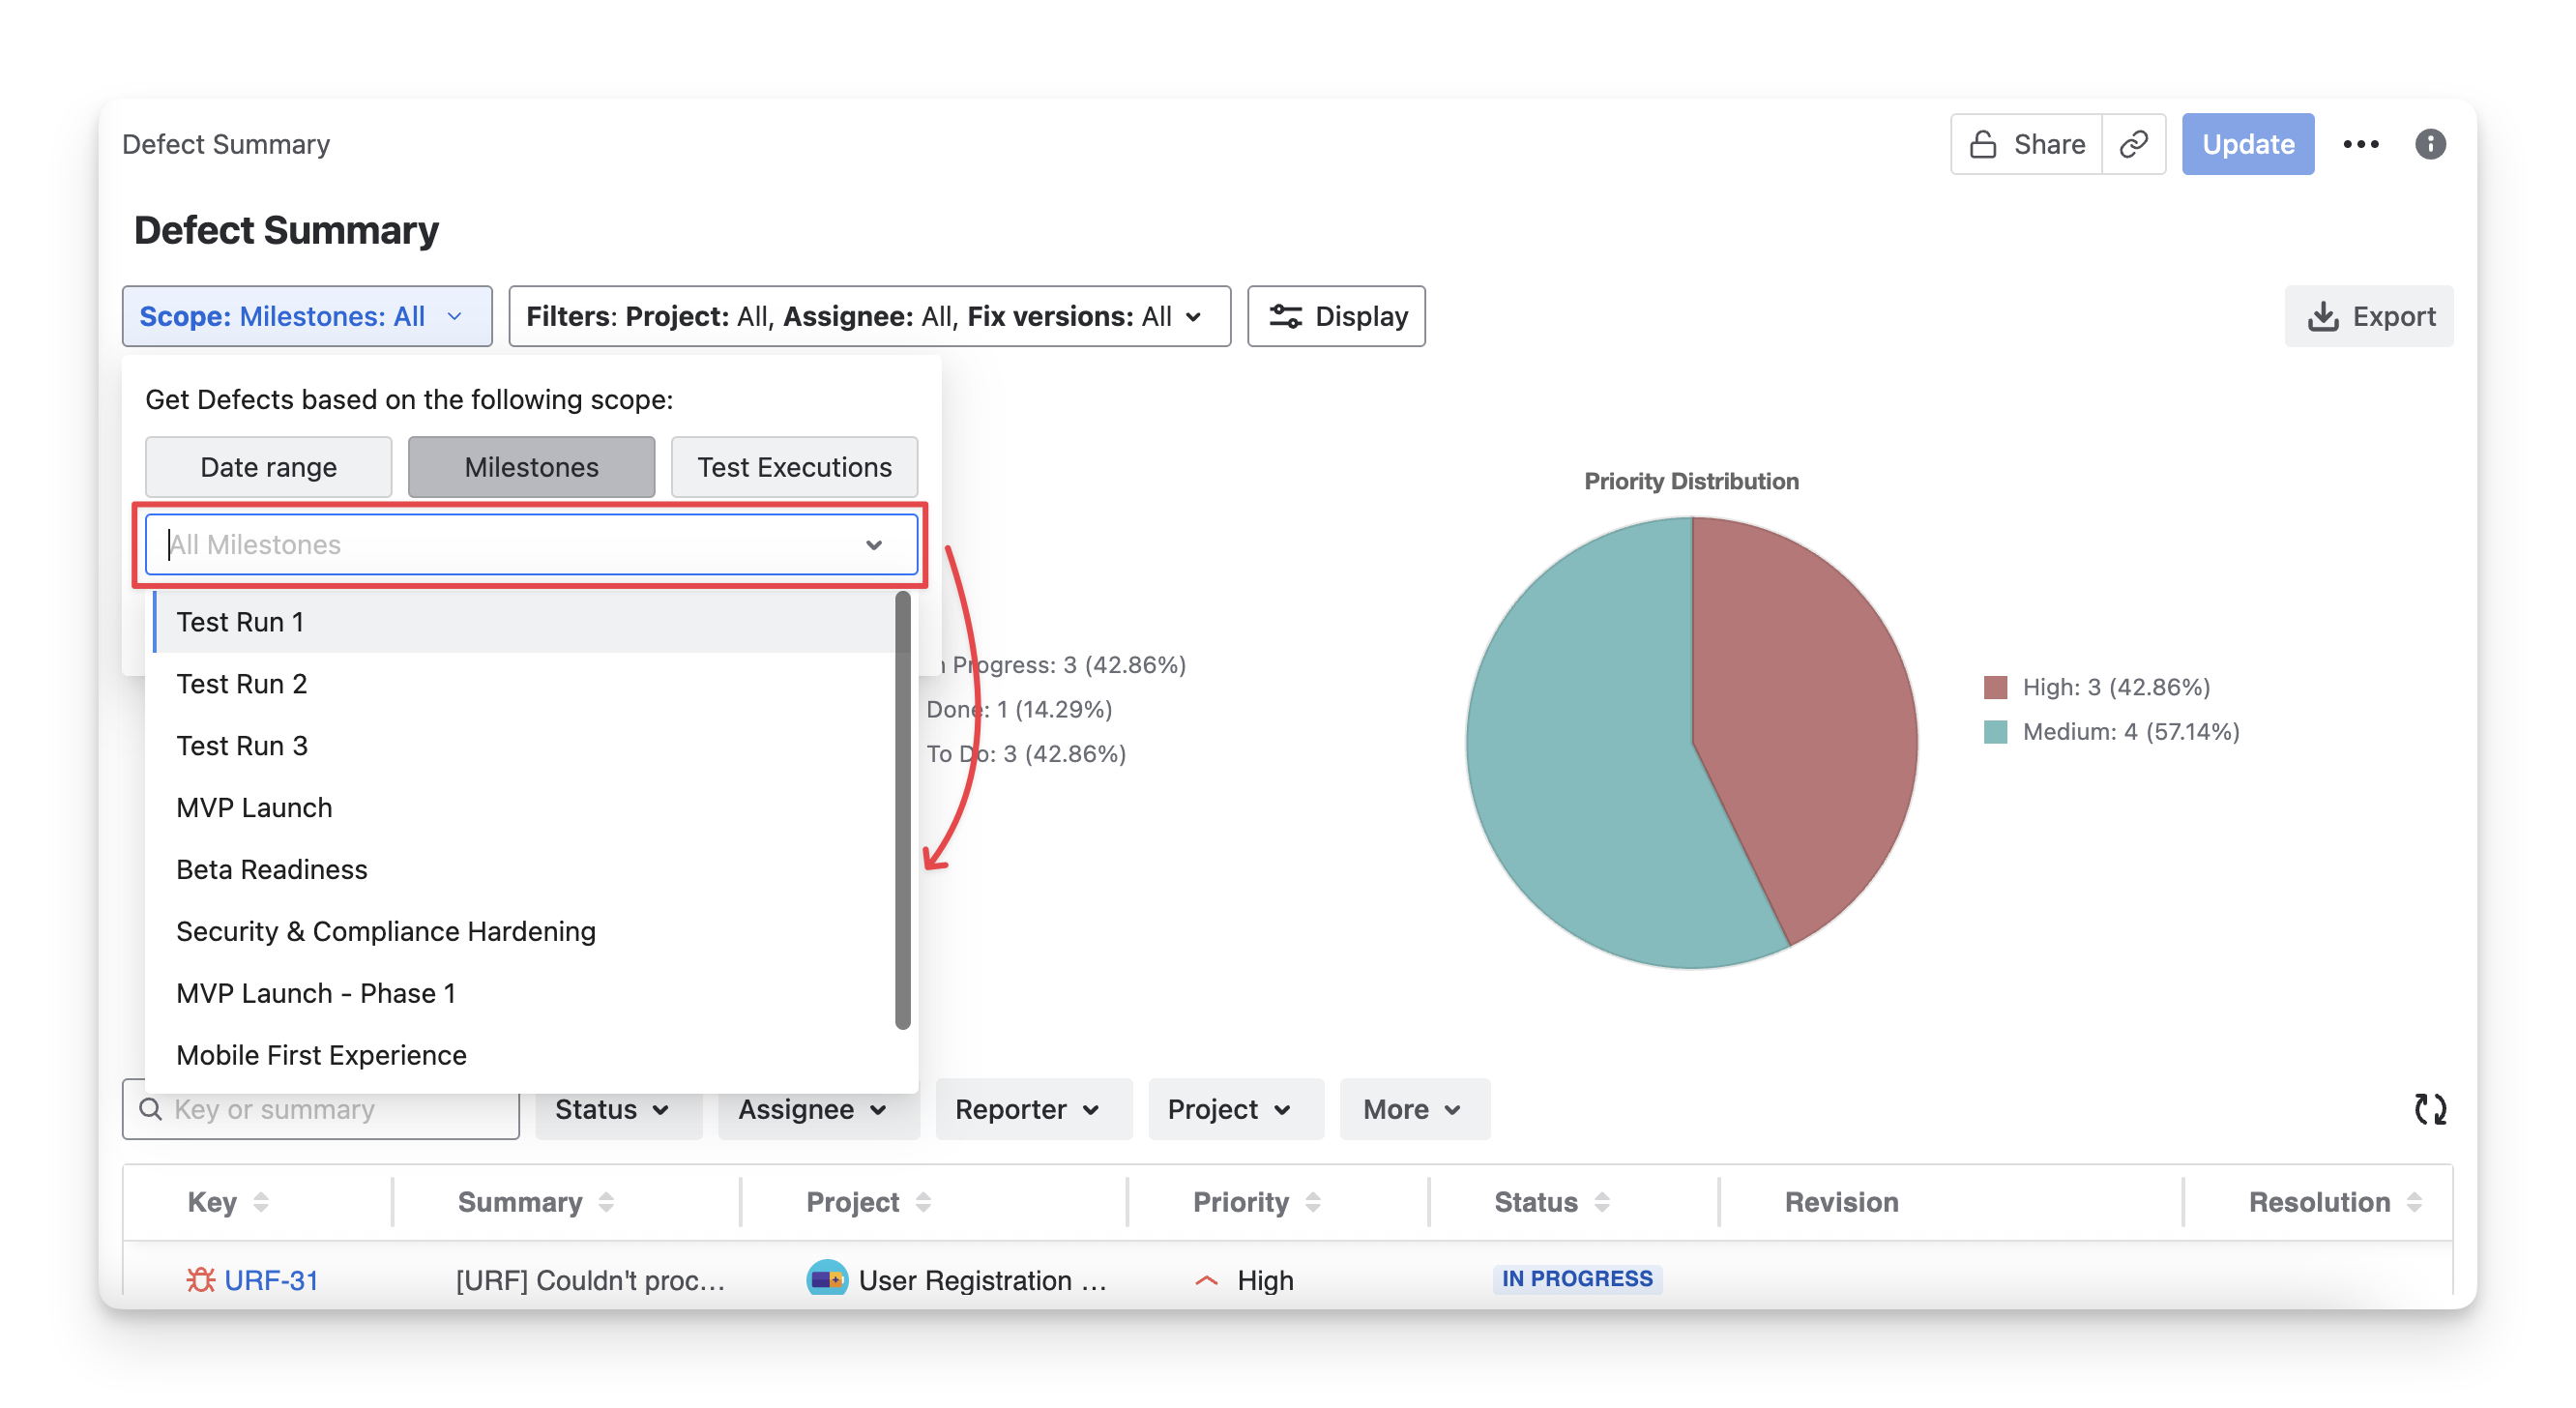
-
Milestones: select your created Milestone. The report will gather all defects found in this milestone
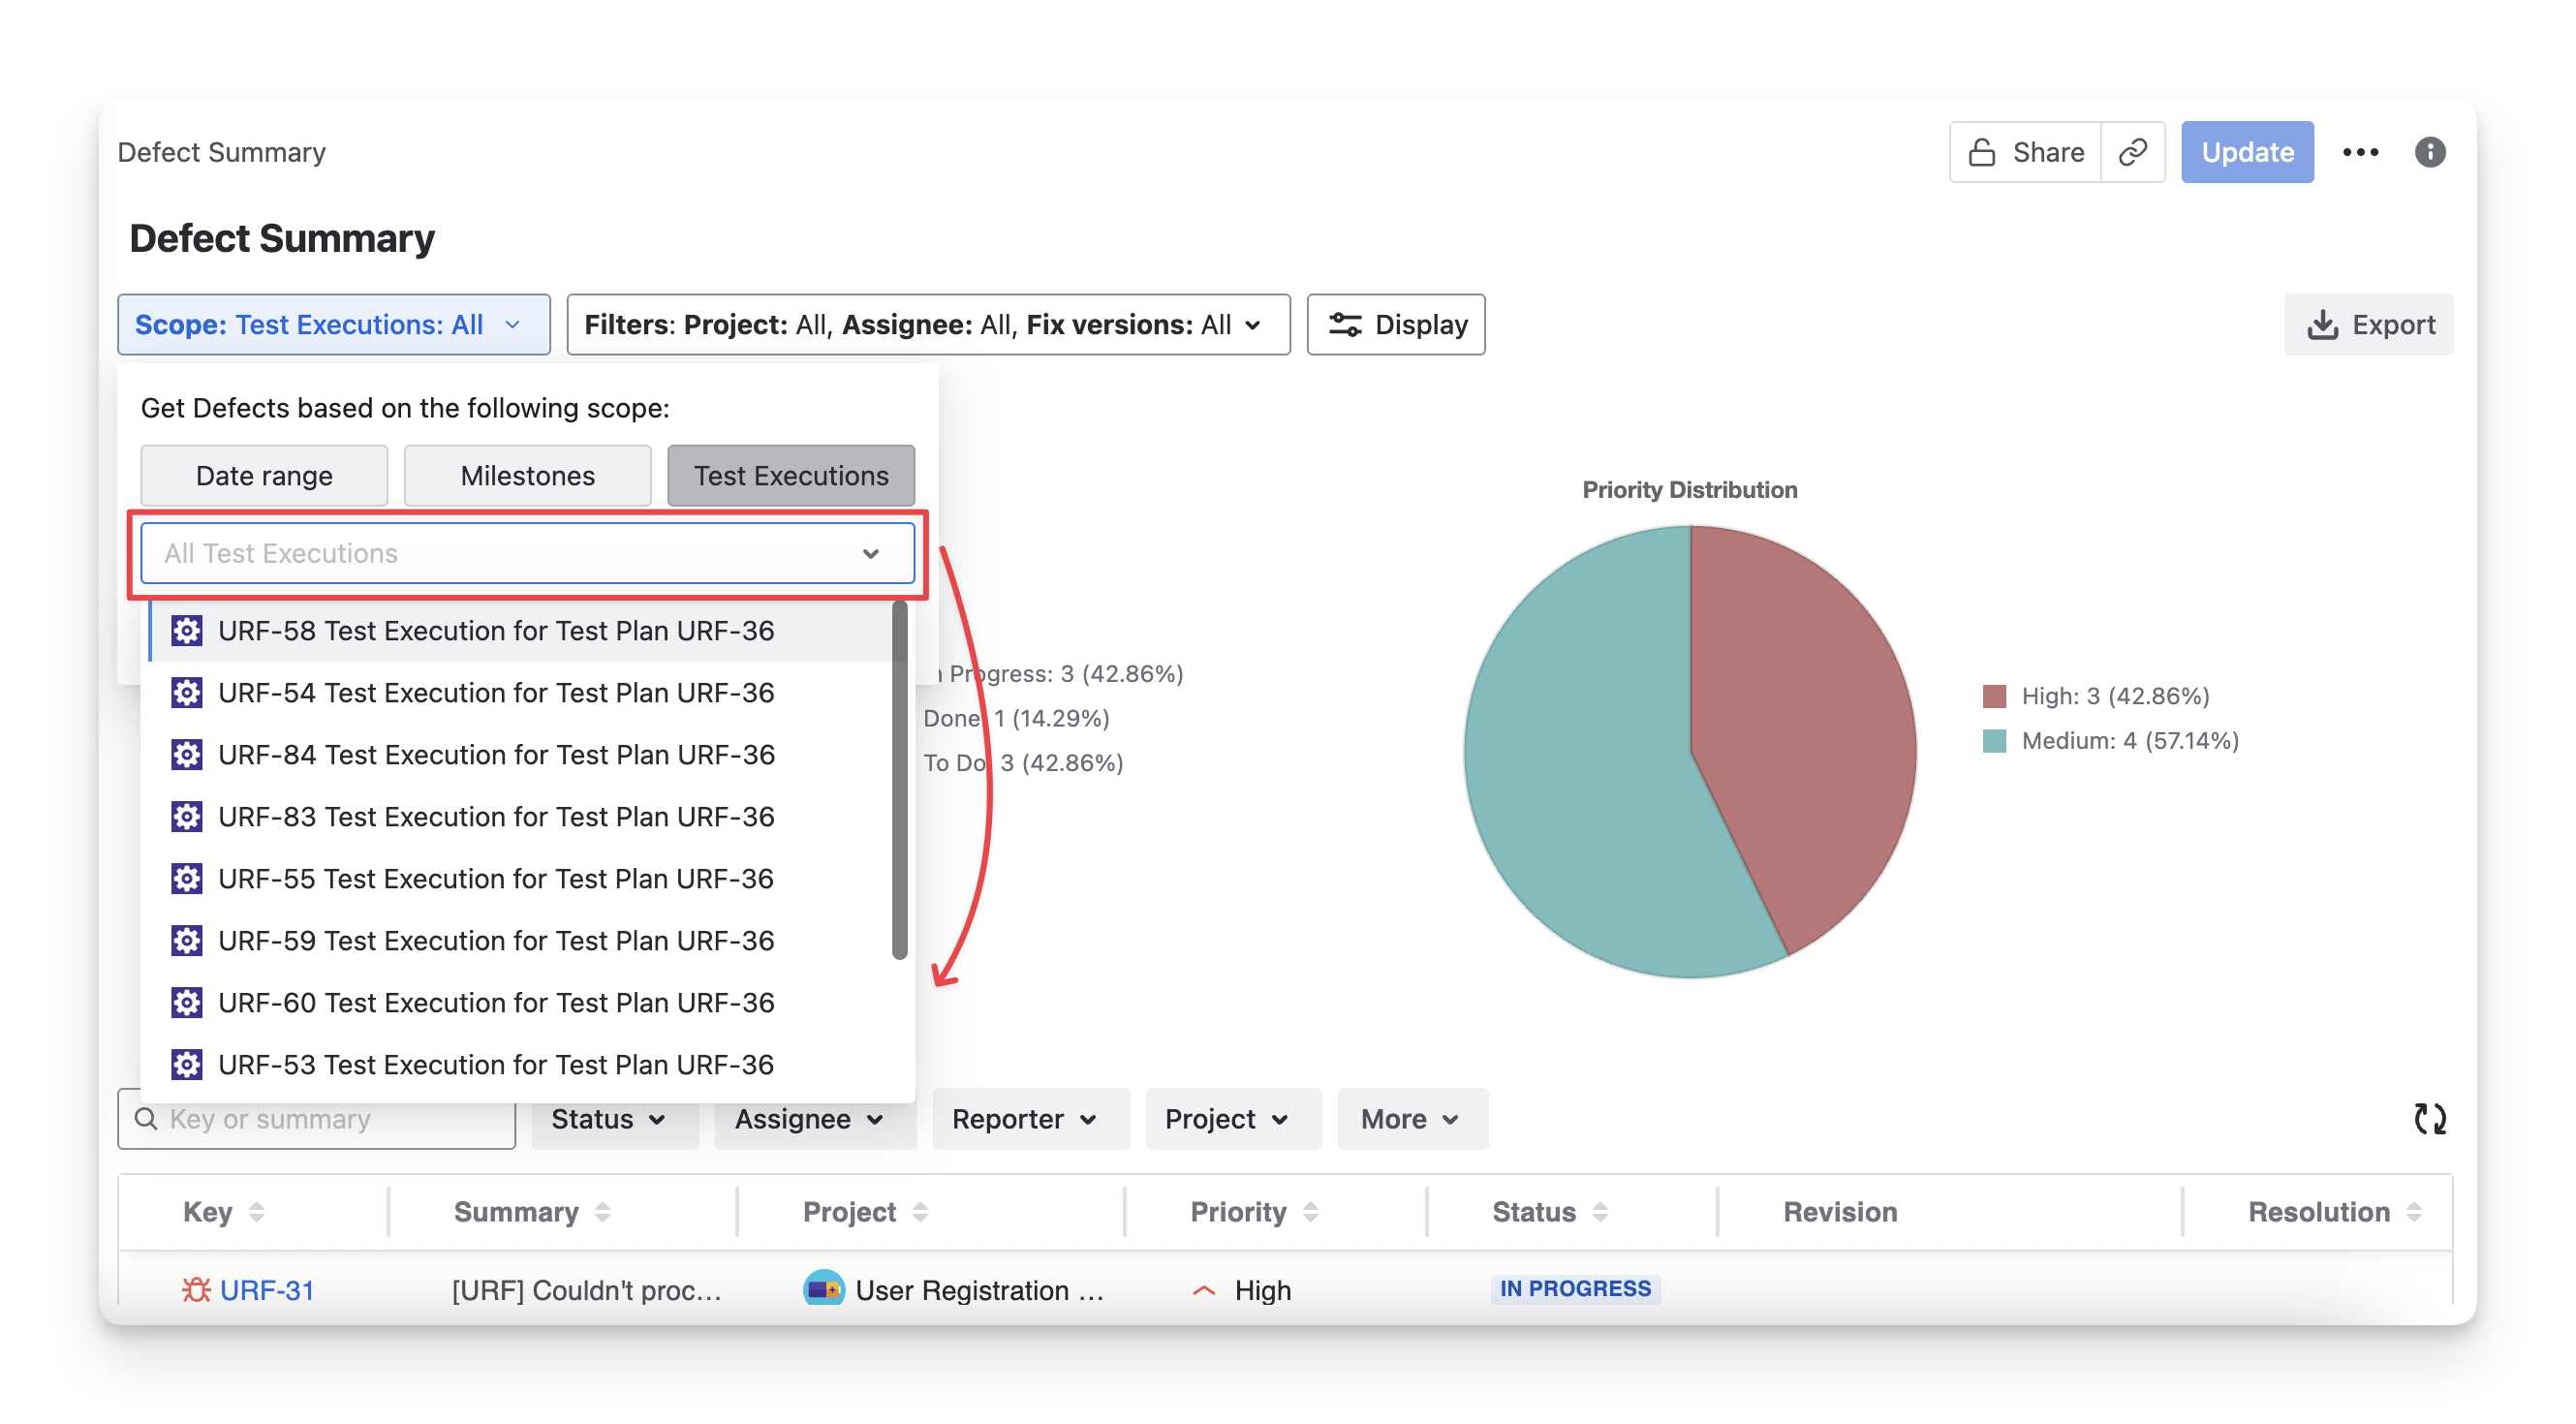
-
Test Executions: select some specific test executions. The report will show all defects for those execution sessions.
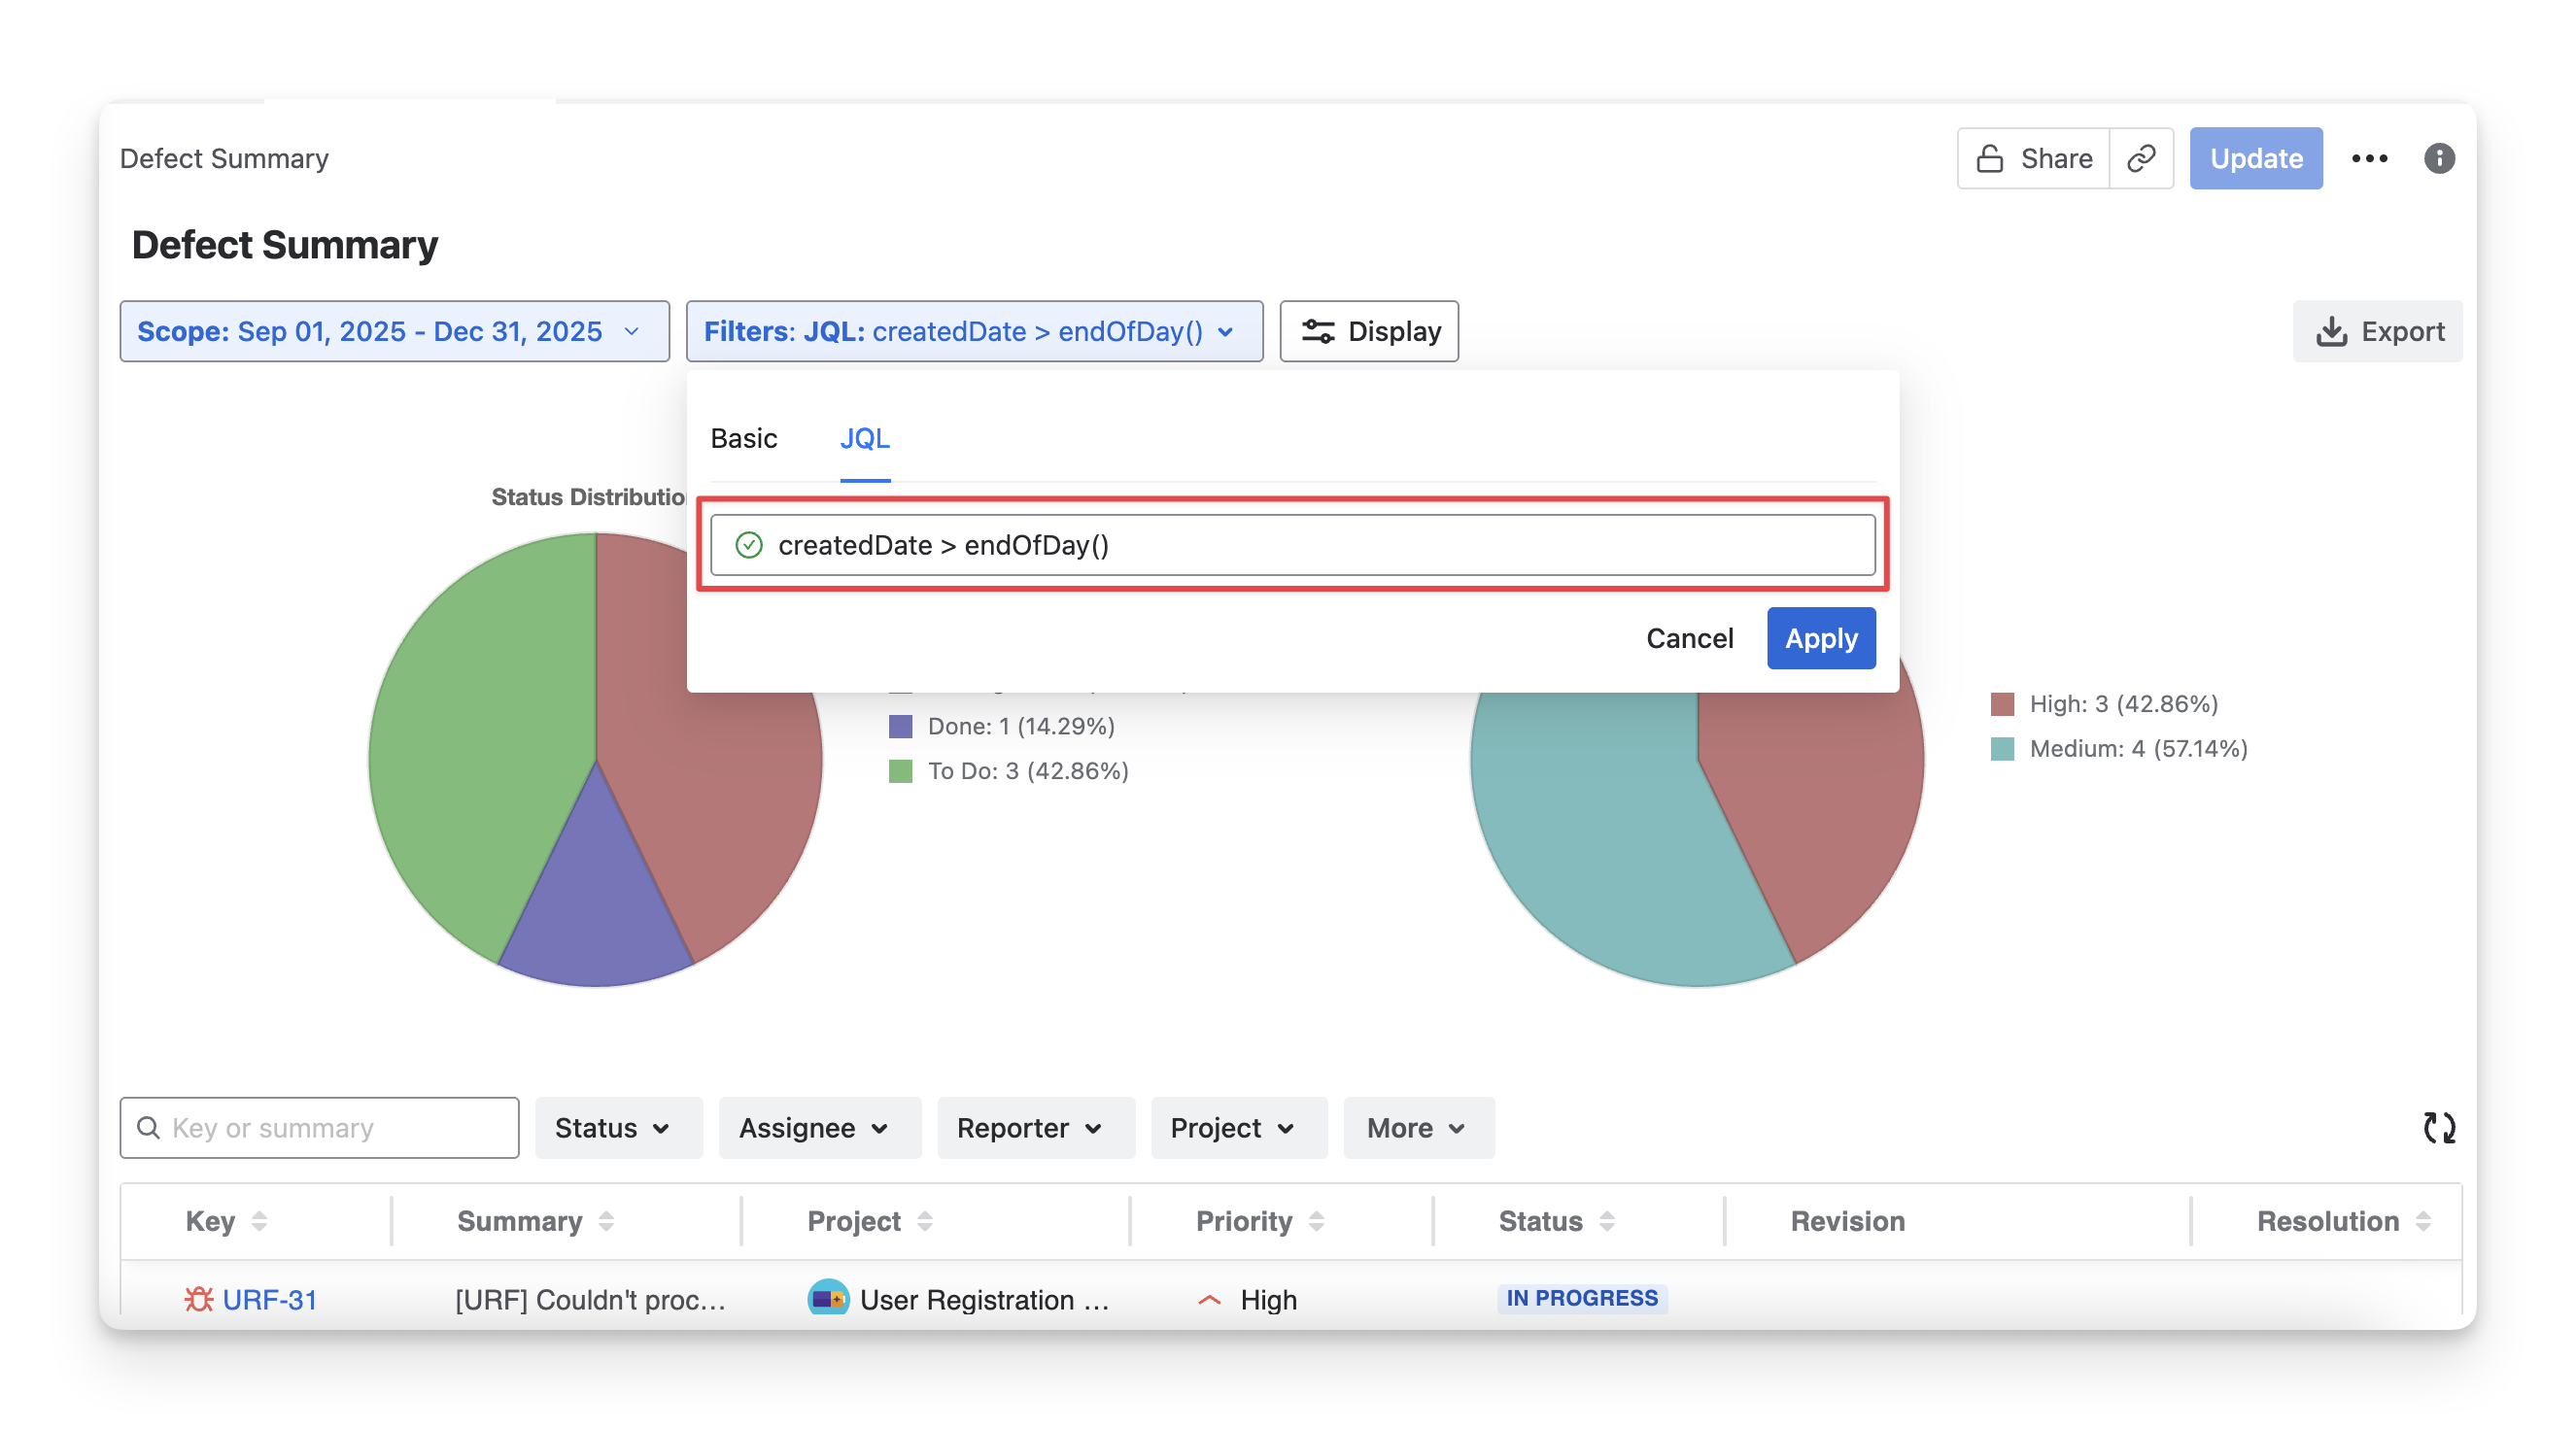
1.3 Filters
You can apply the filters to display some specific defects that meet certain conditions.
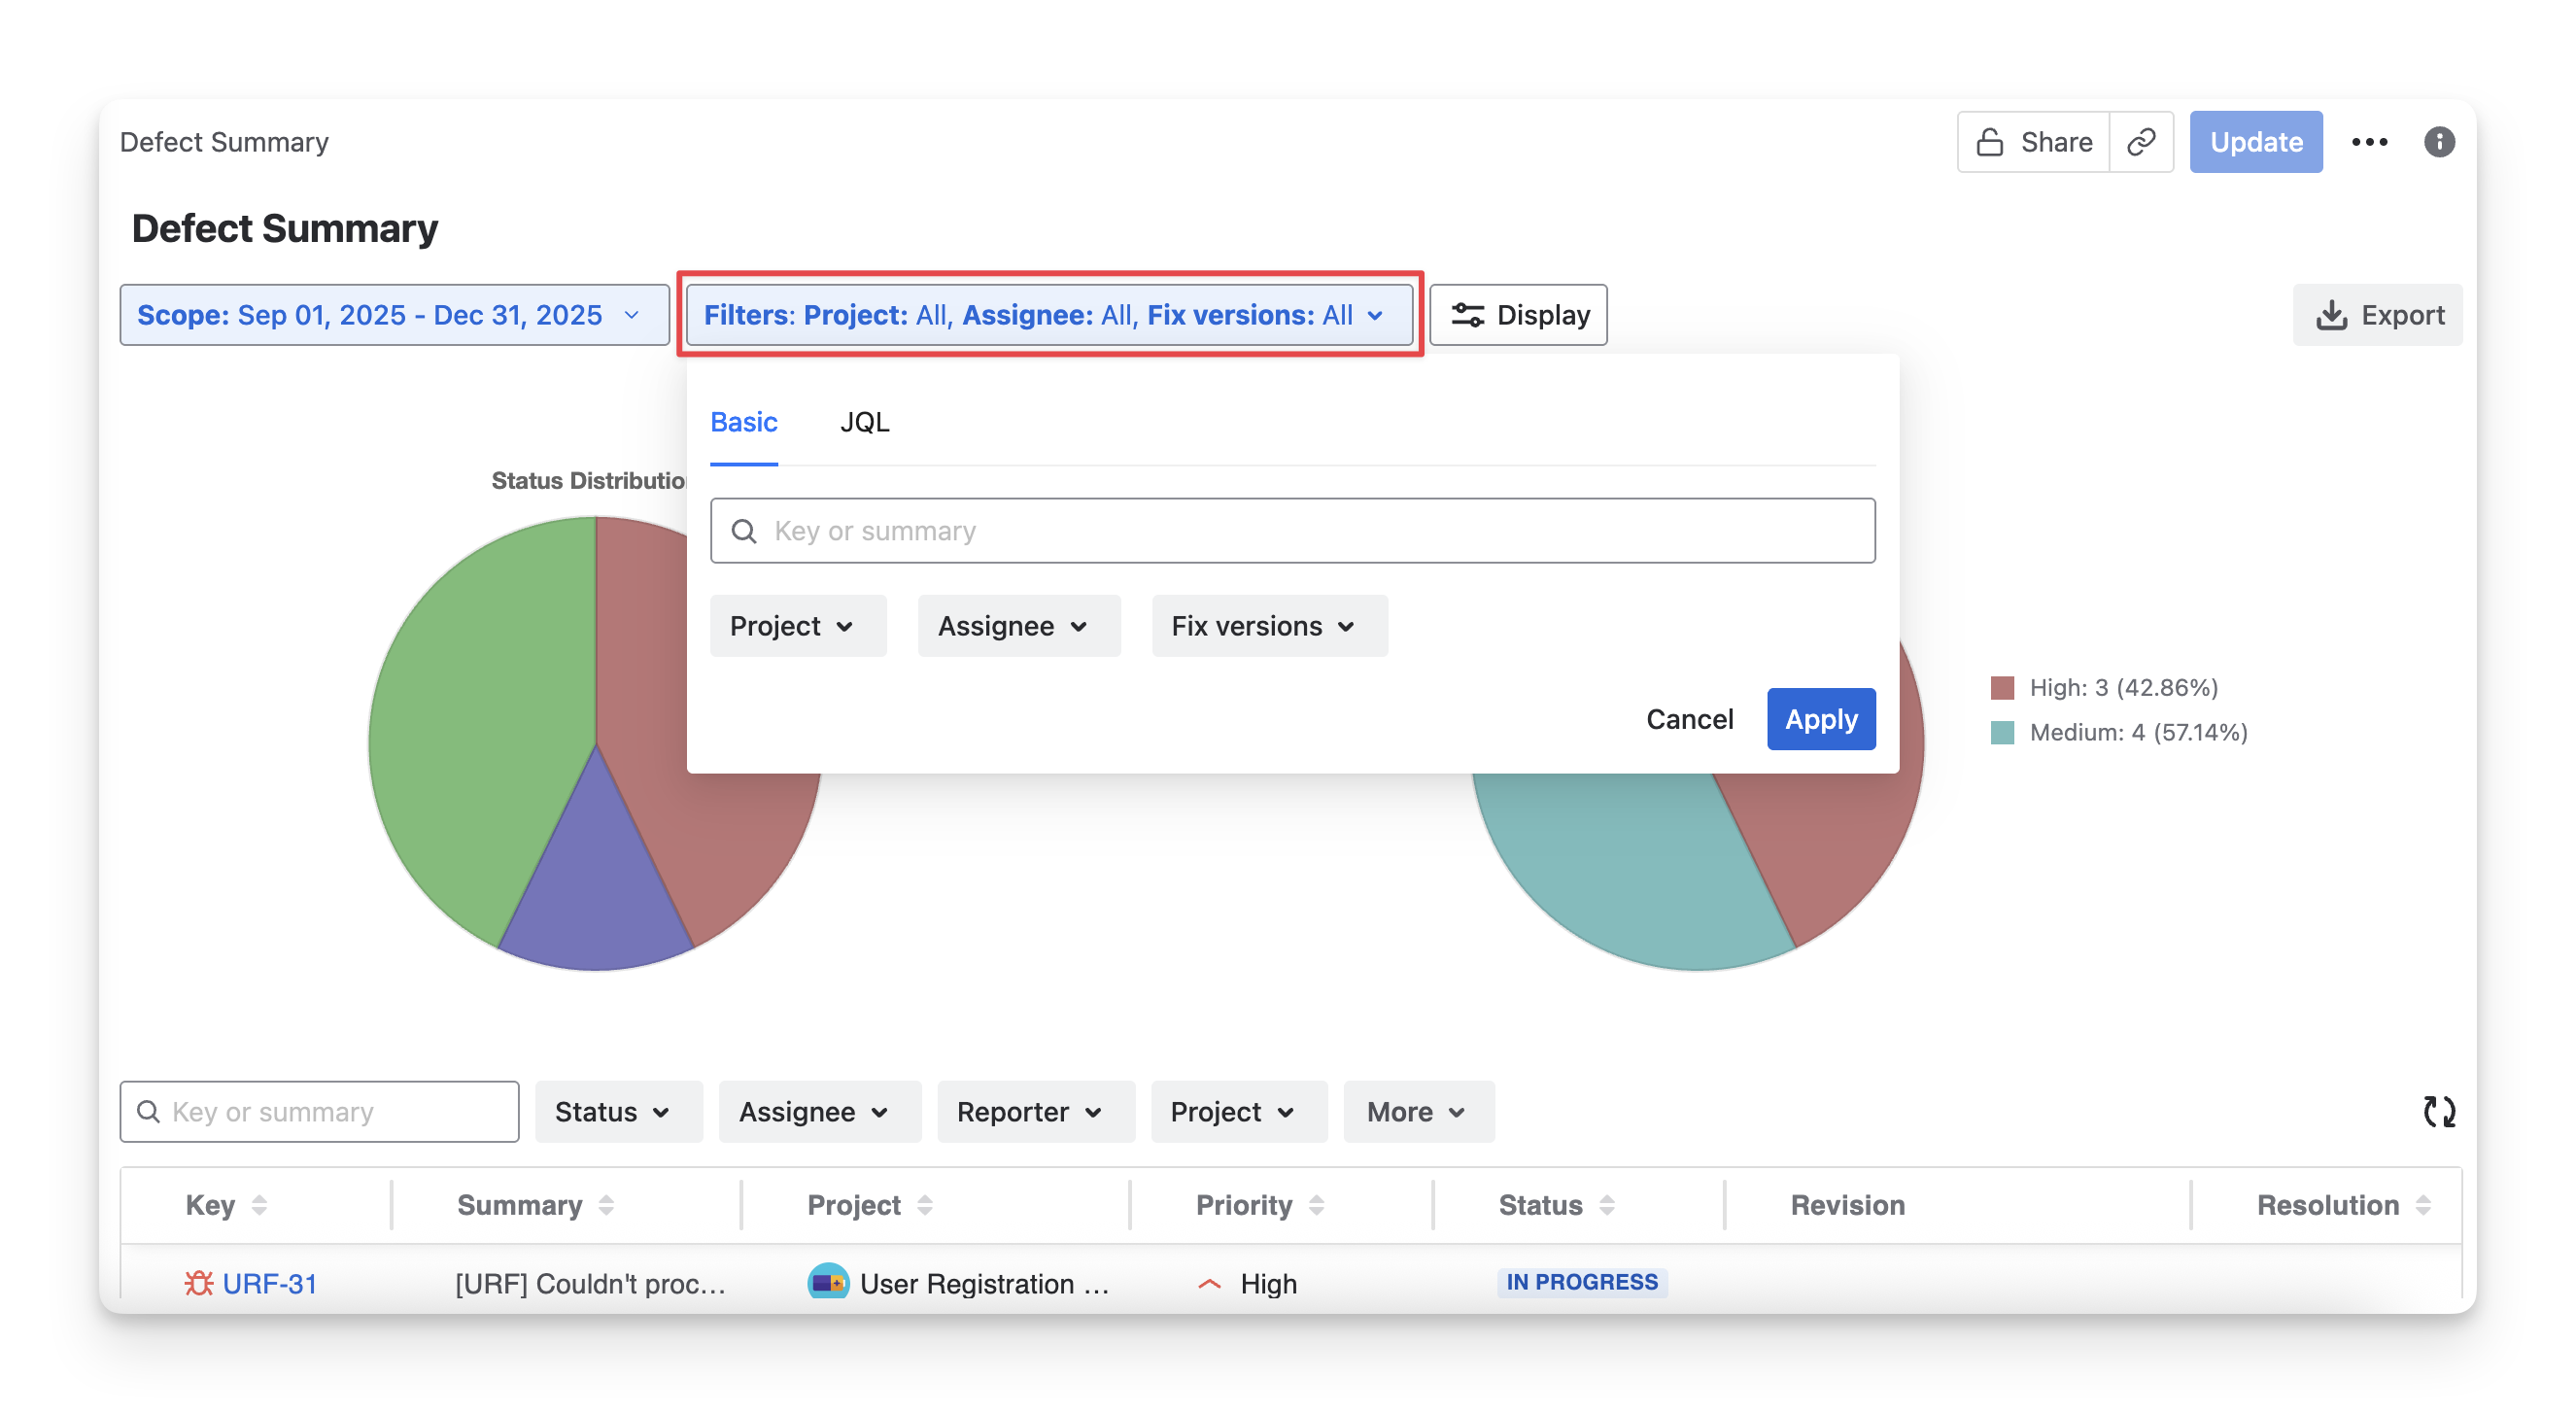
AgileTest supports you to filter by:
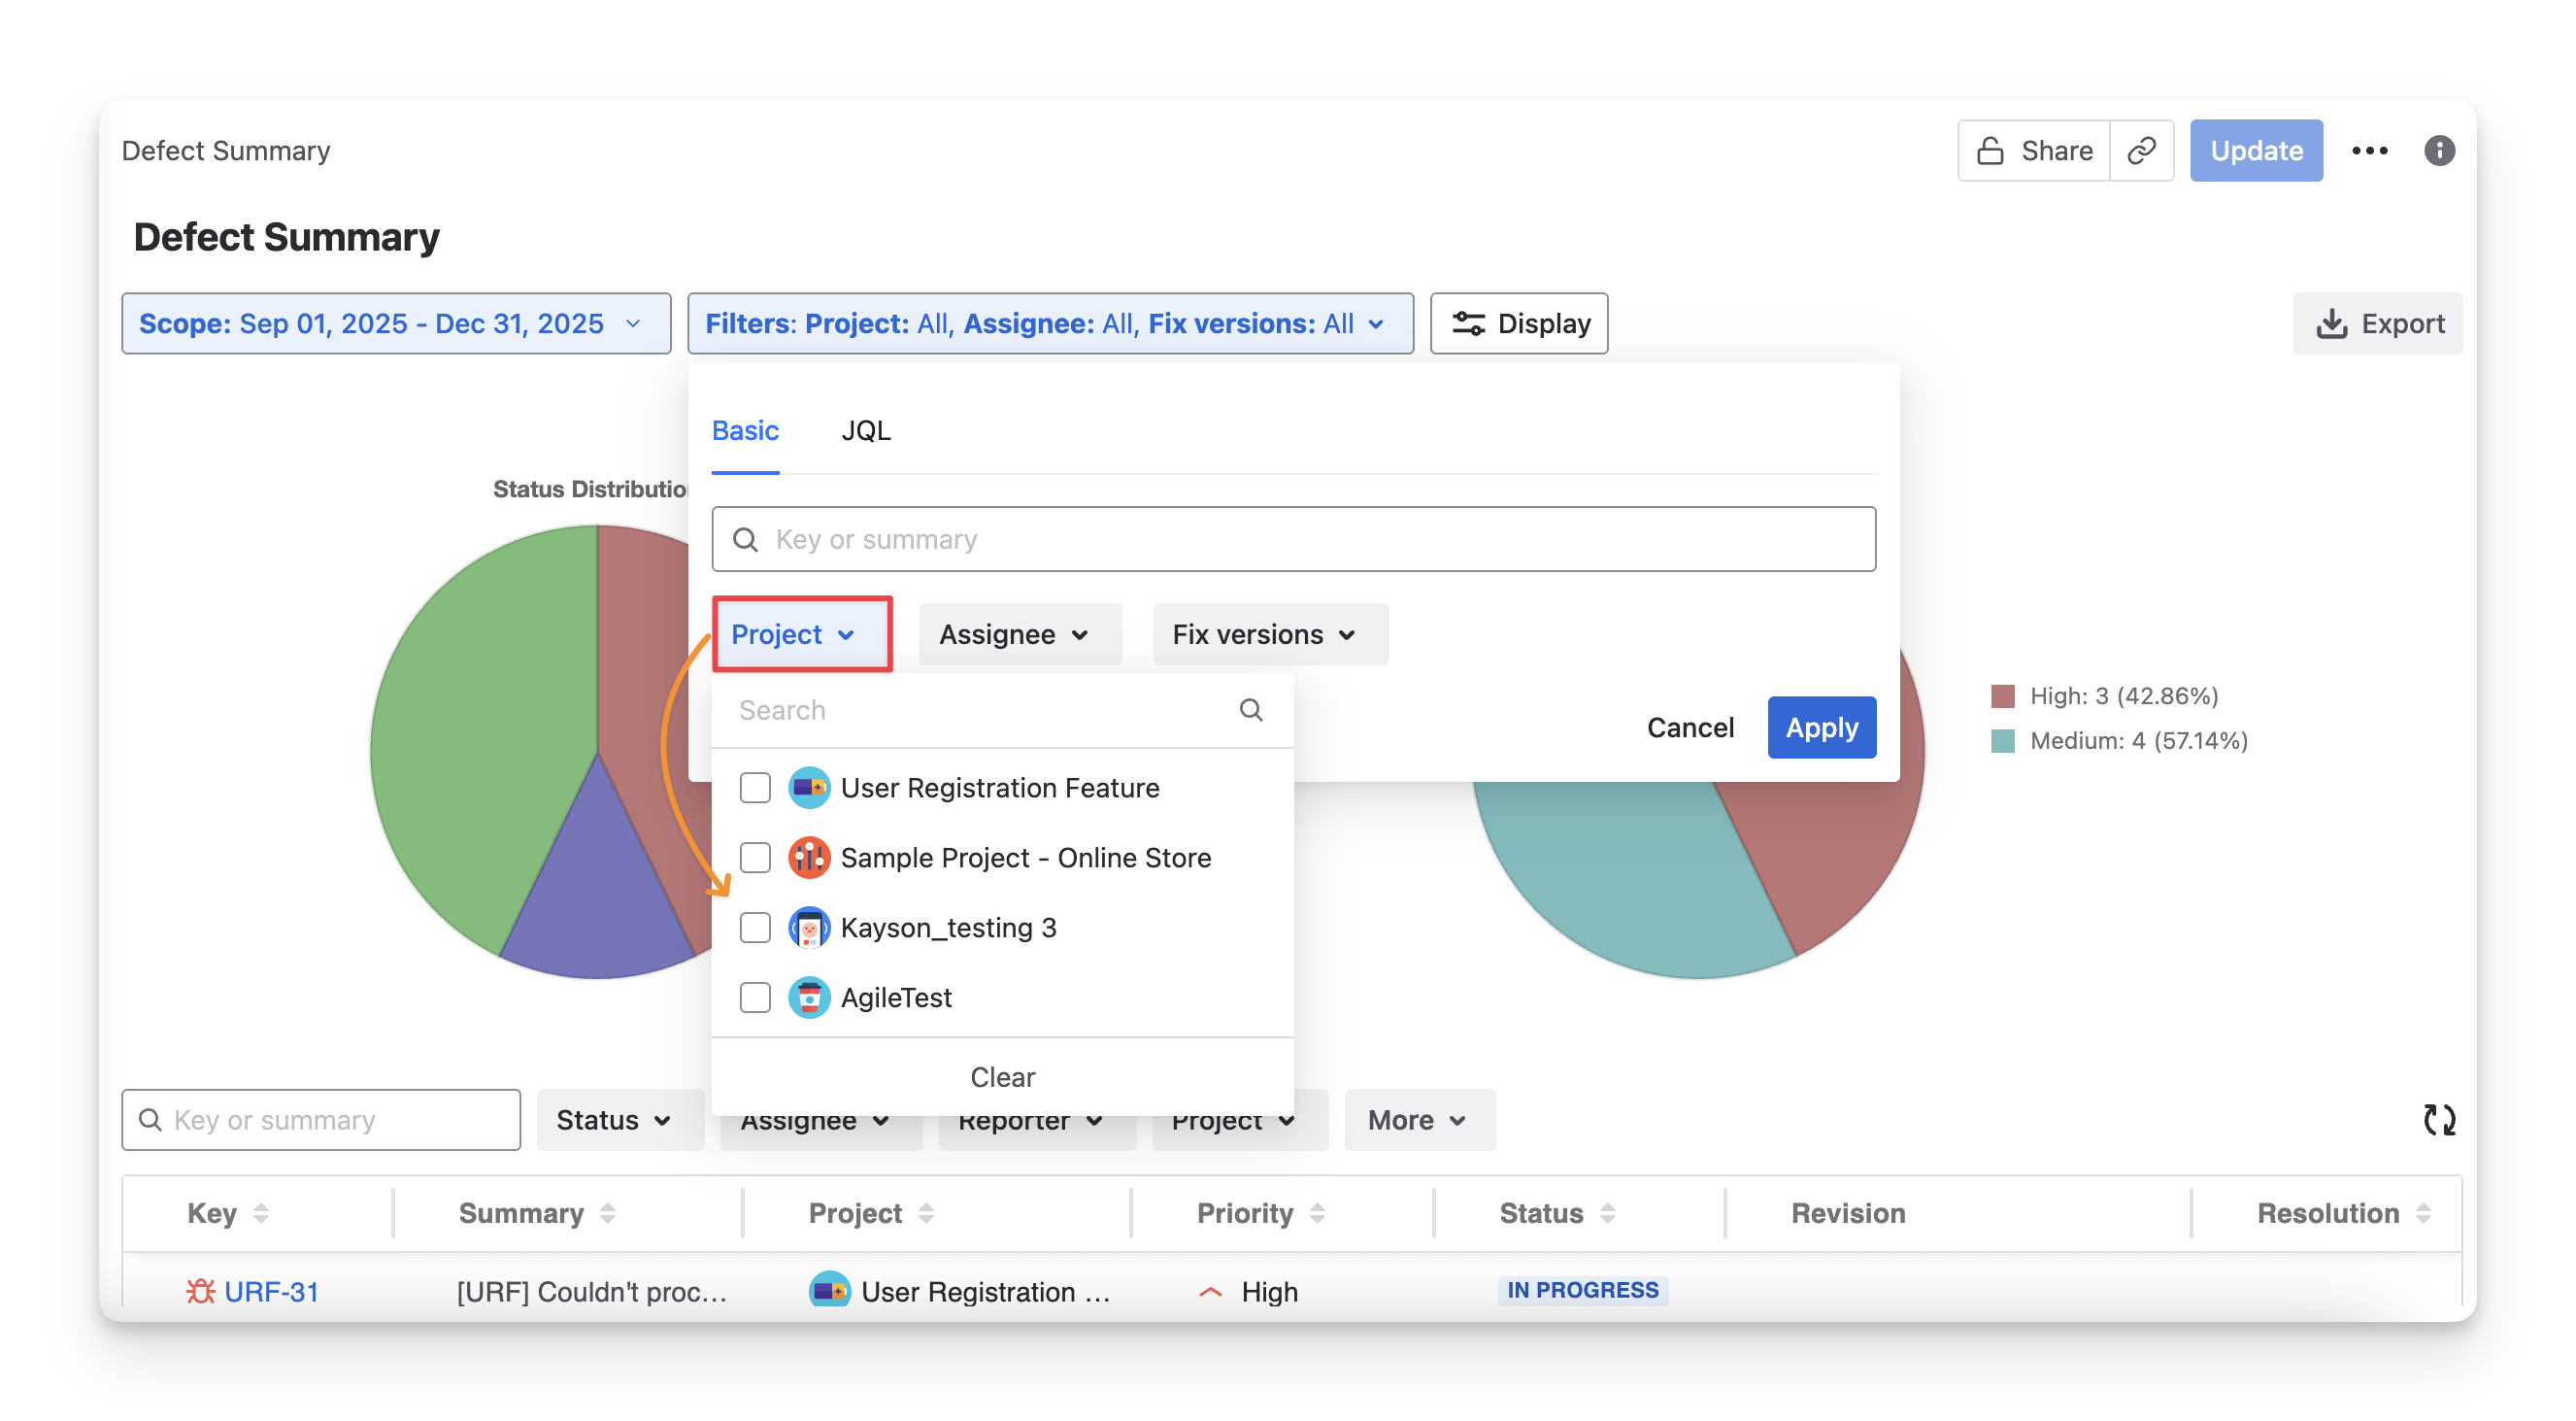
-
Project: Select the project whose defects should be included.
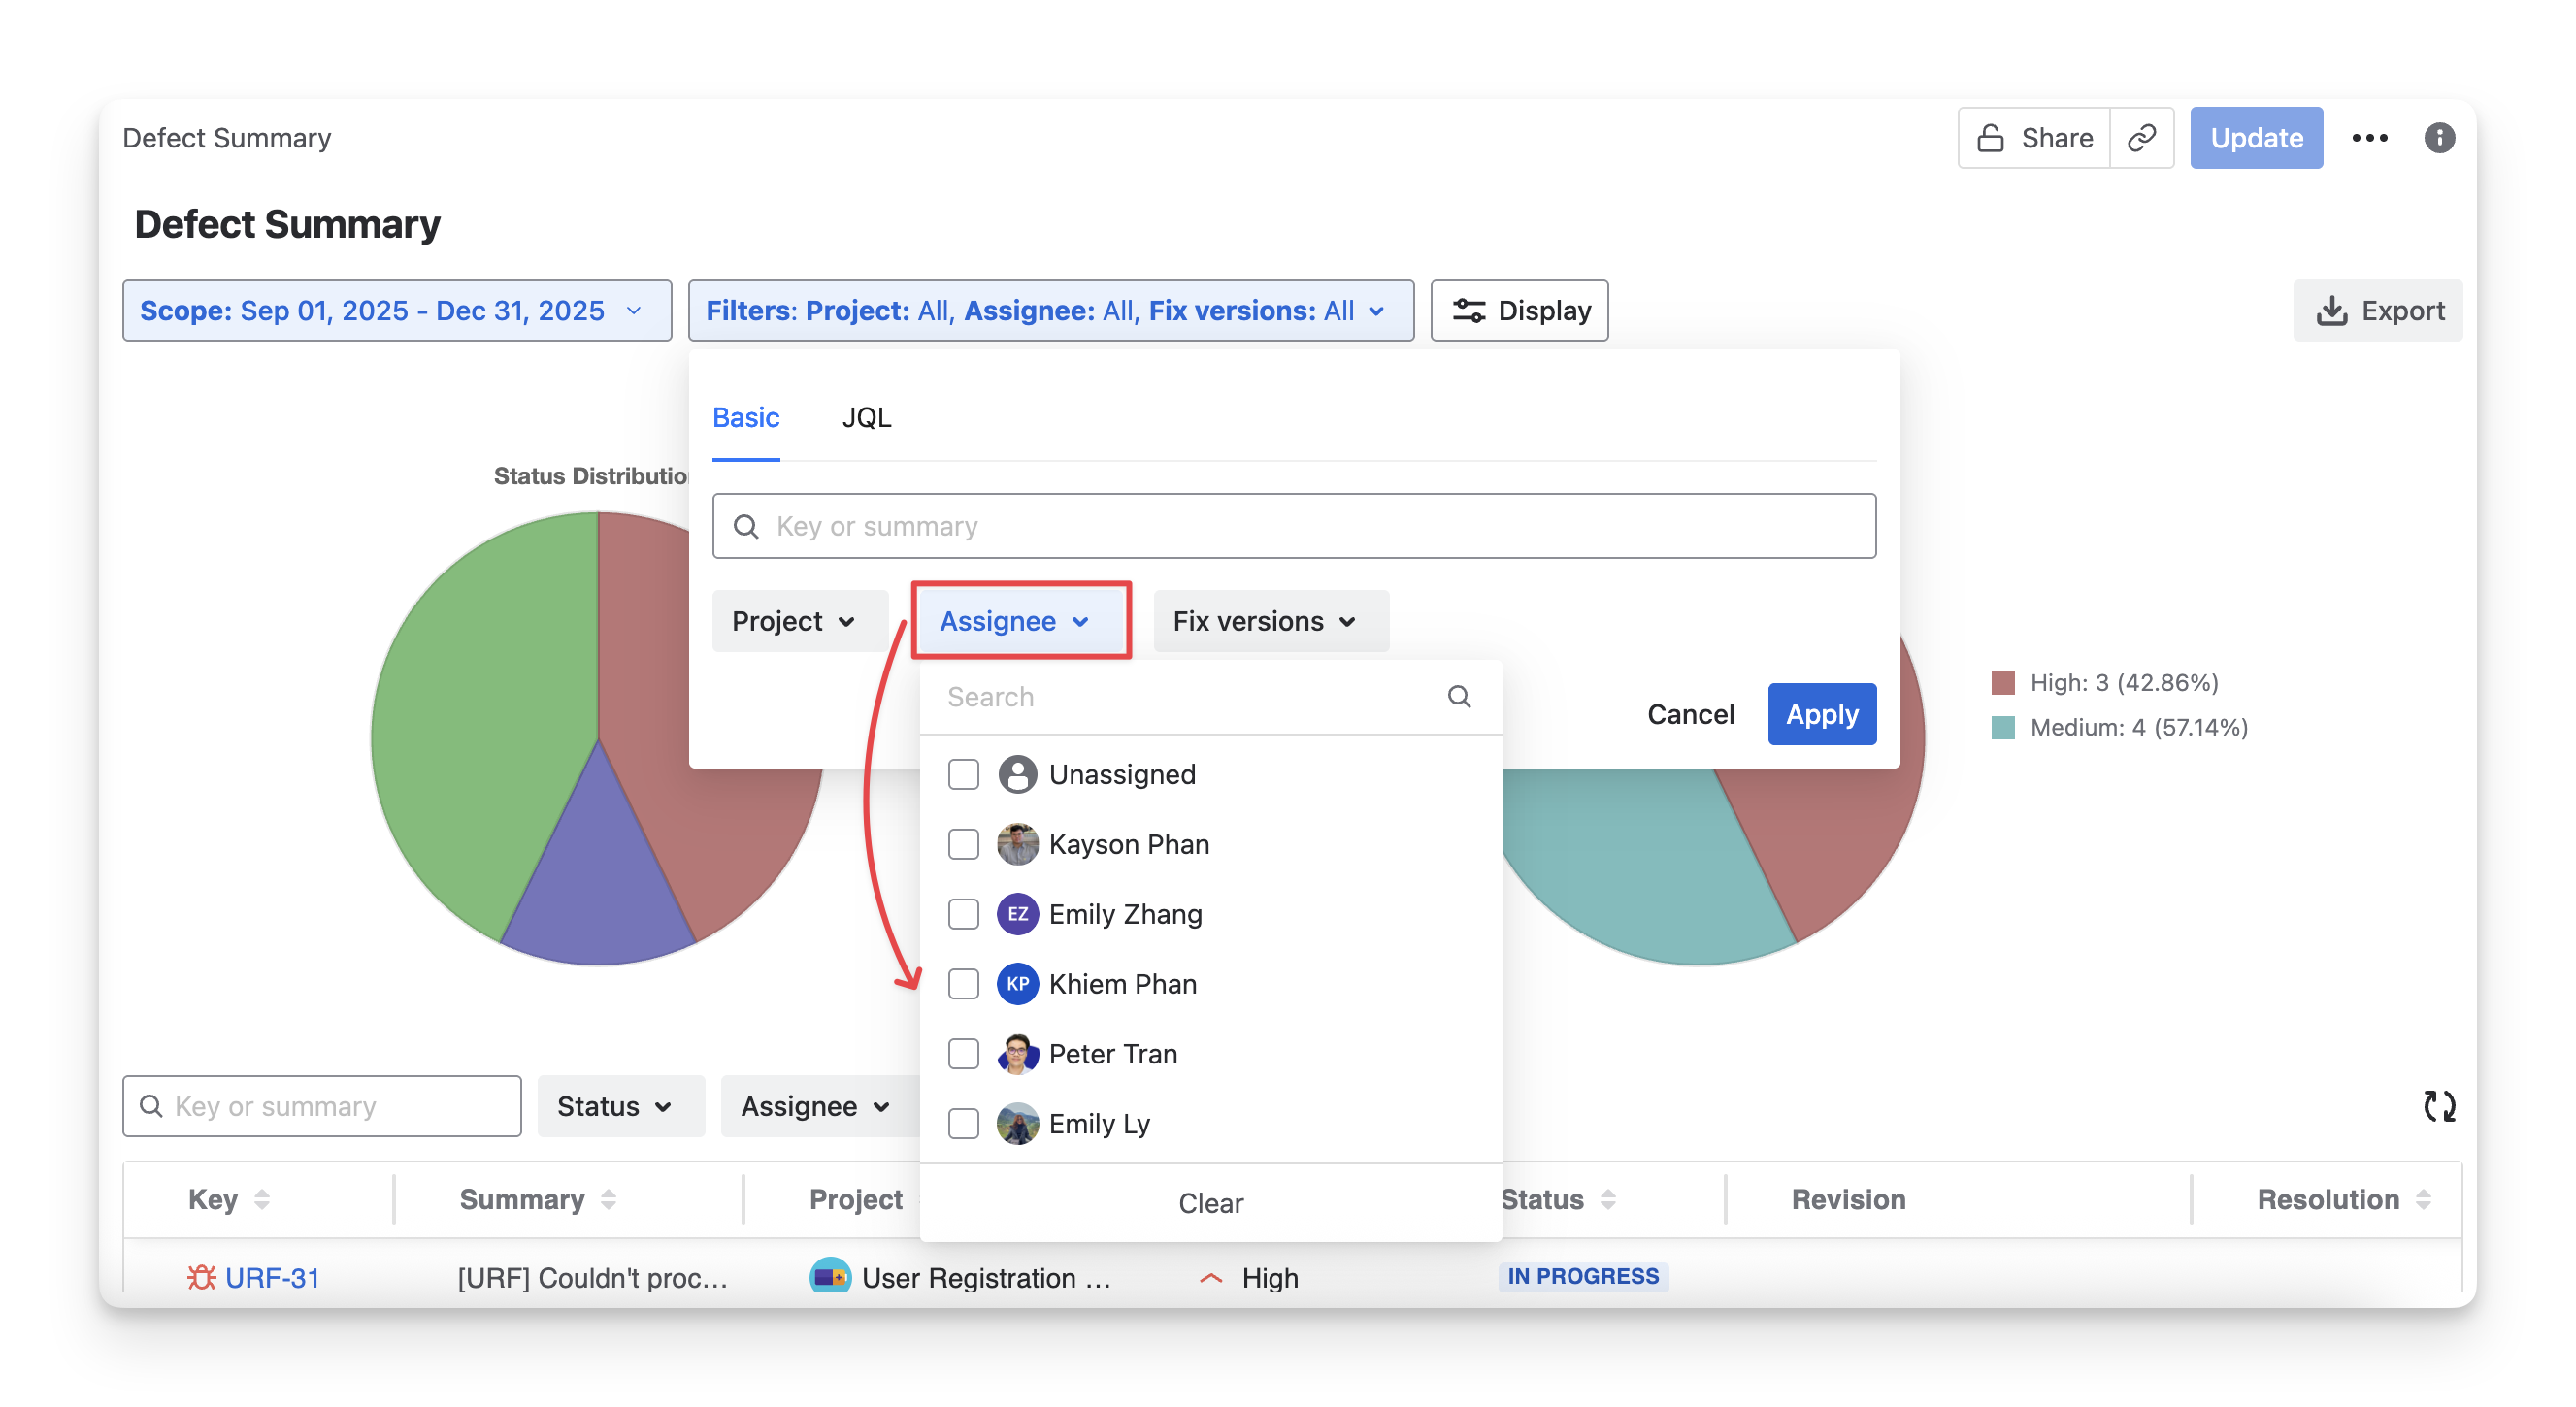
-
Assignee: Filter defects based on the assignee.
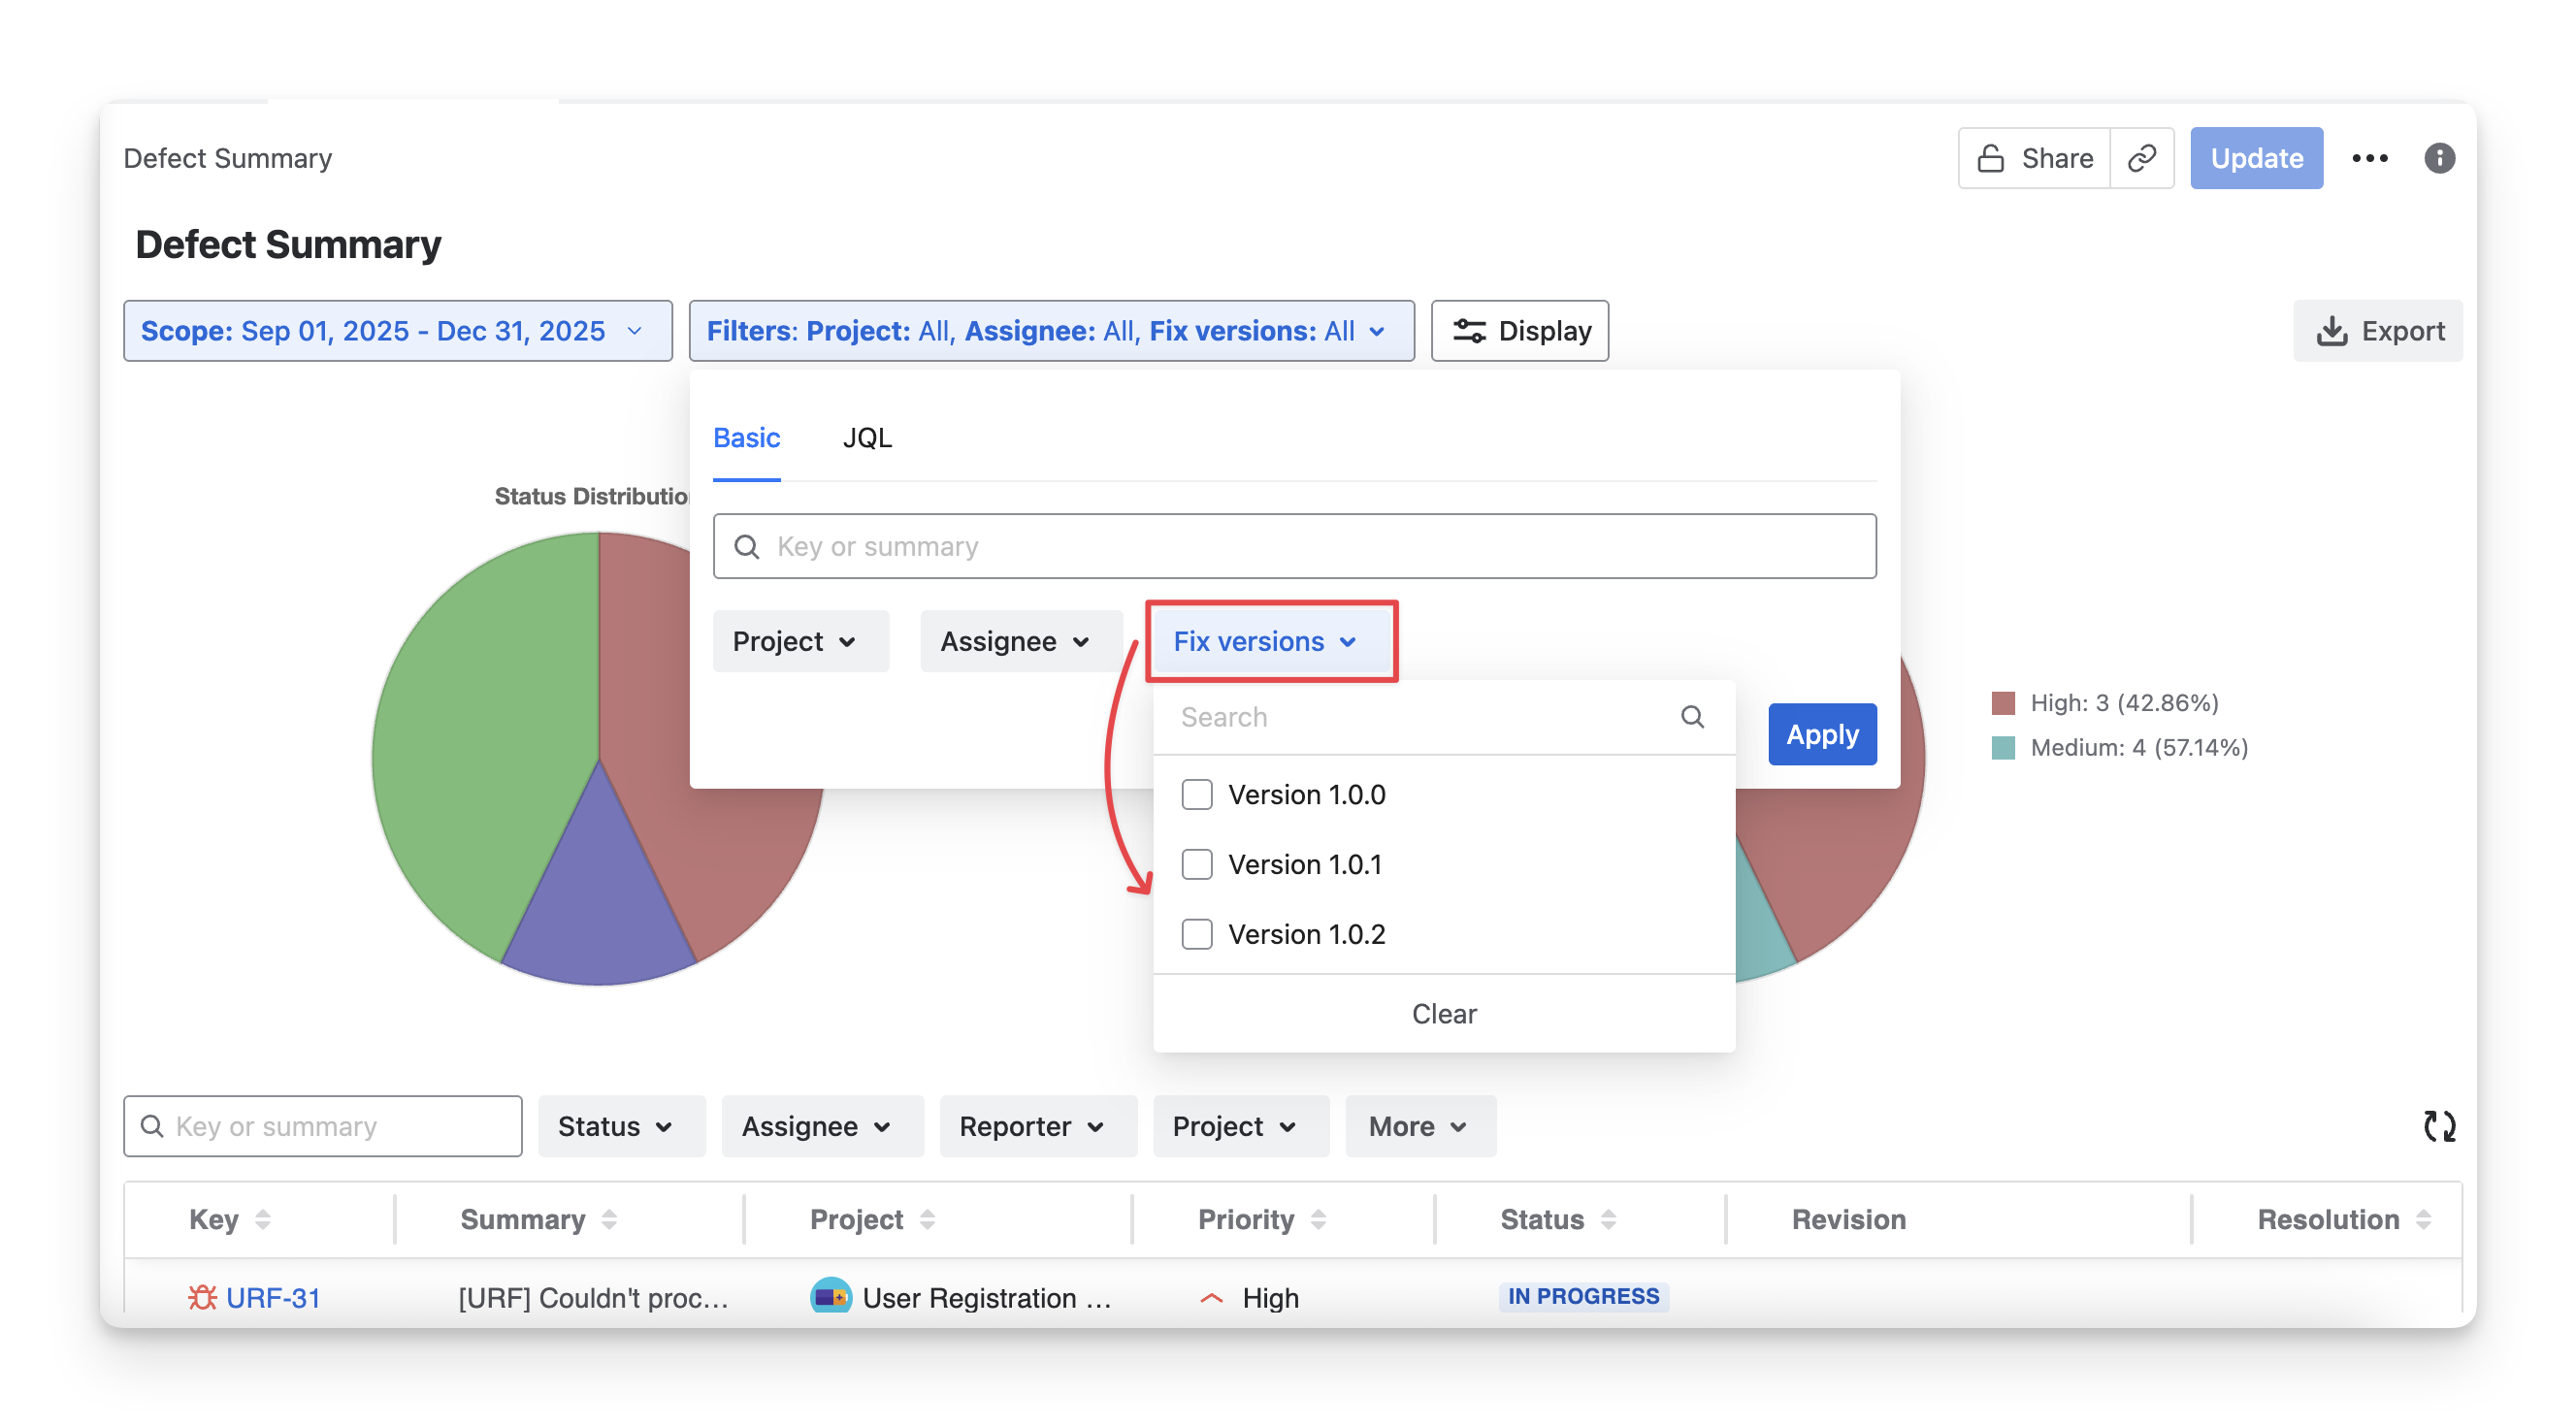
-
Fix versions: Filter defects with those associated with specific Jira fix versions.
-
Or switch to JQL and enter your custom search.
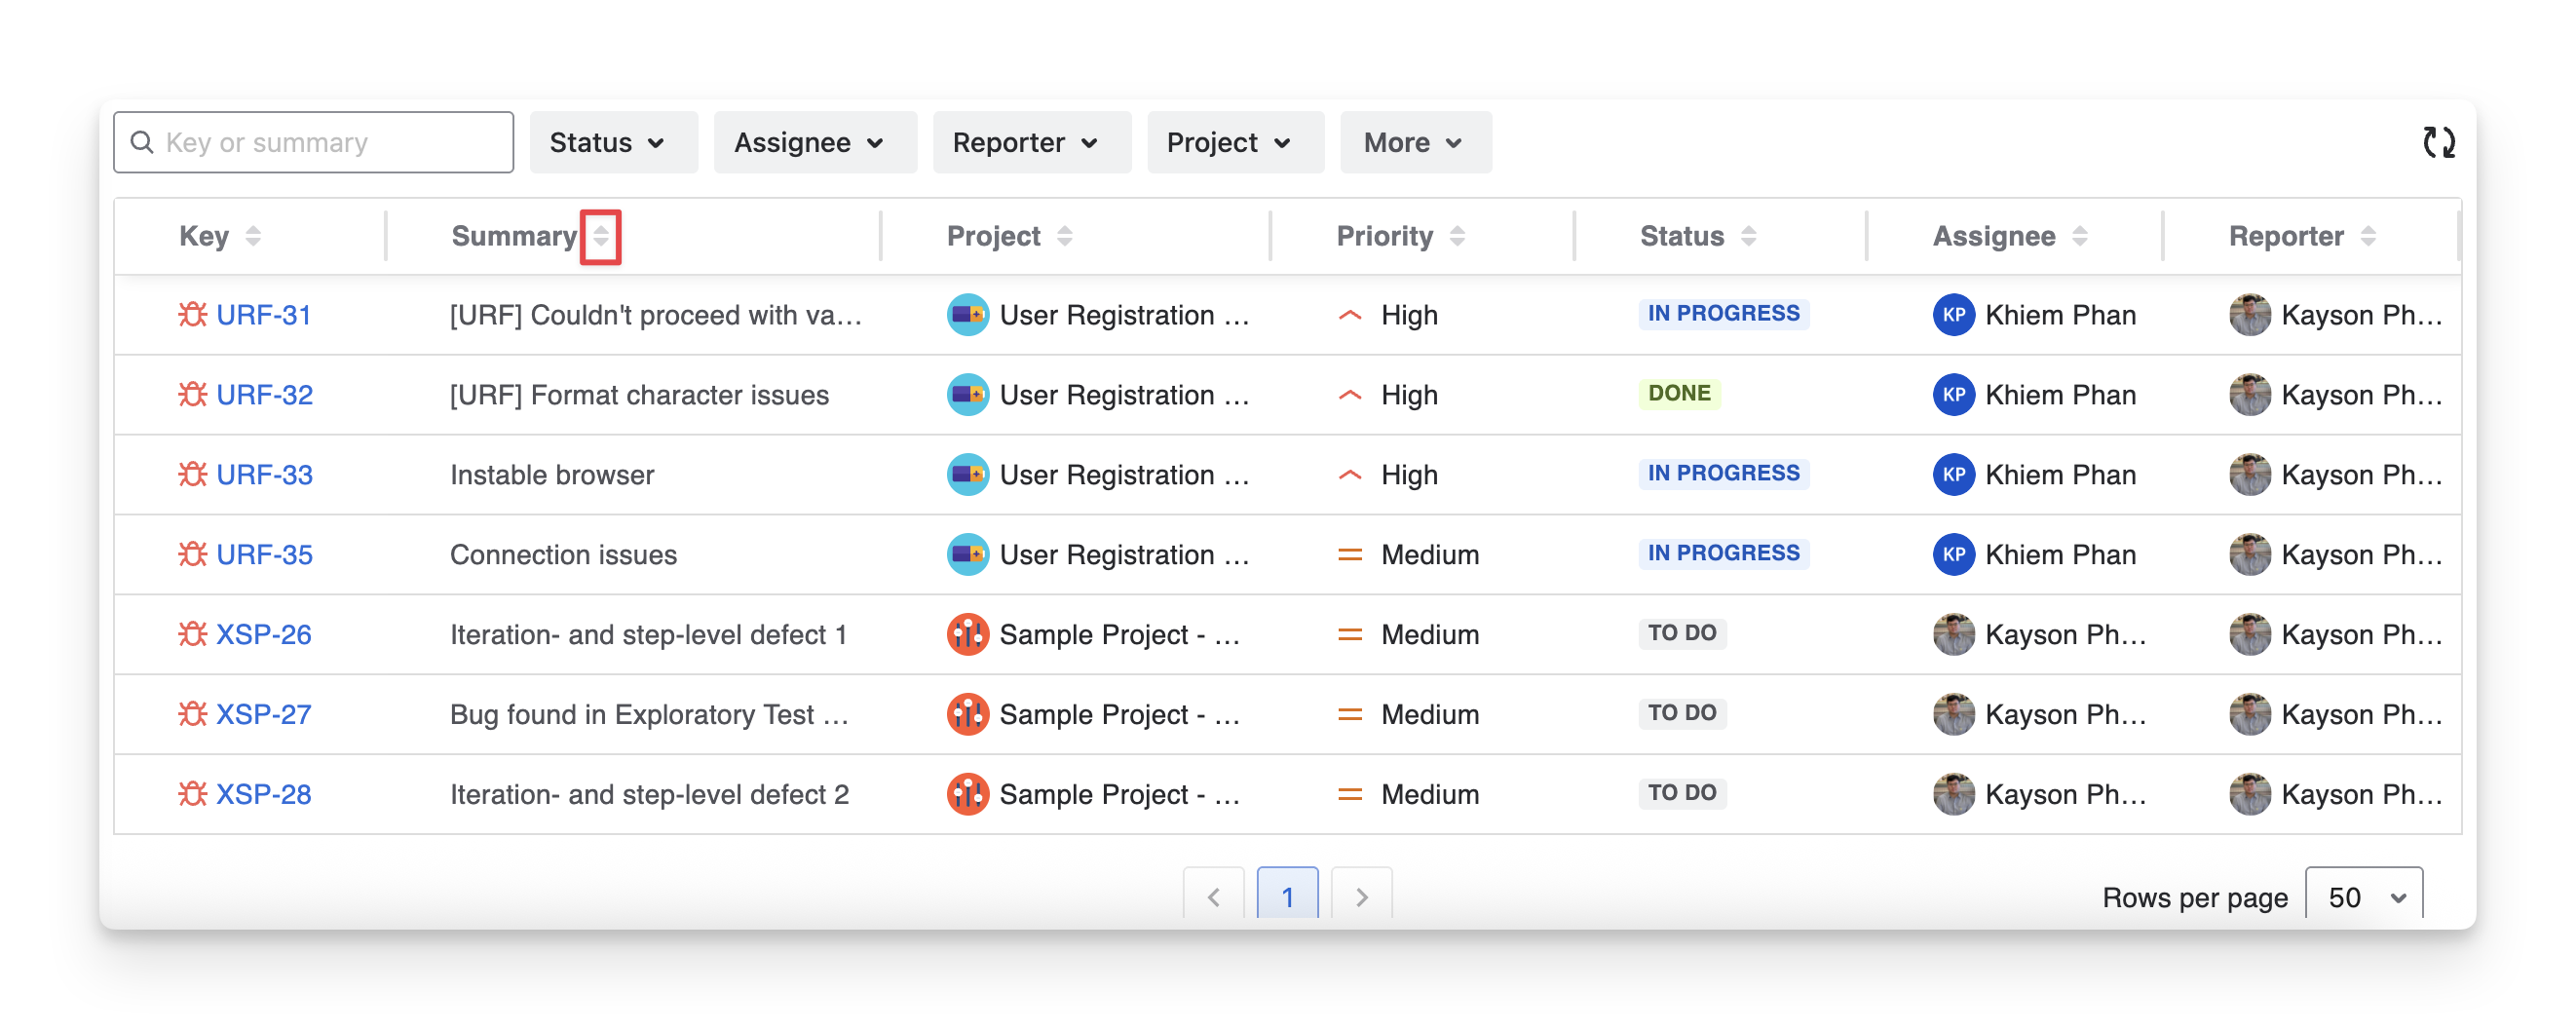
2. Defects Table
The Defects Table provides a detailed, list-based view of all defects included in the Defect Summary Report. Each row represents a defect work item and displays key information to help teams track, analyze, and manage defects.
In the Defects table, you can see a list of defects with key data:
|
Information |
Description |
|
Key |
The Jira unique identifier for each defect. This helps you quickly locate, reference, and track a specific issue |
|
Project |
The project that the defect belongs to helps you understand where issues are concentrated |
|
Priority |
The importantance the defect is that you can focus on what needs attention first. |
|
Status |
The Jira current stage of the defect ( todo in progress done ), giving you an overview of progress. |
|
Revision |
The version, build, or revision in which the defect was found or fixed is useful for release tracking and traceability. |
|
Resolution |
The reason for the defect is moved to done ( won't fix duplicated fixed can't reproduced ) |
|
Assignee |
The member who is responsible for working on the defect helps you see ownership and workload distribution. |
|
Reporter |
The member who created or logged the defect lets you trace the origin and context of the issue. |
2.1 Display Defect Table Information
You can Show/Hide the column in the report table by
-
Click on the Display button.
-
Select/deselect any options to show/hide these columns in the Defects Table.
2.2 Rearrange Defects Table Orders
To change the display order of columns, drag and drop each column to your preferred position.
2.3 Sort Defects Table
To sort any column and view the data in ascending or descending order, you can:
-
Choose the 🔼 to sort ascending.
-
Choose the 🔽 to sort descending.
2.4 Filter Test Coverage Table
To quickly identify a specific requirement in the list, you can:
-
Provide the Defect Key or Summary to find the exact requirement.
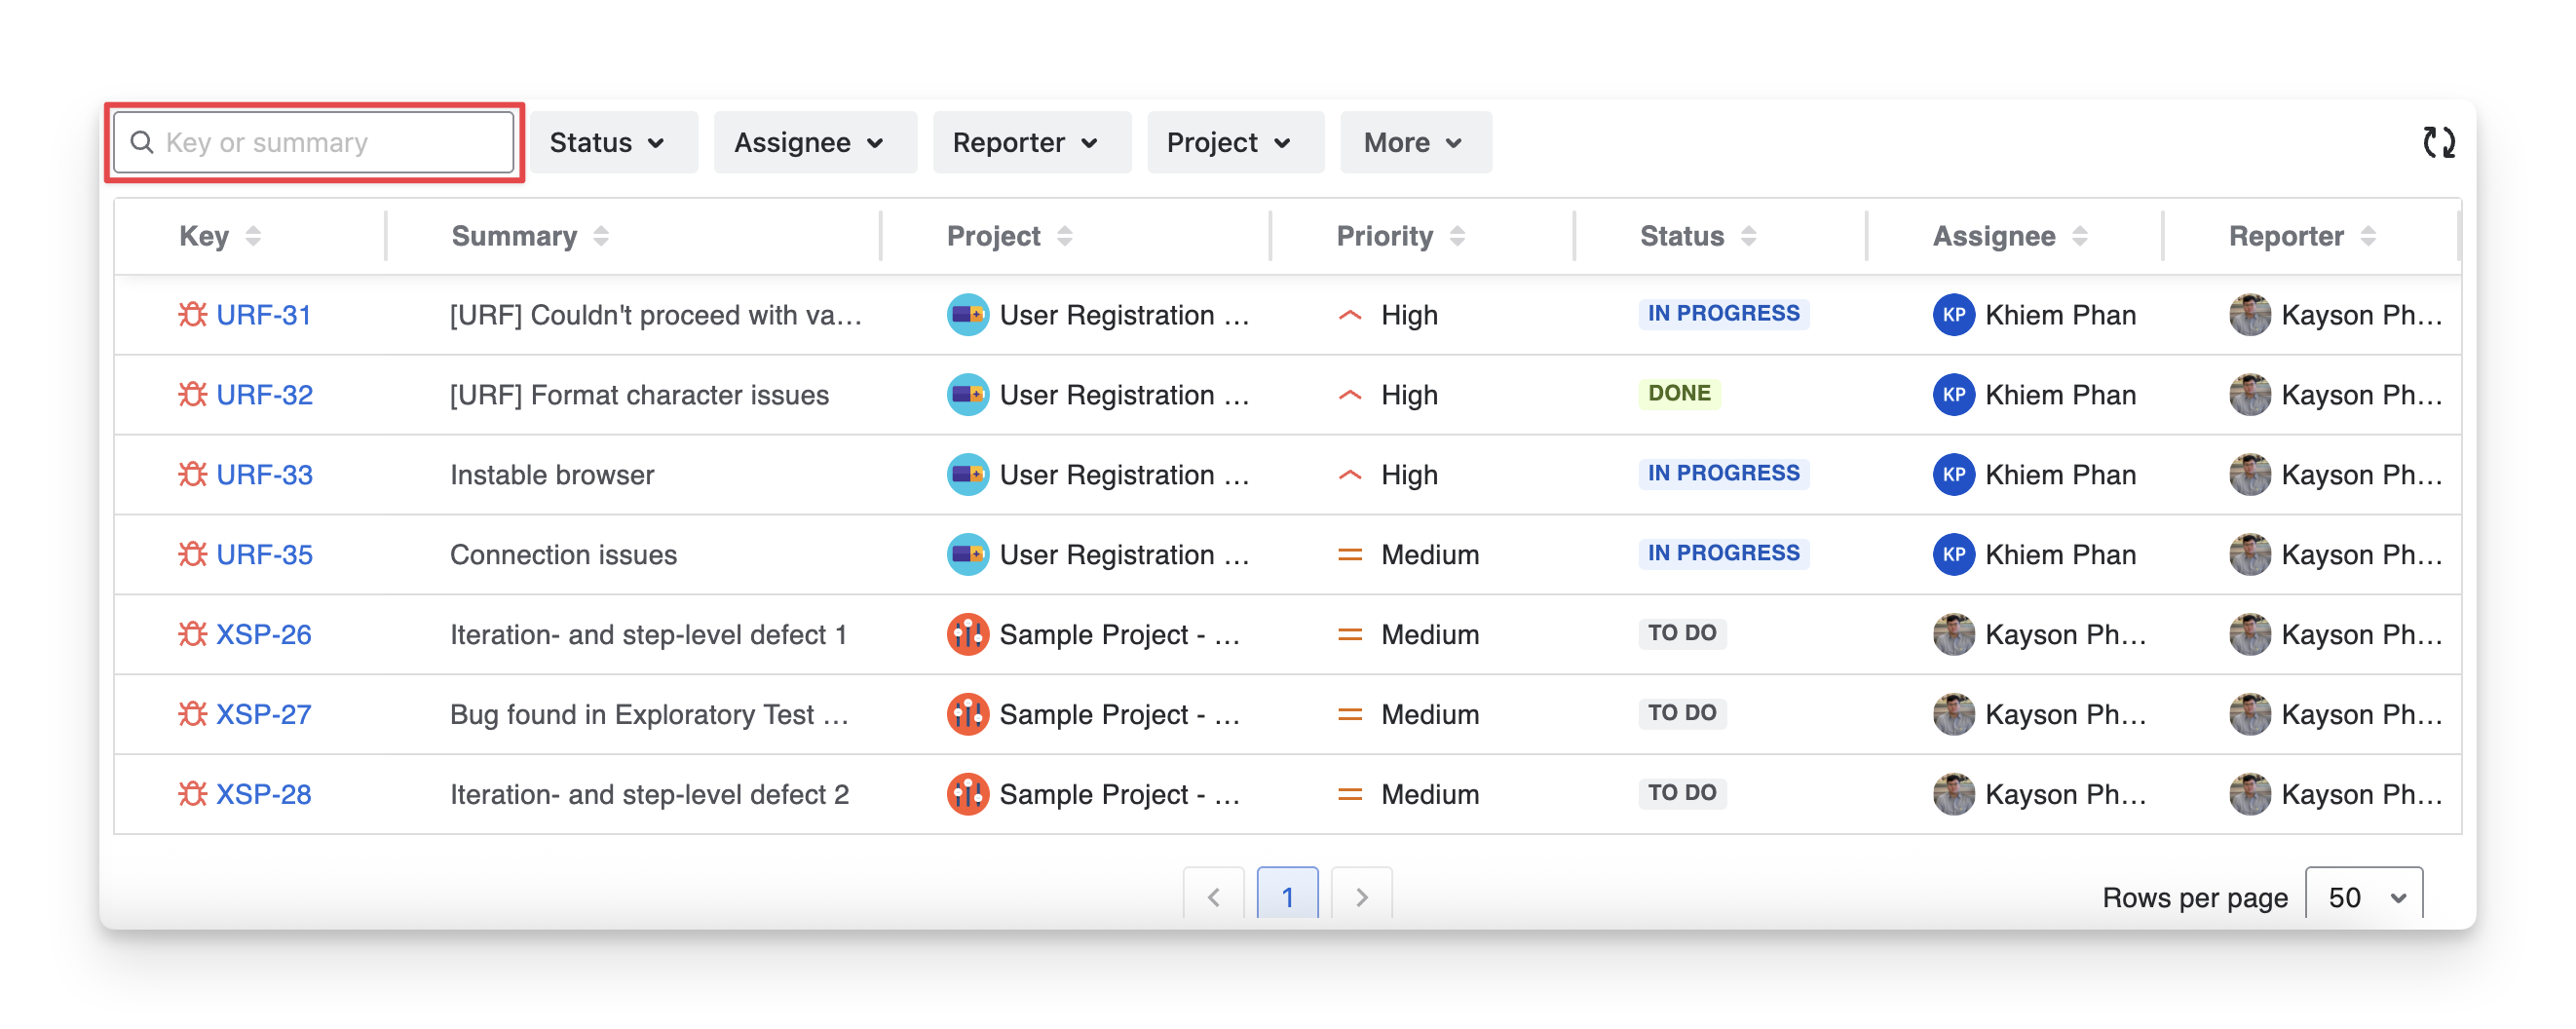
-
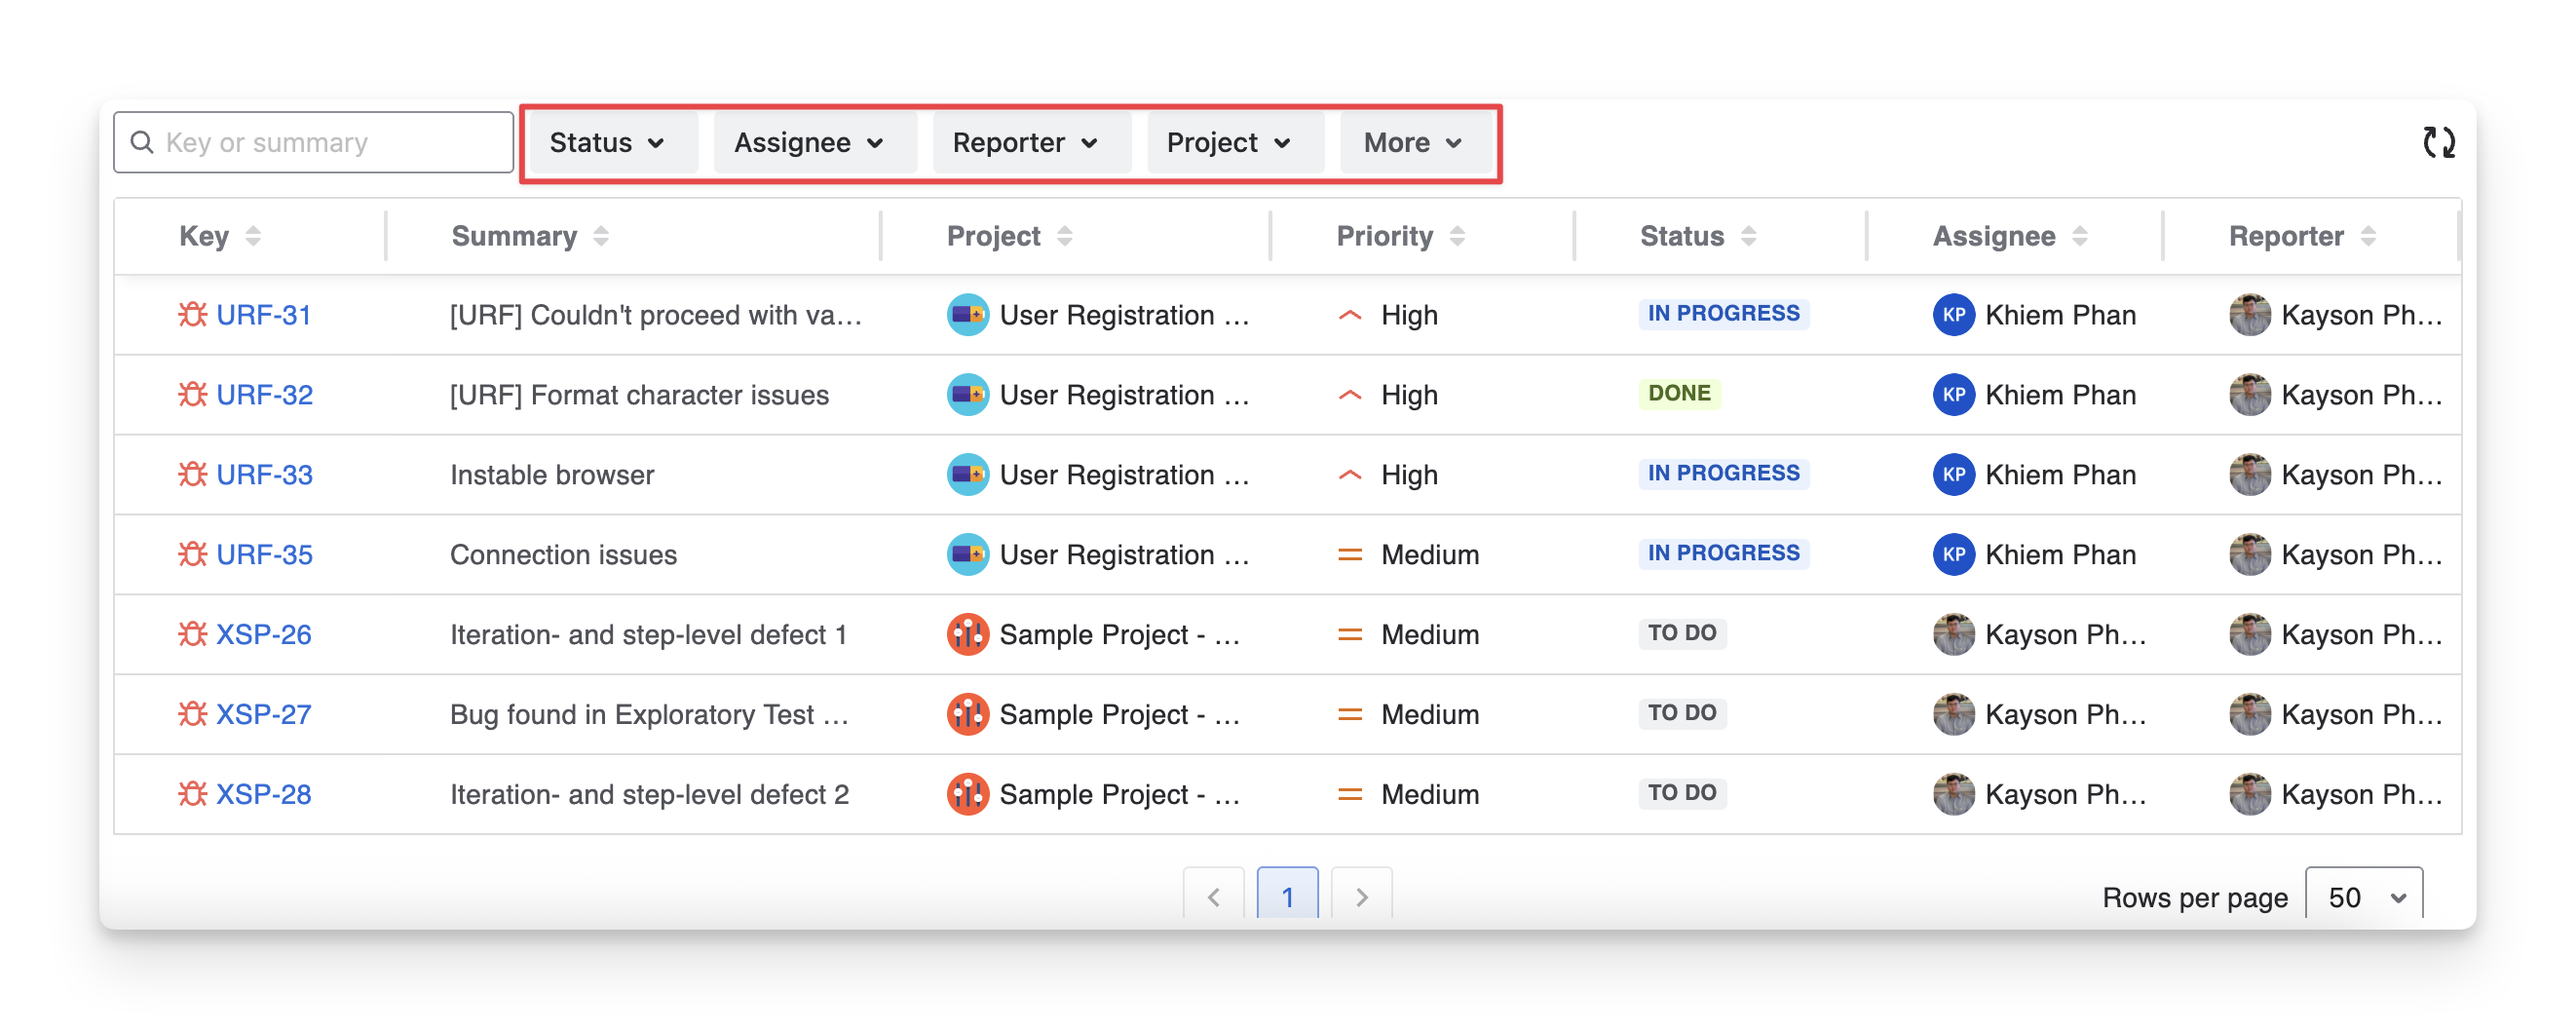
Apply Filters to narrow down the list. You can filter reports by:
-
Status: Filter defects based on their Jira status ( todo in progress done )
-
Assignee: Filter defects by assignee members
-
Reporter: Filter defects by the one who created
-
Project: Filter defects by the project that it belongs to
-
Priority: Filter defects with selected priority levels
-
Resolution: Filter defects with the resolution reason ( won't fix duplicated fixed can't reproduced )
-
3. Save, Share & Export Report
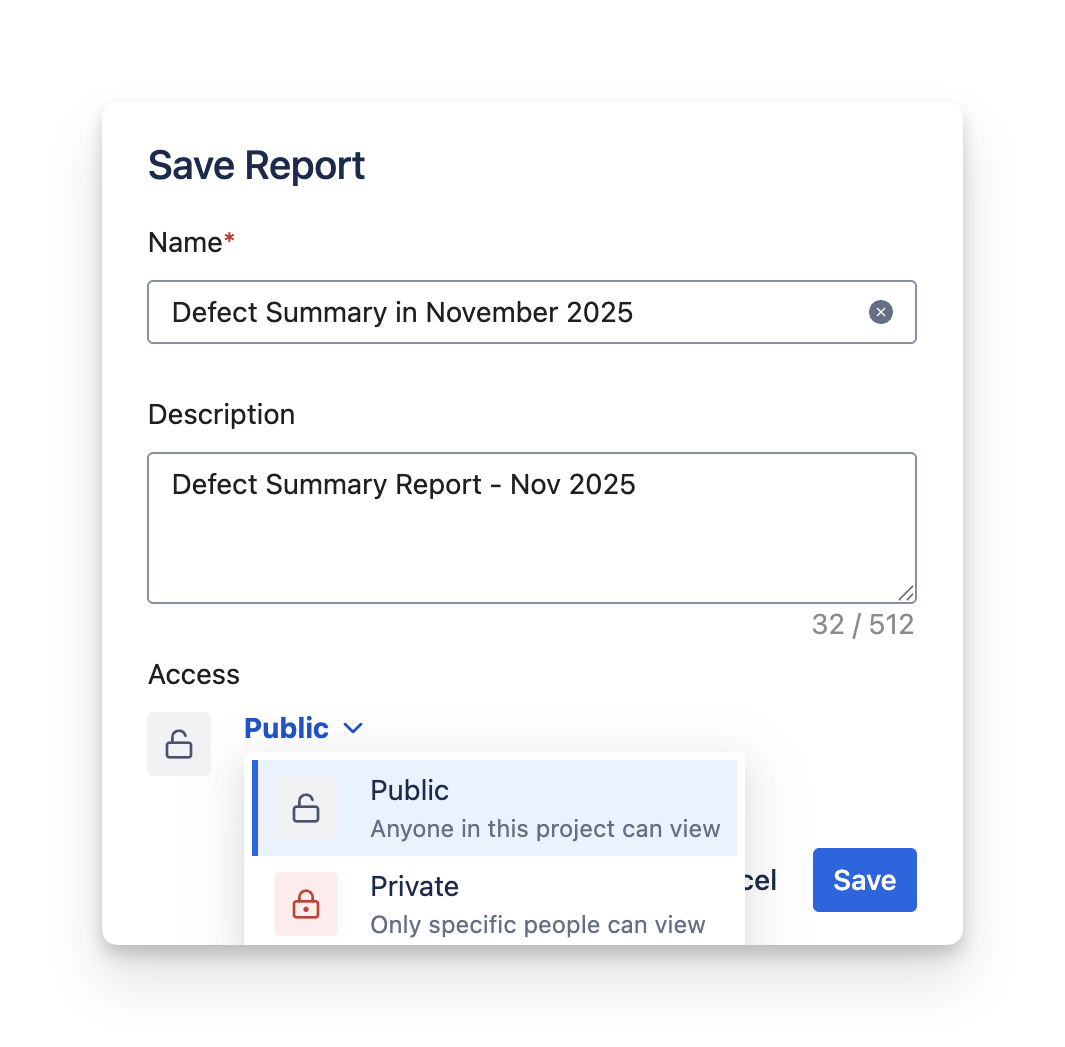
After modifying the Defect Summary Report, click the Save button. When you reopen the report, your settings will restore automatically, so you won’t need to configure it again.
Set the report's accessibility:
-
Choose Private to restrict viewing to some members.
-
Choose Public to allow all members to view the result.
To download the Defect Summary report, click the Export button. AgileTest lets you export this report as PDF or Excel files, including all content from the pie charts and detailed table sections.
Should you need any assistance or further AgileTest inquiries, contact our 24/7 Support Desk.