.png)
1. Overview
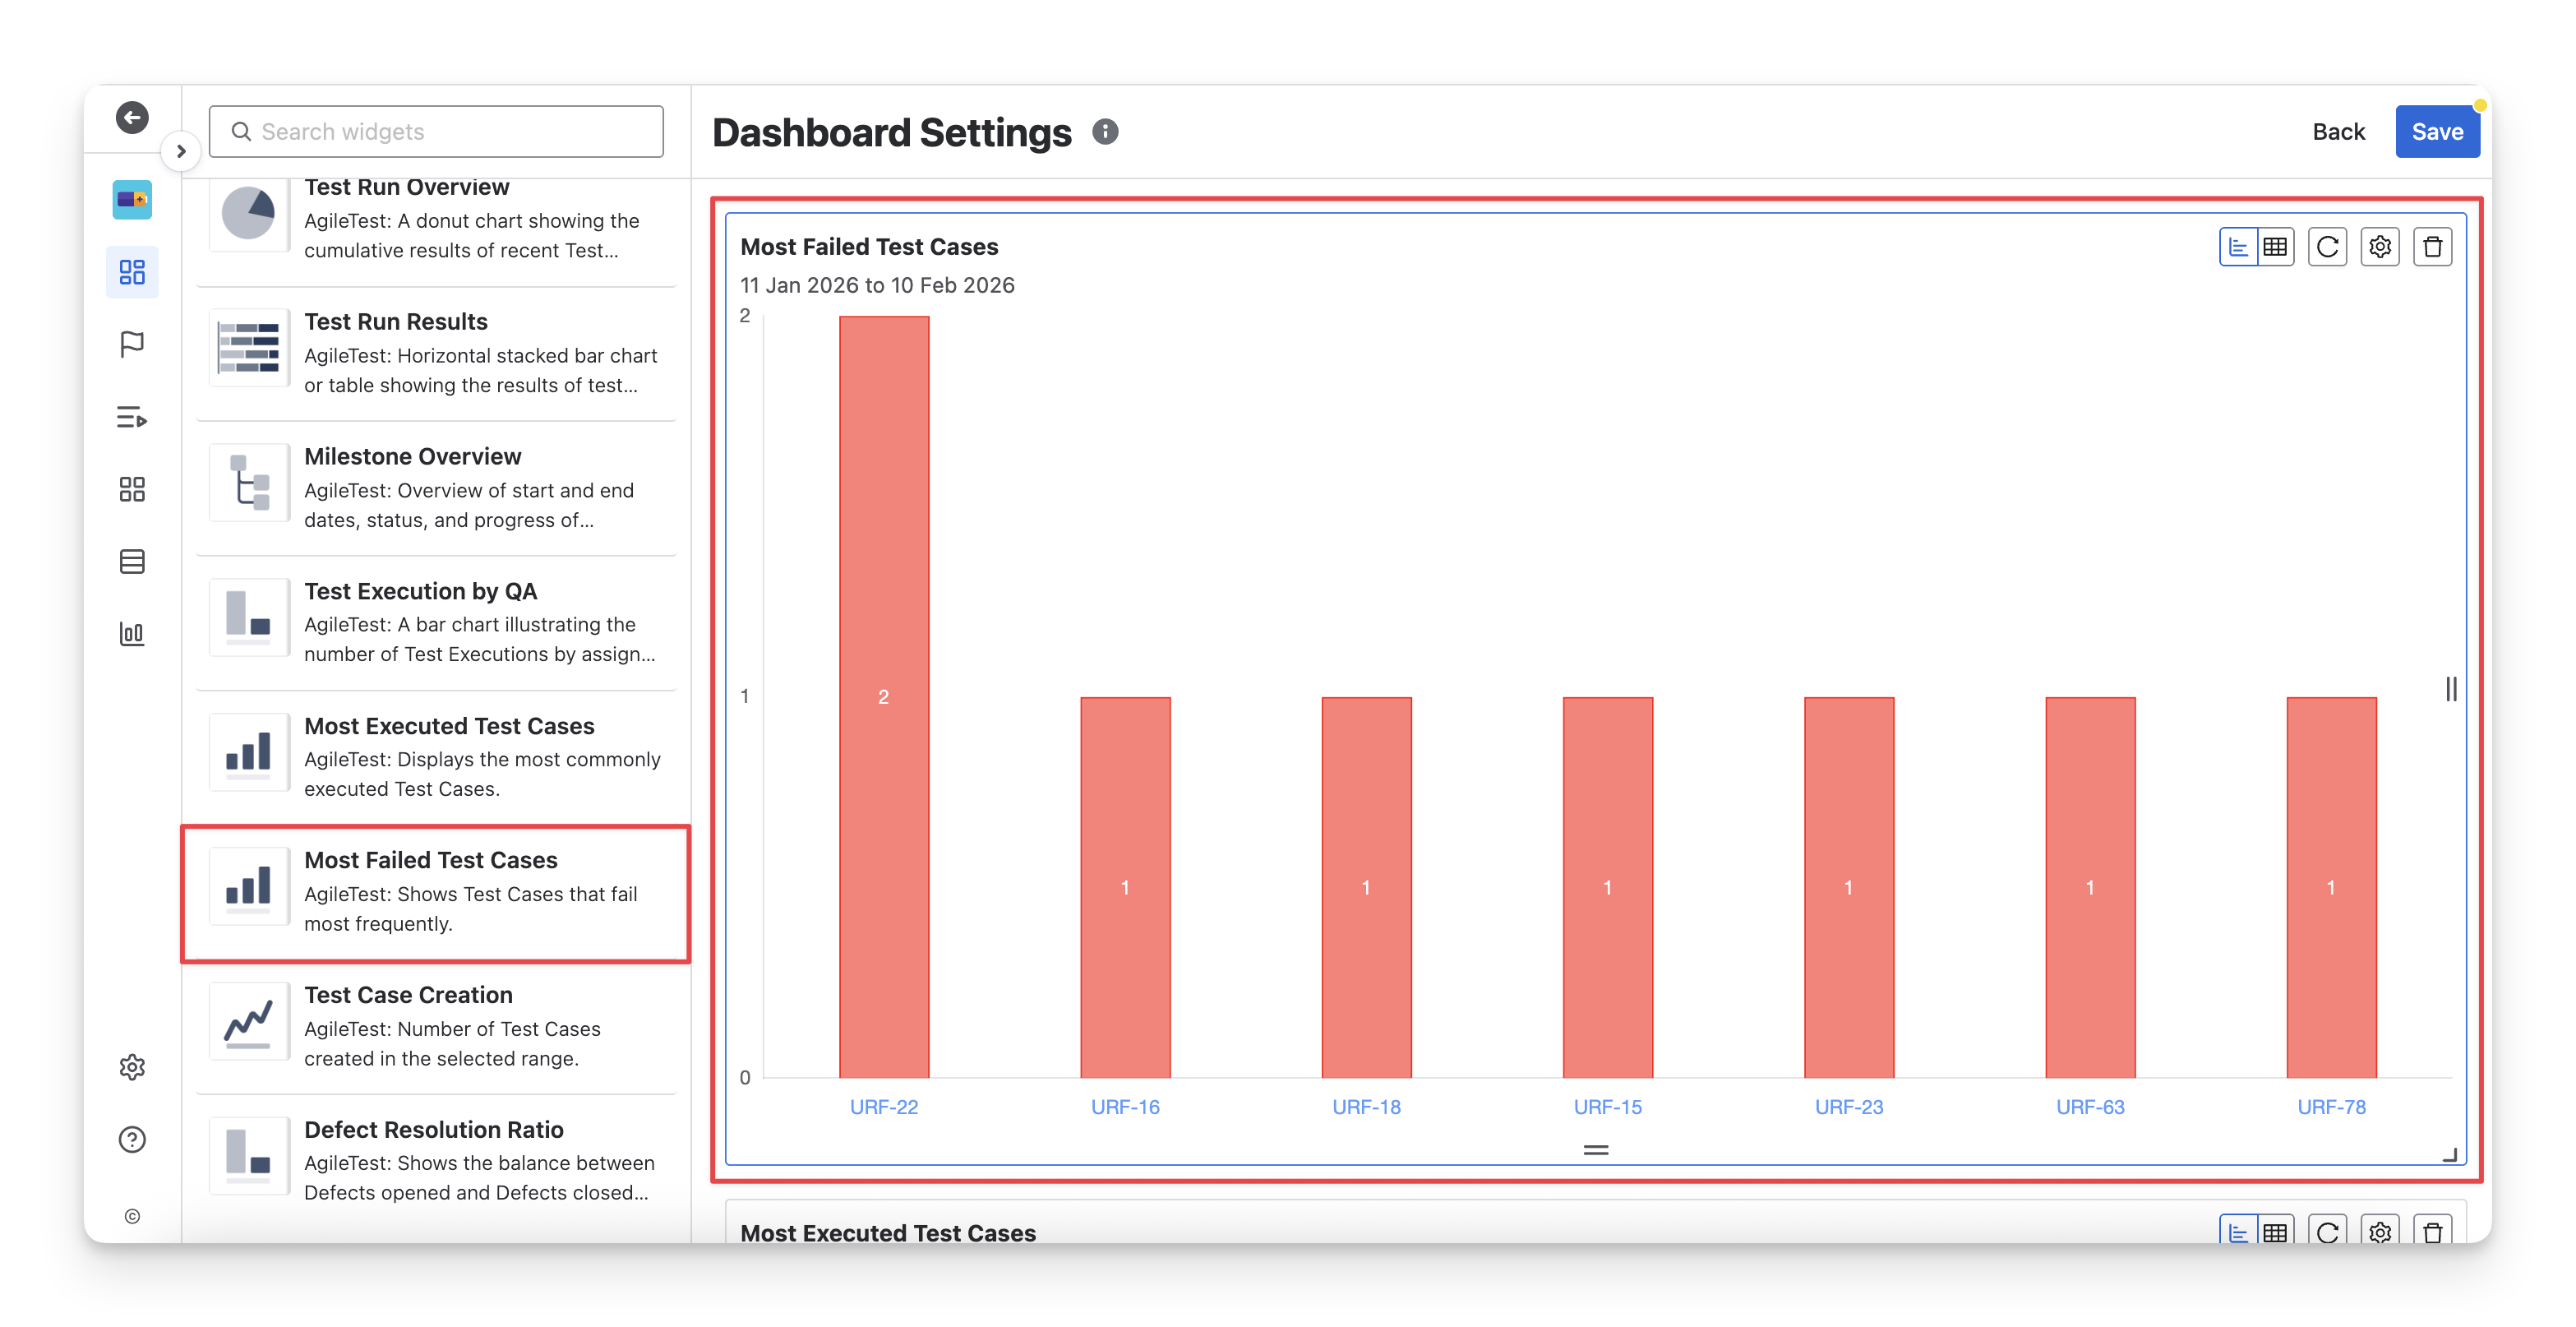
The Most Failed Test Cases widget displays the test cases with the highest number of failures during a selected time period. It provides QA teams with a quick view of recurring failures, helping them understand which test cases fail most often and require closer attention during testing.
This widget has 2 display formats: chart and table. You can switch between these two formats by clicking on the “Switch format” button.
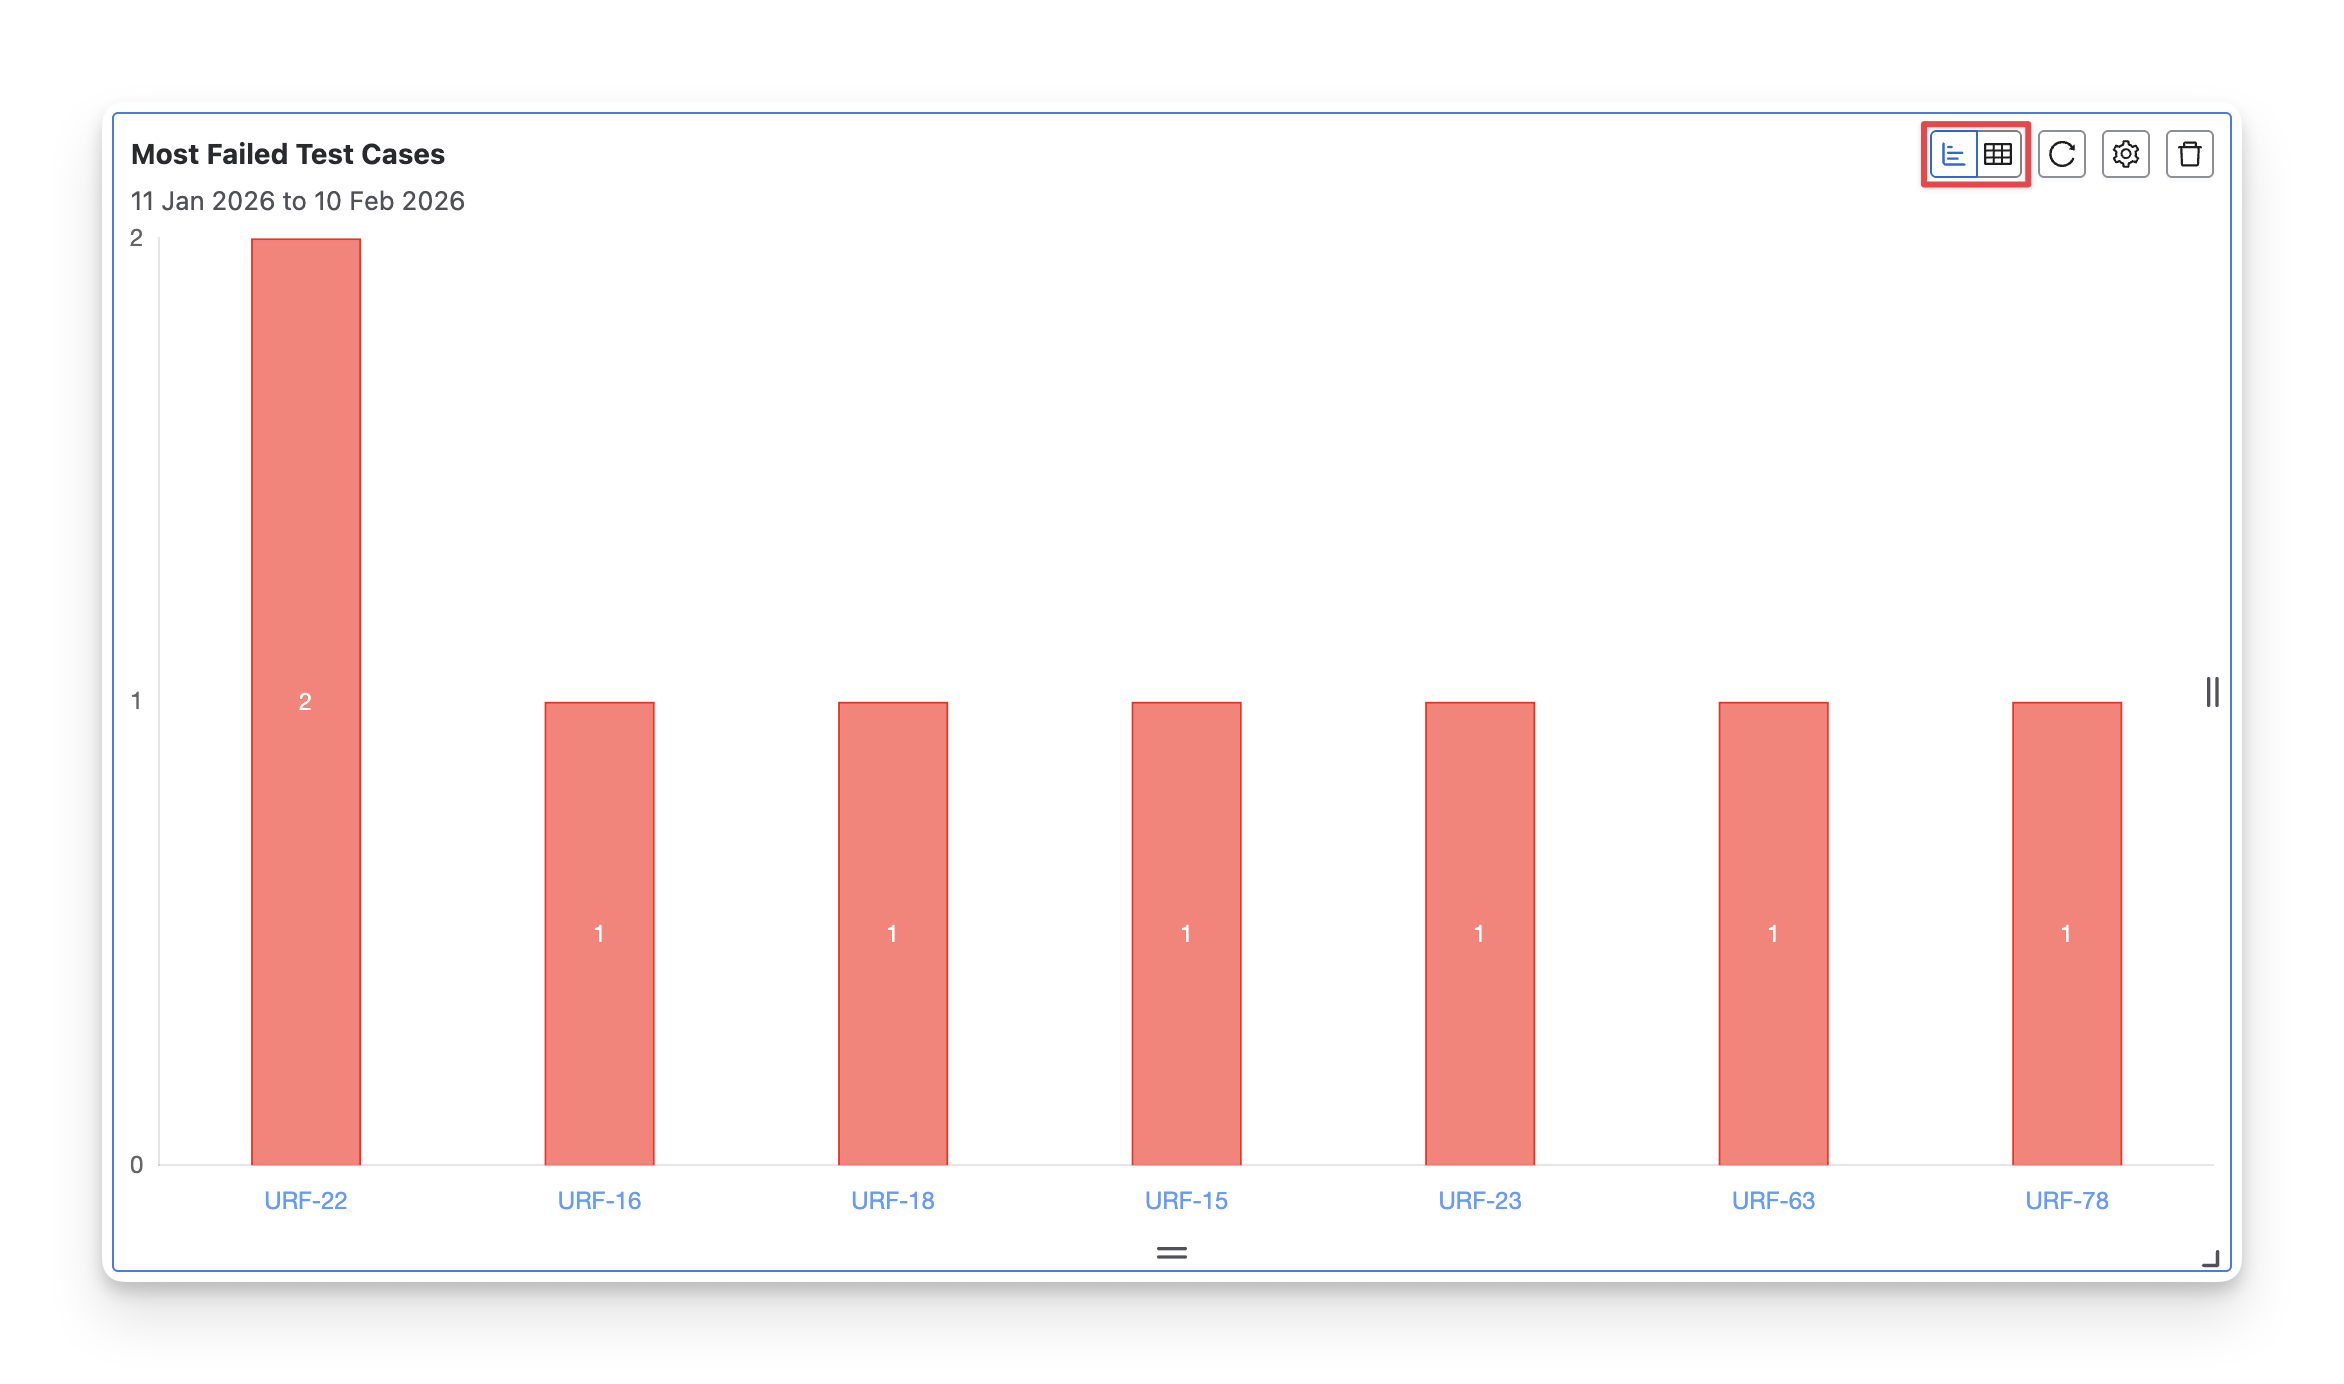
1.1 Chart Format
The chart format visualizes the test cases with the highest number of failures within the selected time range. Each bar represents a test case, and the height of the bar shows how many times that test case has failed
This format is particularly useful when you need to:
-
Quickly spot high-risk areas: Identify test cases that fail repeatedly and may indicate unstable features or recurring defects.
-
Prioritize investigation: Focus debugging and retesting efforts on test cases with the highest failure counts.
-
Communicate issues visually: Share a quick, easy-to-understand view of problem areas for internal teams.
1.2 Table Format
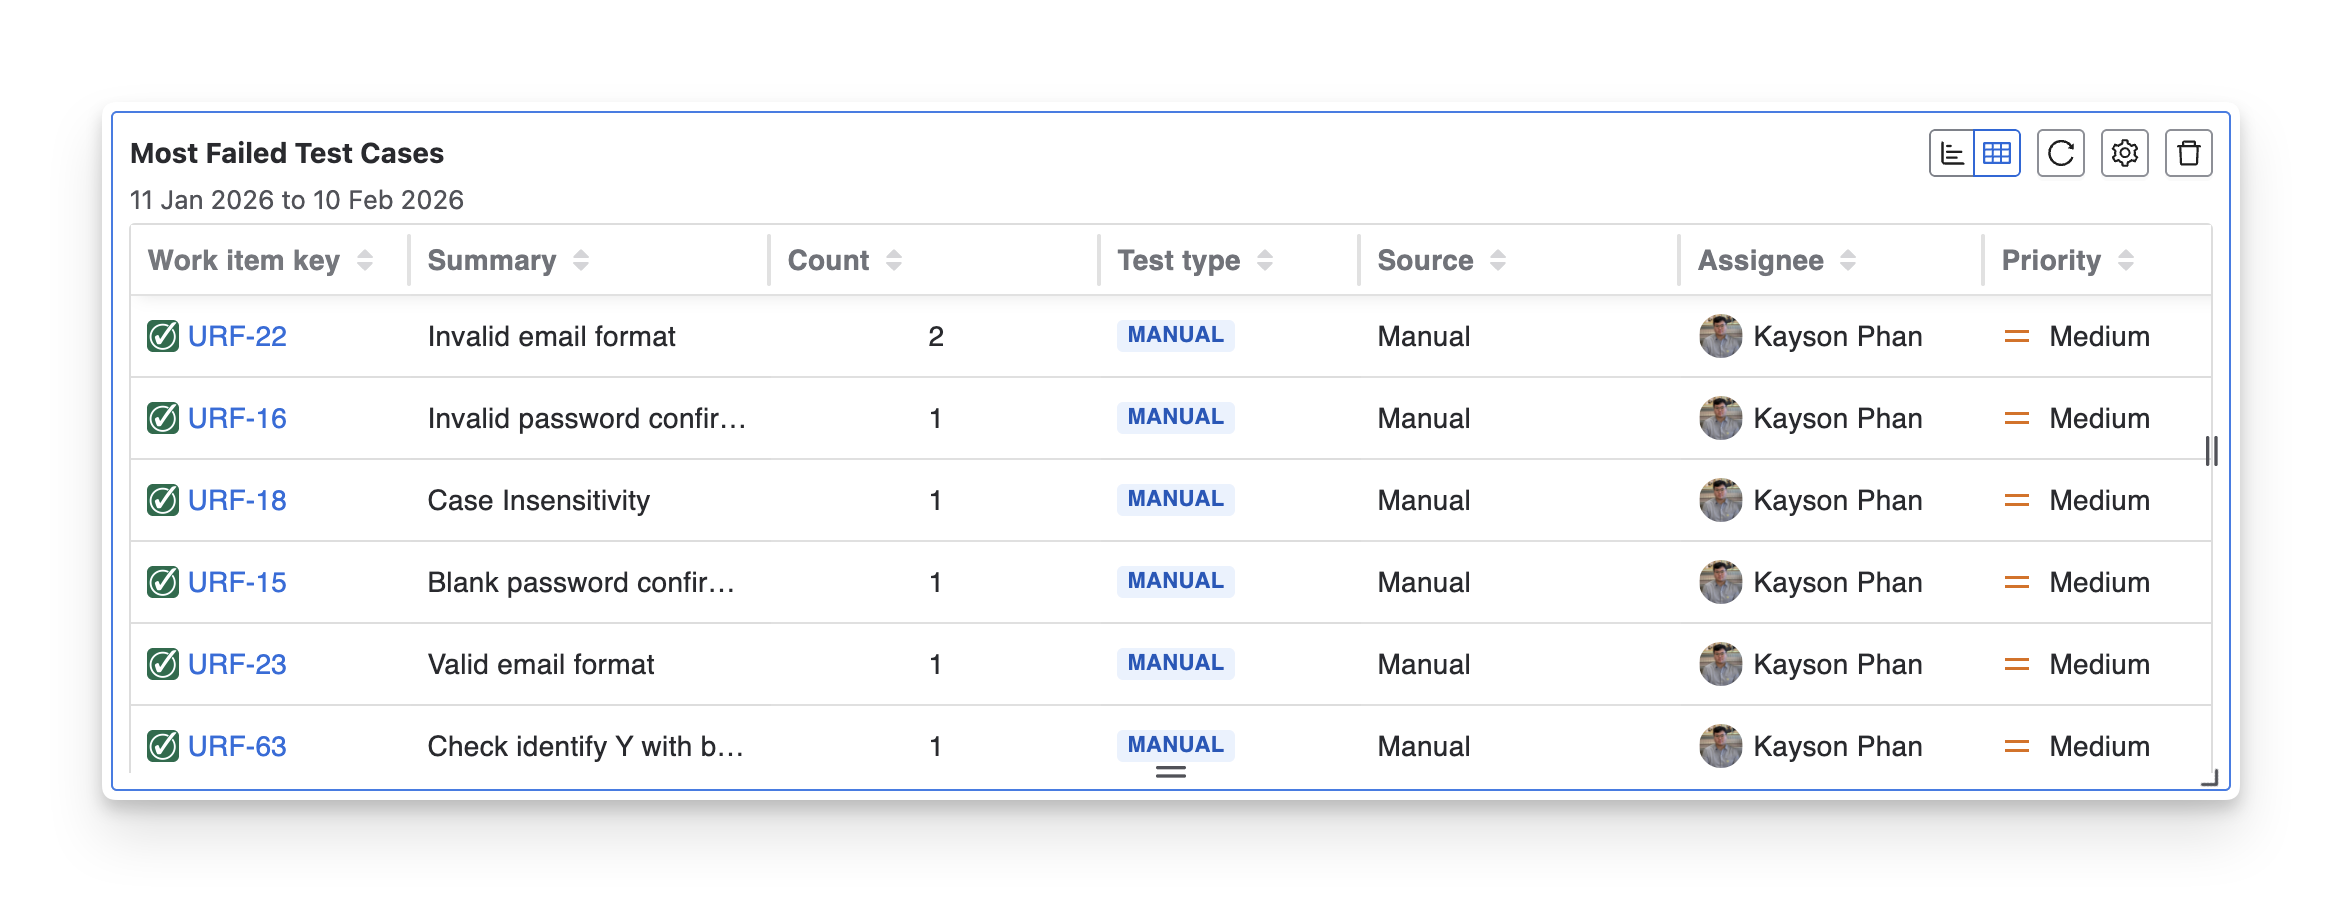
The Most Failed Test Cases table provides a detailed breakdown of each frequently failing test case. Each row represents a test case and includes information such as the test case key, summary, failure count, test type, source, assignee, priority, reporter, last updated time, and created date.
This format is particularly useful when you need to:
-
Analyze failures in detail: Review exactly which test cases are failing, how often, and who is responsible for them.
-
Plan corrective actions: Compare details of test cases to determine whether they need updates, automation, refactoring, or closer collaboration with developers.
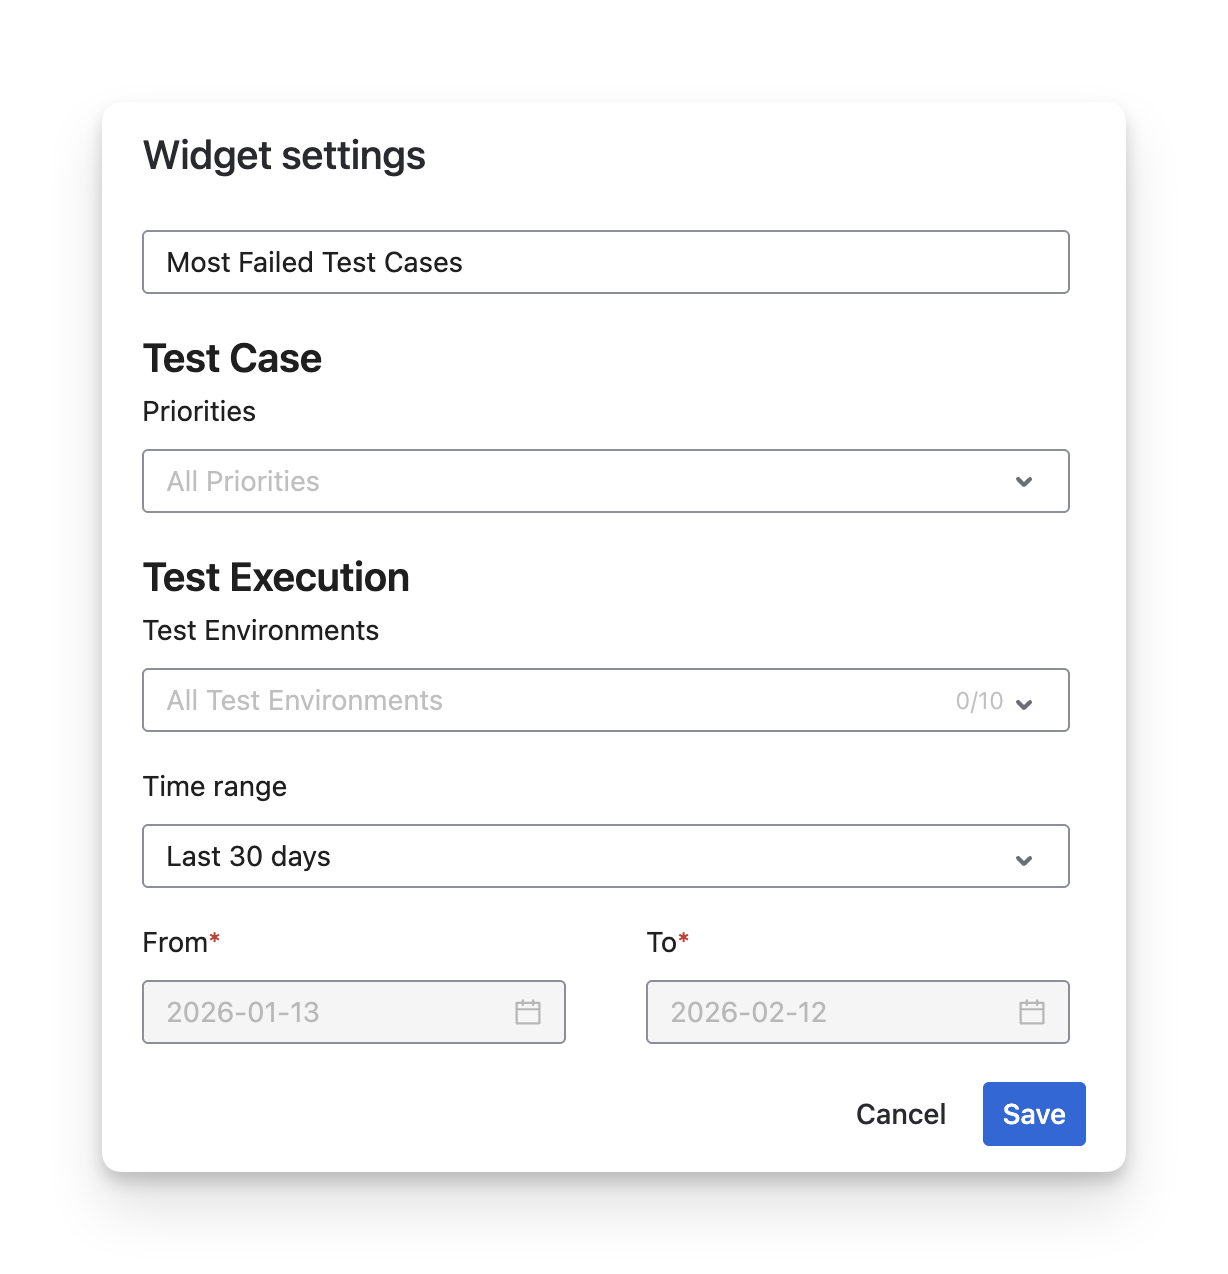
2. Configurations
With this widget, you can:
-
Rename the widget to match your reporting purpose.
-
Filter test cases by priority to focus on high-impact or critical failures.
-
Filter by test environments (up to 10) to identify environment-specific failure patterns.
-
Select a time range using presets or define a custom From–To date range to control the reporting period.
-
Set a limit to define how many top failed test cases are displayed (up to 20).
-
Choose the default display mode (Chart or Table) depending on whether you need a quick visual overview or detailed failure data.
Should you need any assistance or further AgileTest inquiries, contact our 24/7 Support Desk!