.png)
1. Overview
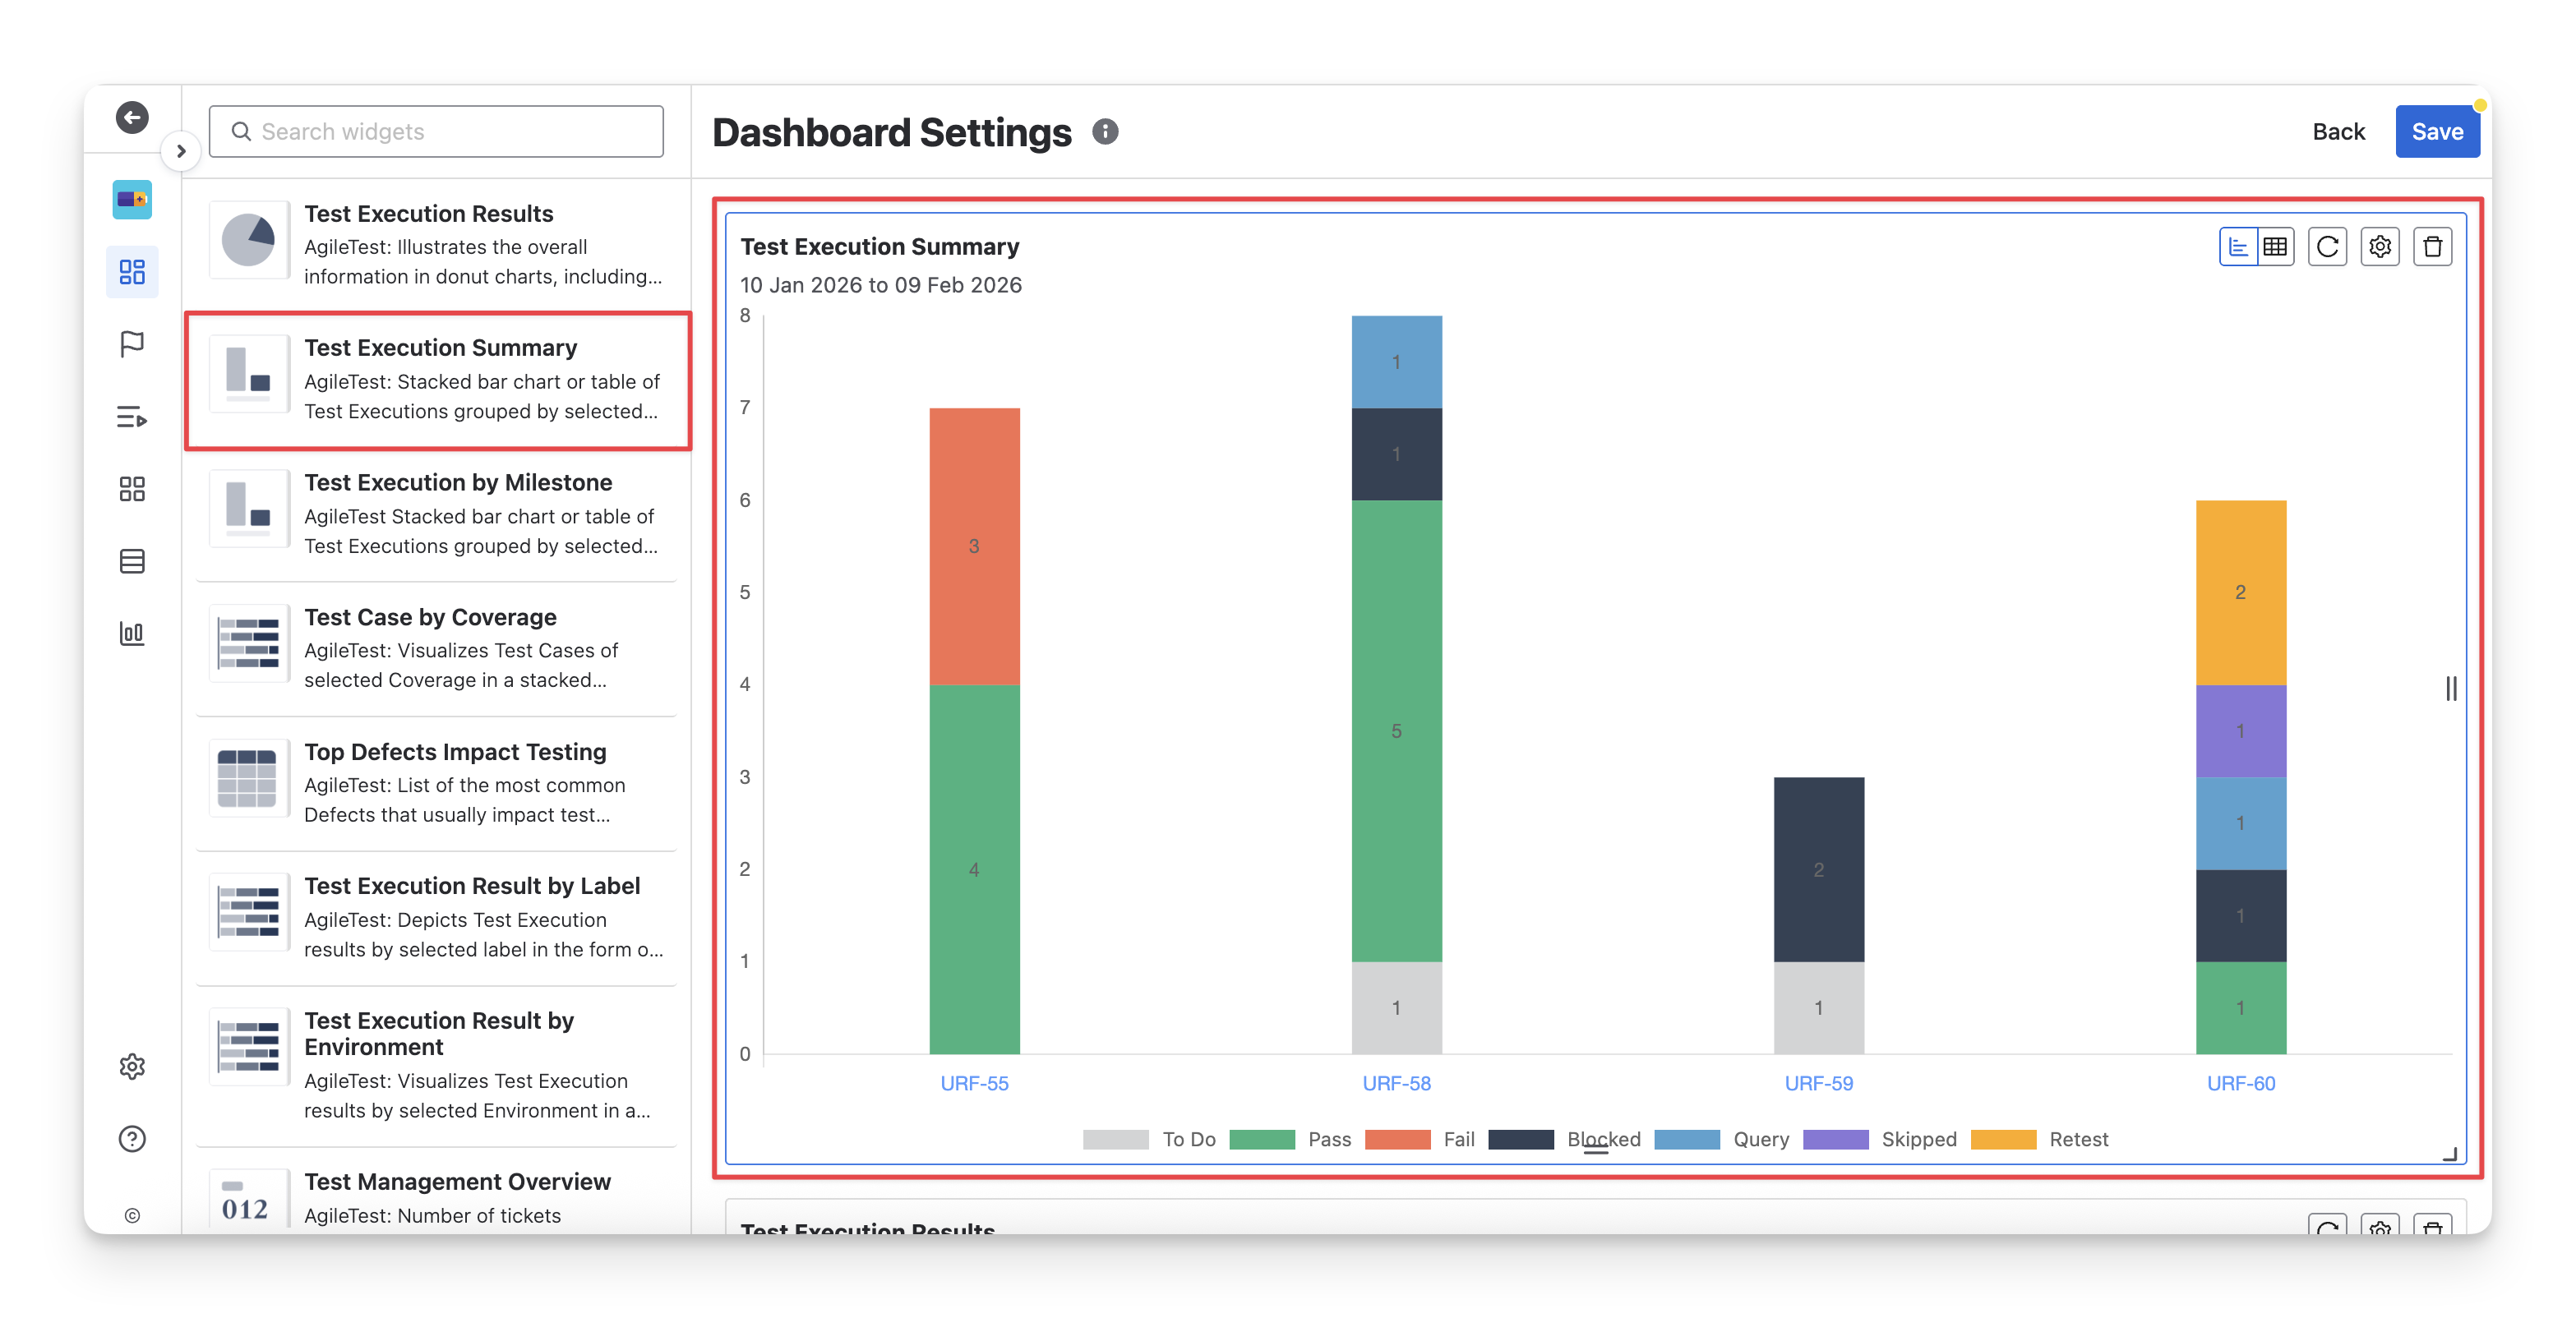
The Test Execution Summary widget is useful when you need to focus mainly on summarizing the executed statuses of test cases in each test execution ( Fail pass skipped blocked query todo retest ).
This widget has 2 display formats: chart and table. You can switch between these two formats by clicking on the “Switch format” button.
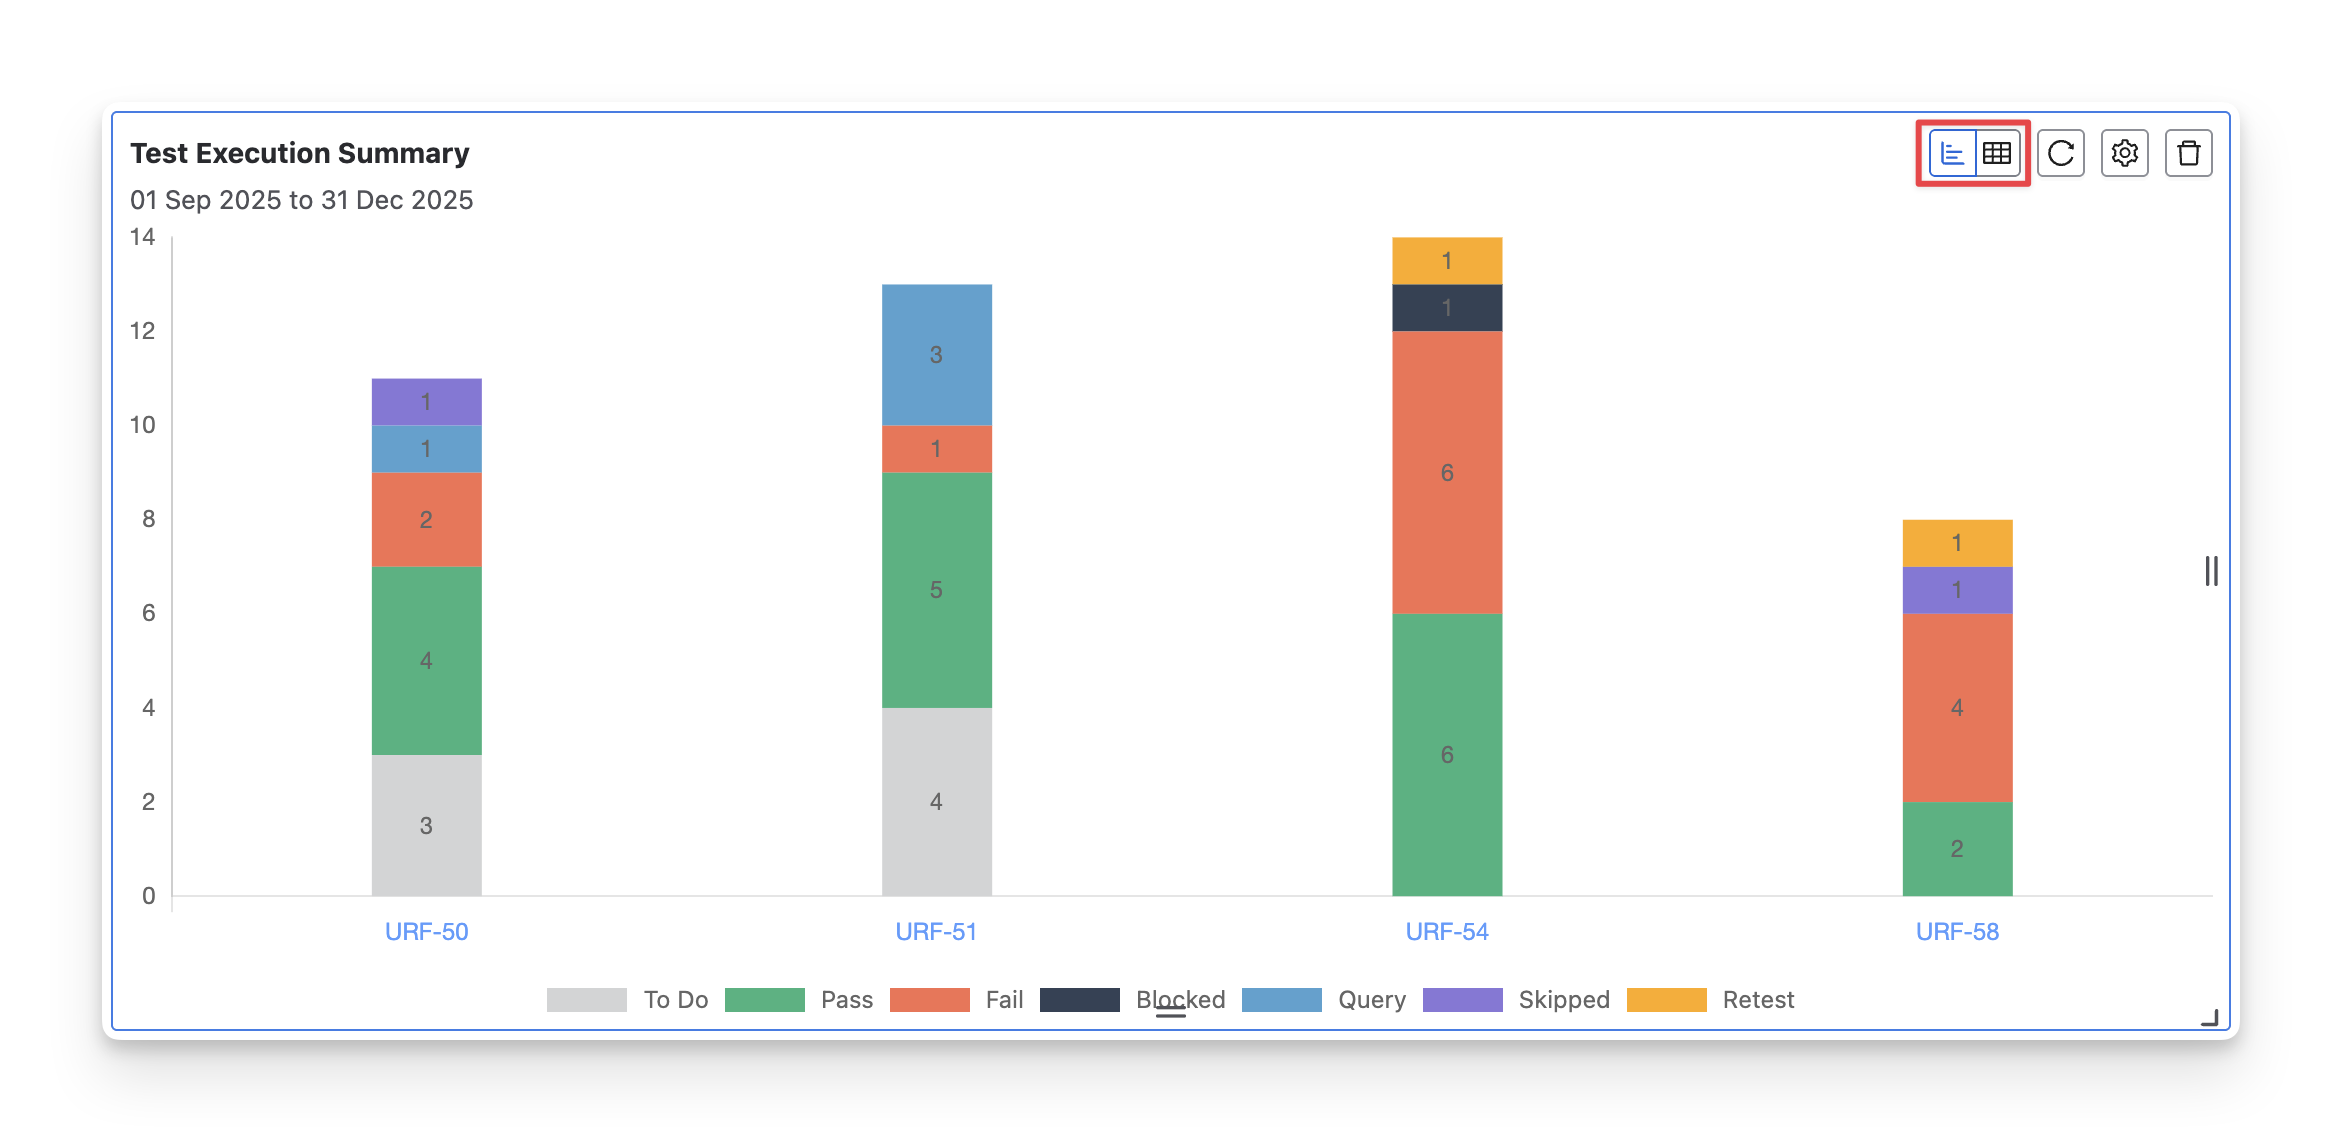
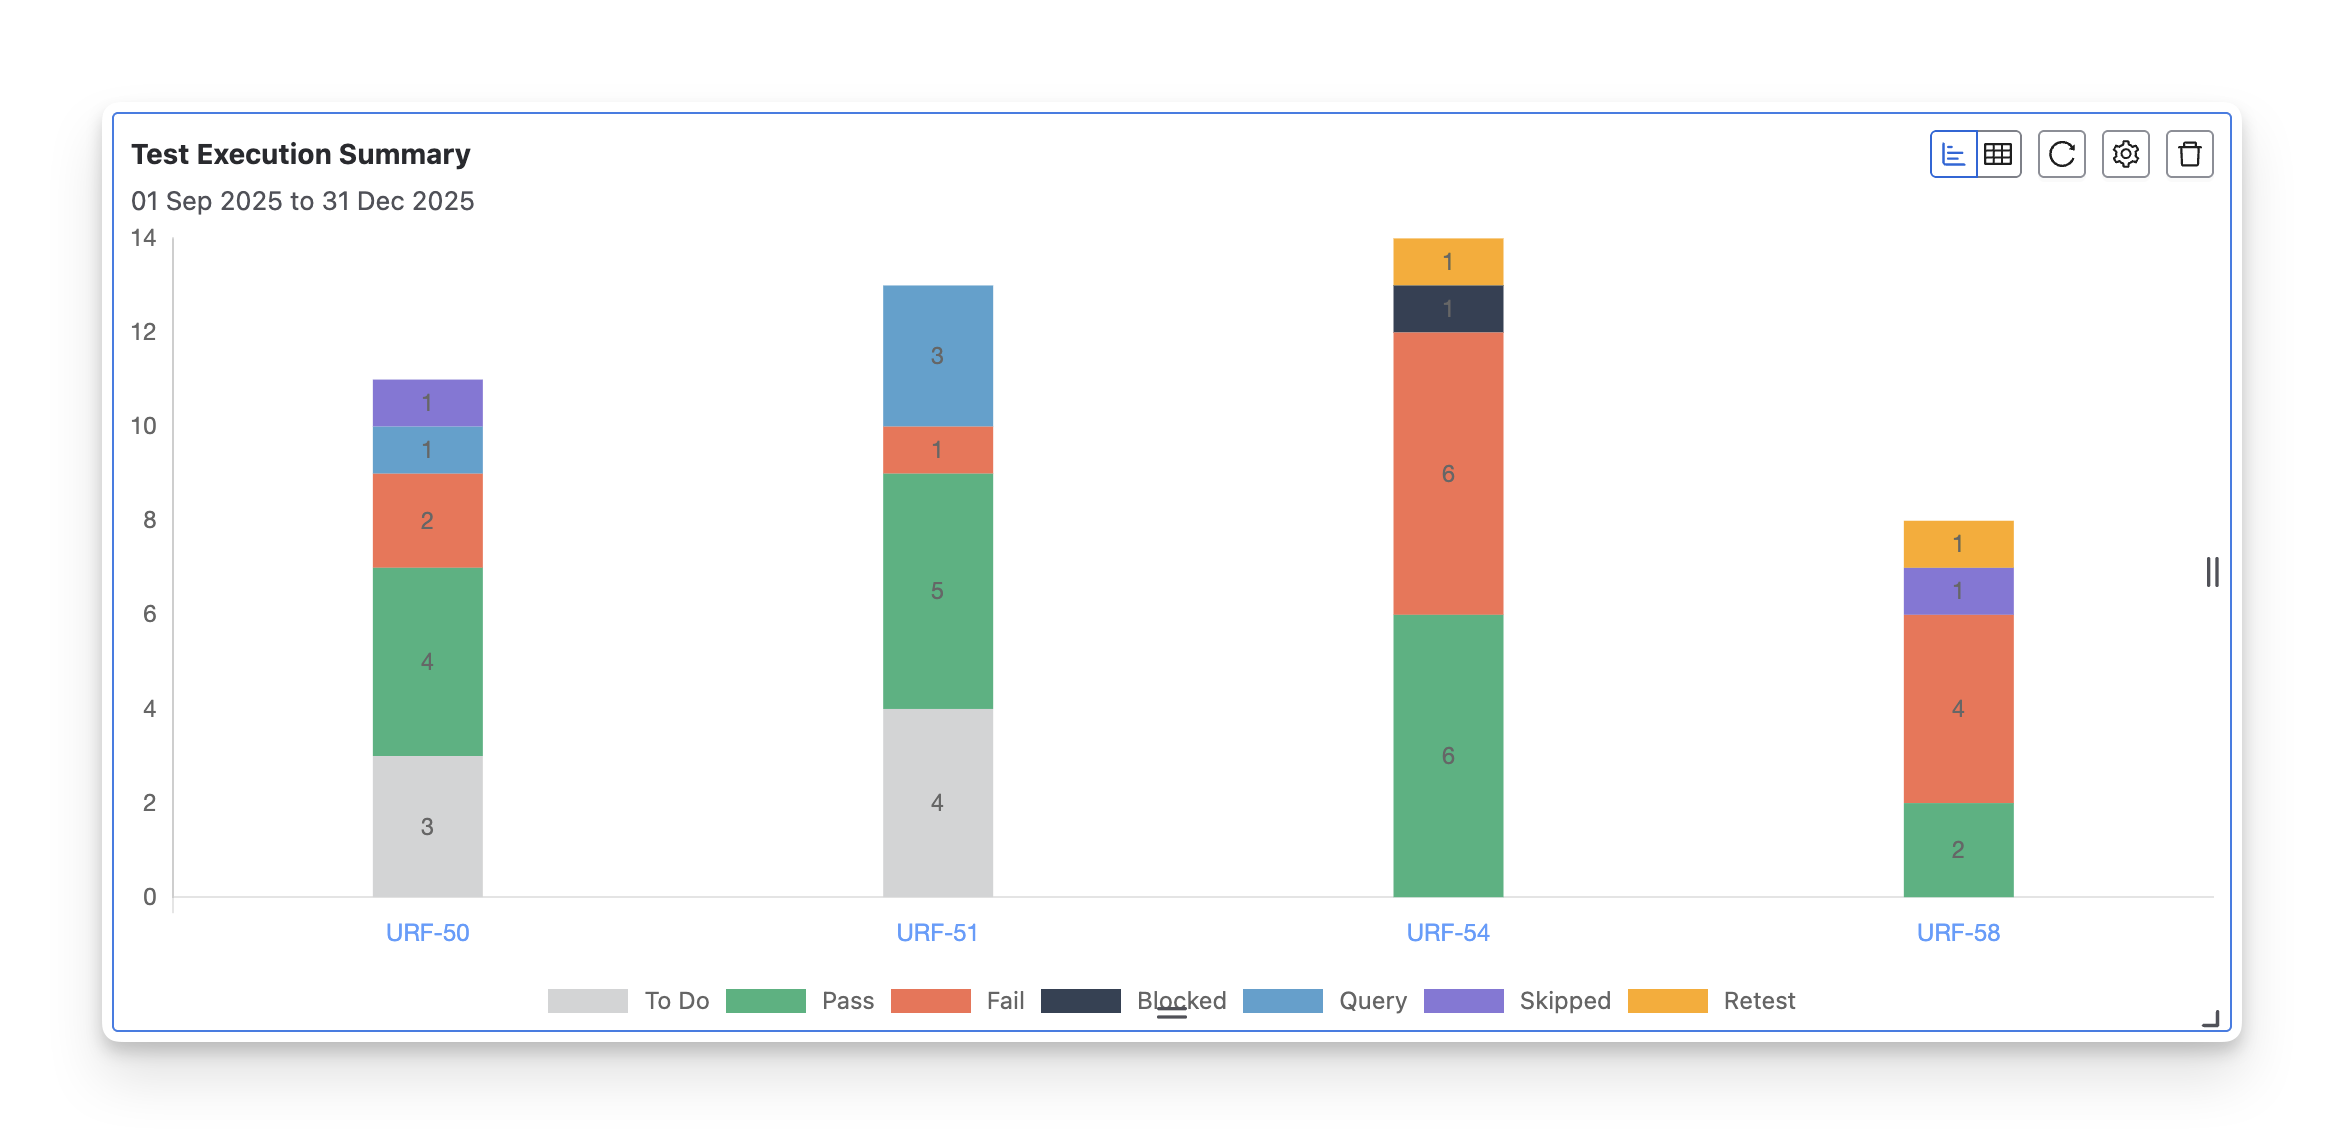
1.1 Chart Format
The Test Execution Summary chart uses stacked columns, where each column represents a test execution with its Jira key, and the sections within the column show the number of test cases along with the execution statuses ( Fail pass skipped blocked query todo retest ).
This format is particularly useful when you need to:
-
Identify issues early: Quickly spot which executions have an alarming number of Fail Blocked retest test cases. This allows you to address bottlenecks or critical blockers early, keeping the project on track.
-
Monitor team workload: If multiple test executions are involved, you can easily compare test execution status across them and determine if any specific area needs more focus or resources.
-
Report to stakeholders: Use the chart to give project managers and team leads a simple visual update on test execution status during standups or status meetings.
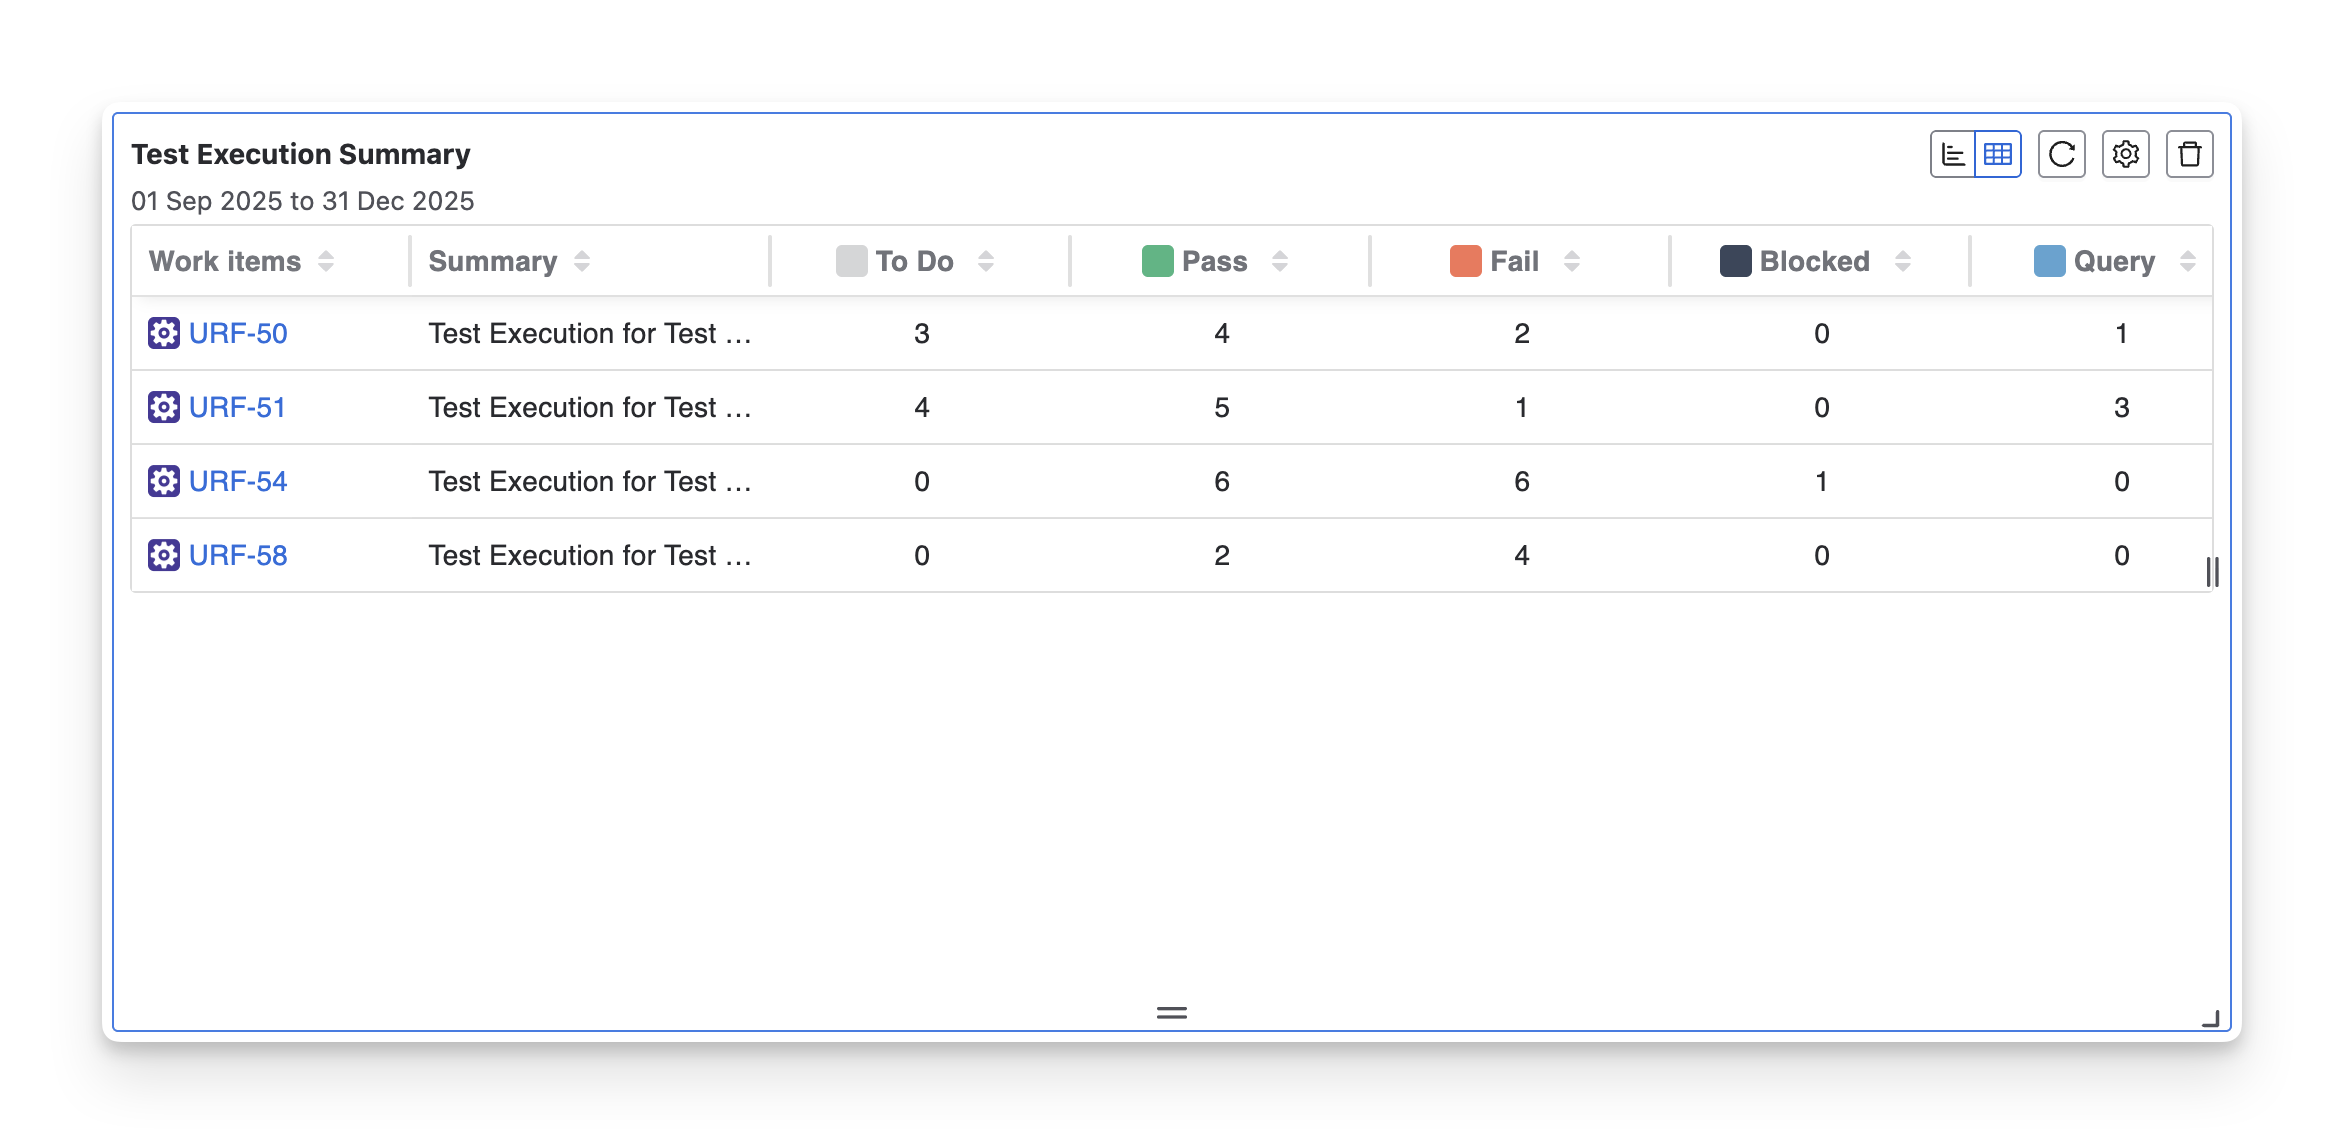
1.2 Table Format
The Test Execution Summary Table displays test execution data in a tabular format, where each row represents a test execution identified by its Jira key. The table columns show the number of test cases along with their execution statuses ( Fail pass skipped blocked query todo retest ).
This format is particularly useful when you need to:
-
Get detailed execution data: The table view provides a clear breakdown of test executions, showing the exact number of test cases for each execution status. This helps in monitoring and troubleshooting specific areas.
-
Track specific test execution progress: Easily compare the performance of each test execution across different Jira issues. You can spot discrepancies in execution status or identify where additional focus is needed.
2. Configurations
With this widget, you can:
-
Rename the widget to match your reporting purpose.
-
Choose the data source by selecting specific work items or applying a saved filter.
-
Filter test cases by priority to focus on critical testing areas.
-
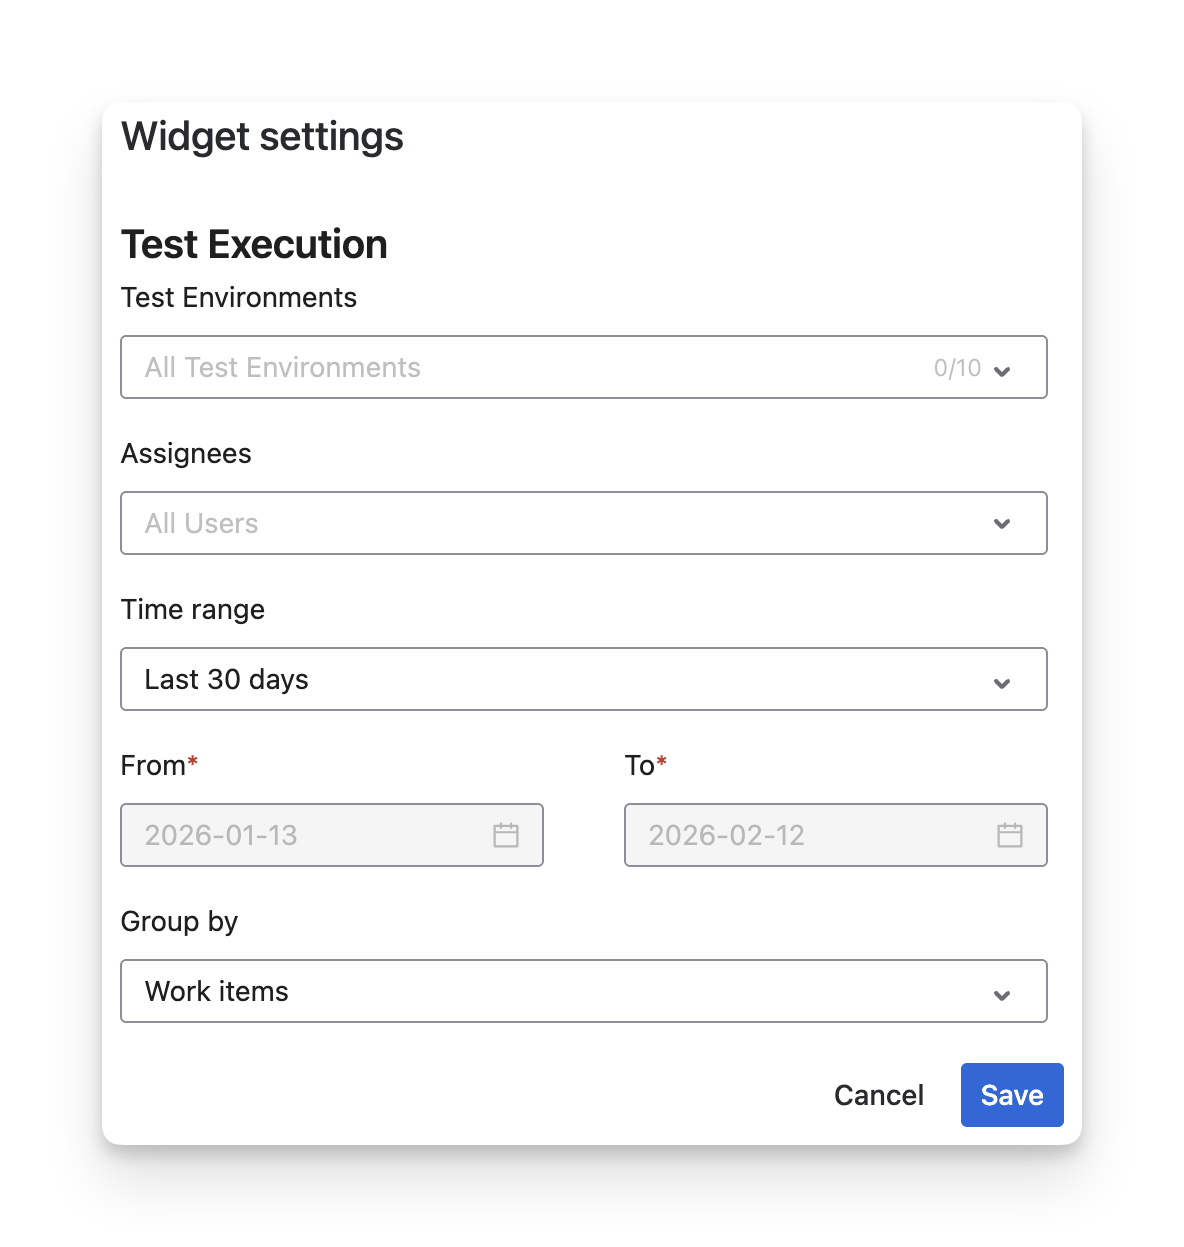
Narrow results by test environments (up to 10) to analyze environment-specific execution.
-
Filter by assignees to review execution performance by QA members.
-
Set a custom time range using presets or specific From–To dates.
-
Group results (e.g., by work items) to control how execution data is organized.
-
Select the default display mode (Chart or Table) based on your reporting preference.
Should you need any assistance or further AgileTest inquiries, contact our 24/7 Support Desk!