.png)
1. Overview
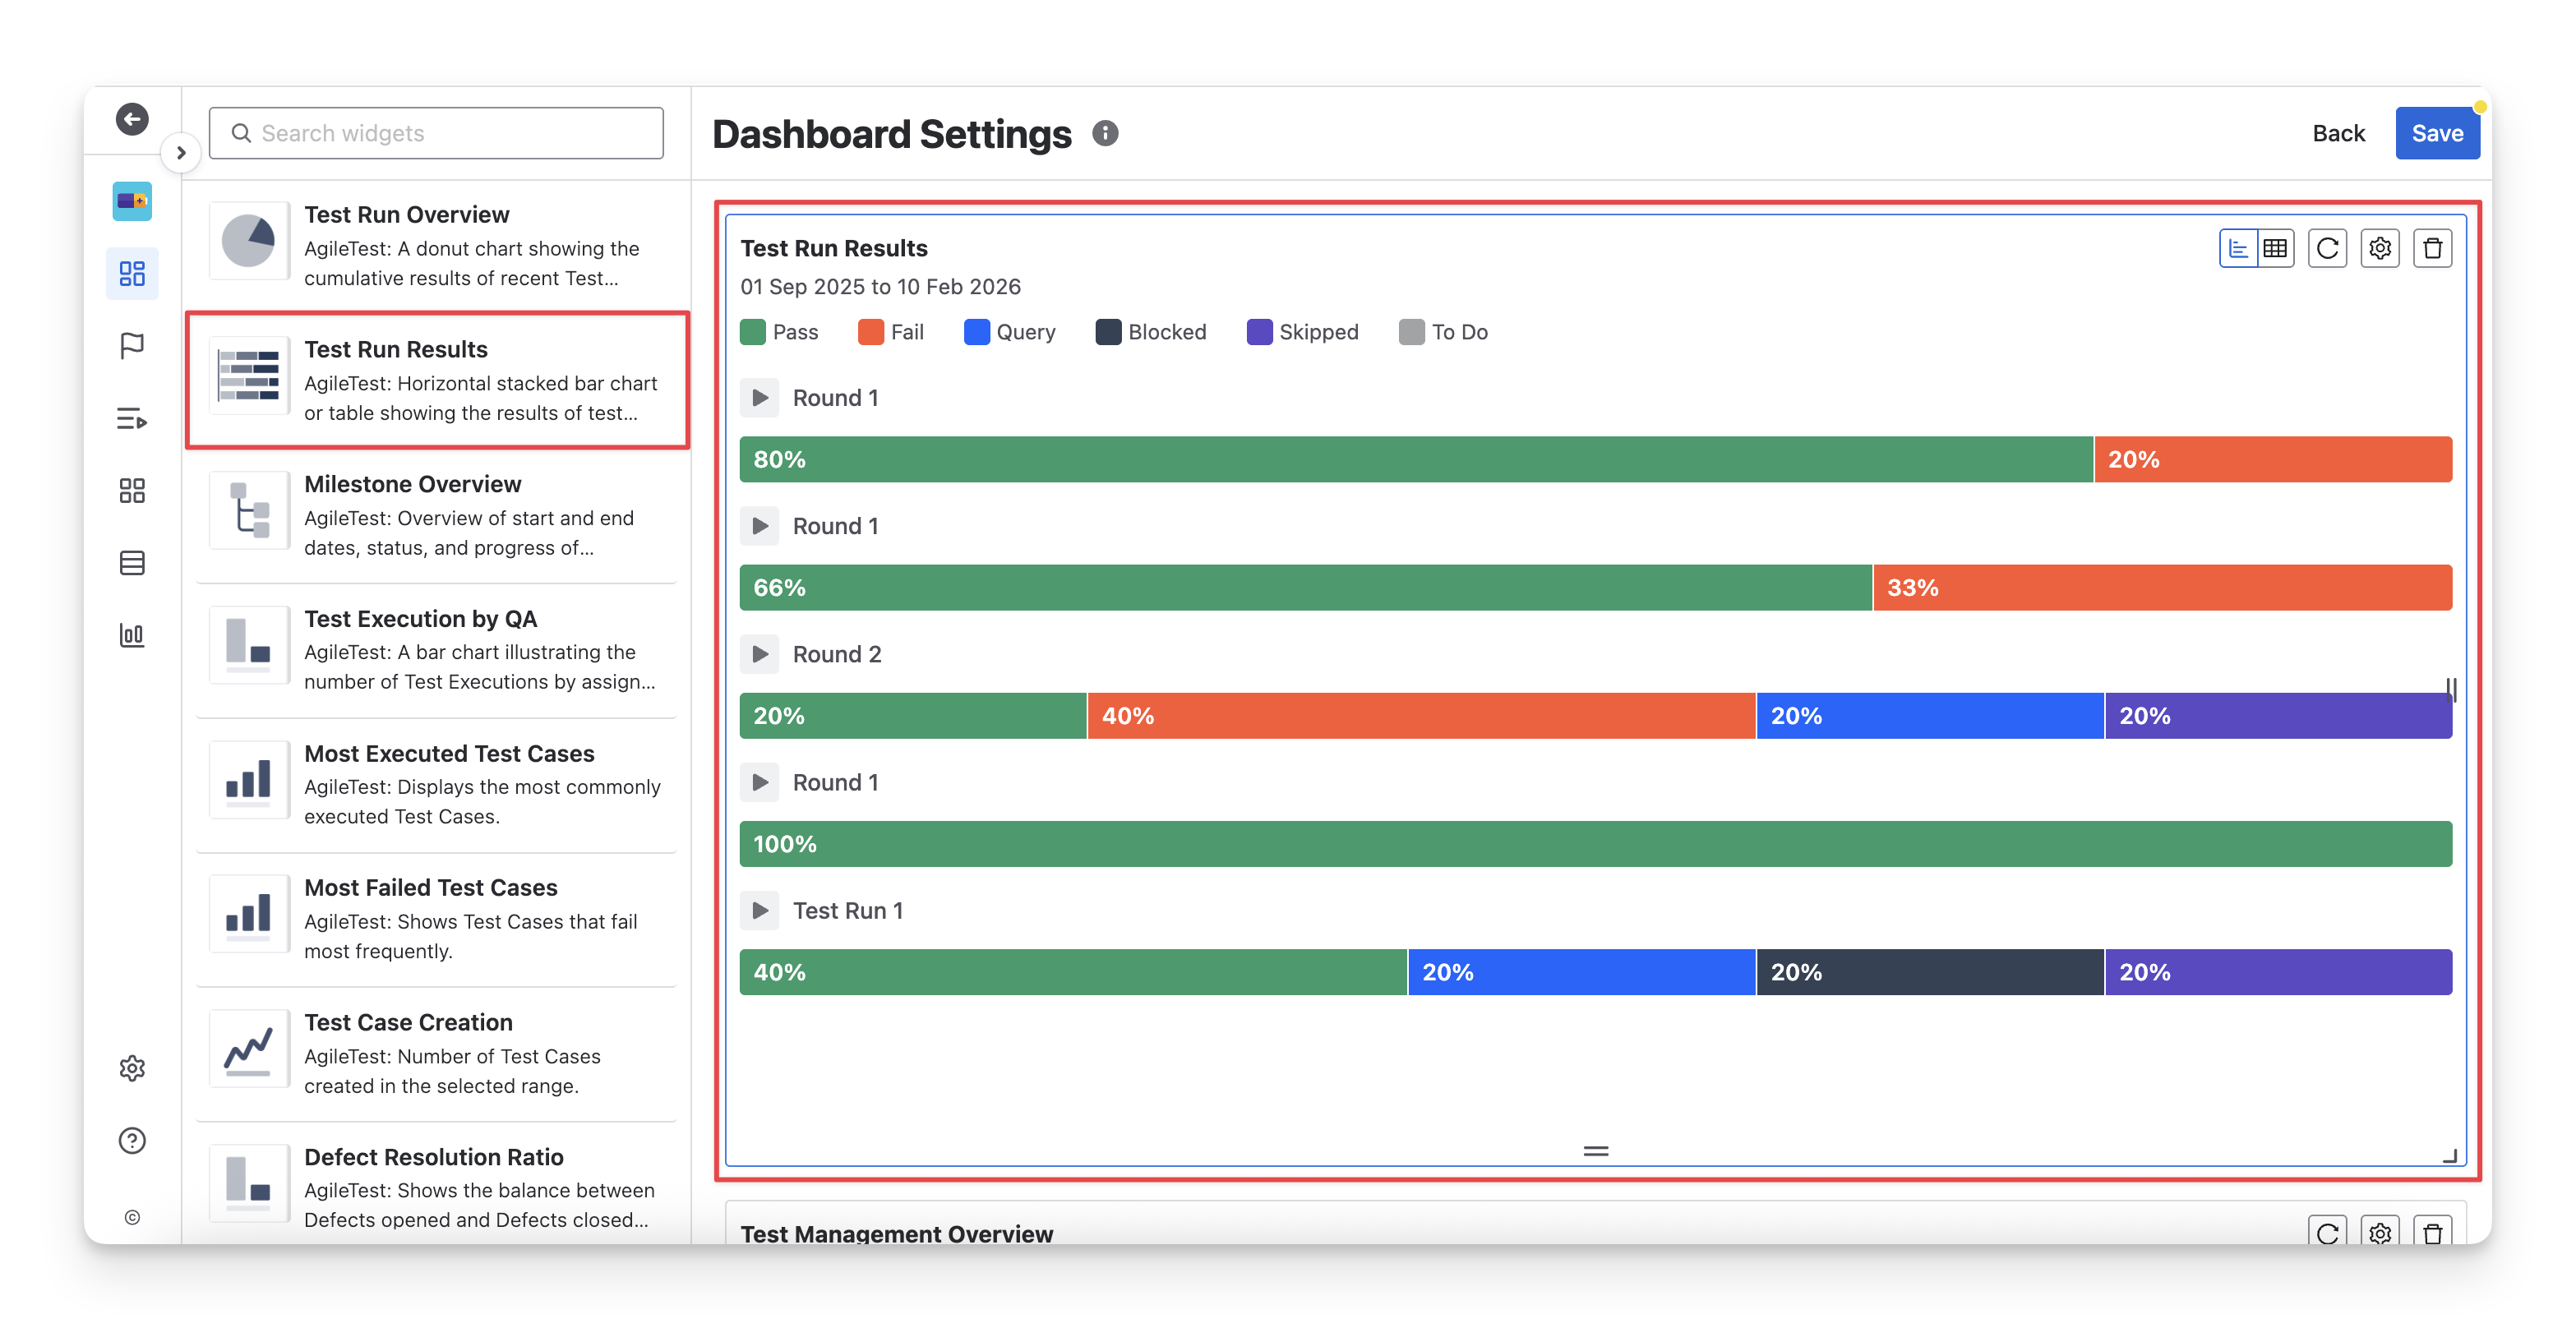
Test Run Results is designed for QA teams who need a detailed breakdown of test item status across individual test runs in script tests. This widget displays each test run along with execution statuses ( Fail pass skipped blocked query todo ).
This widget has 2 display formats: chart and table. You can switch between these two formats by clicking on the “Switch format” button.
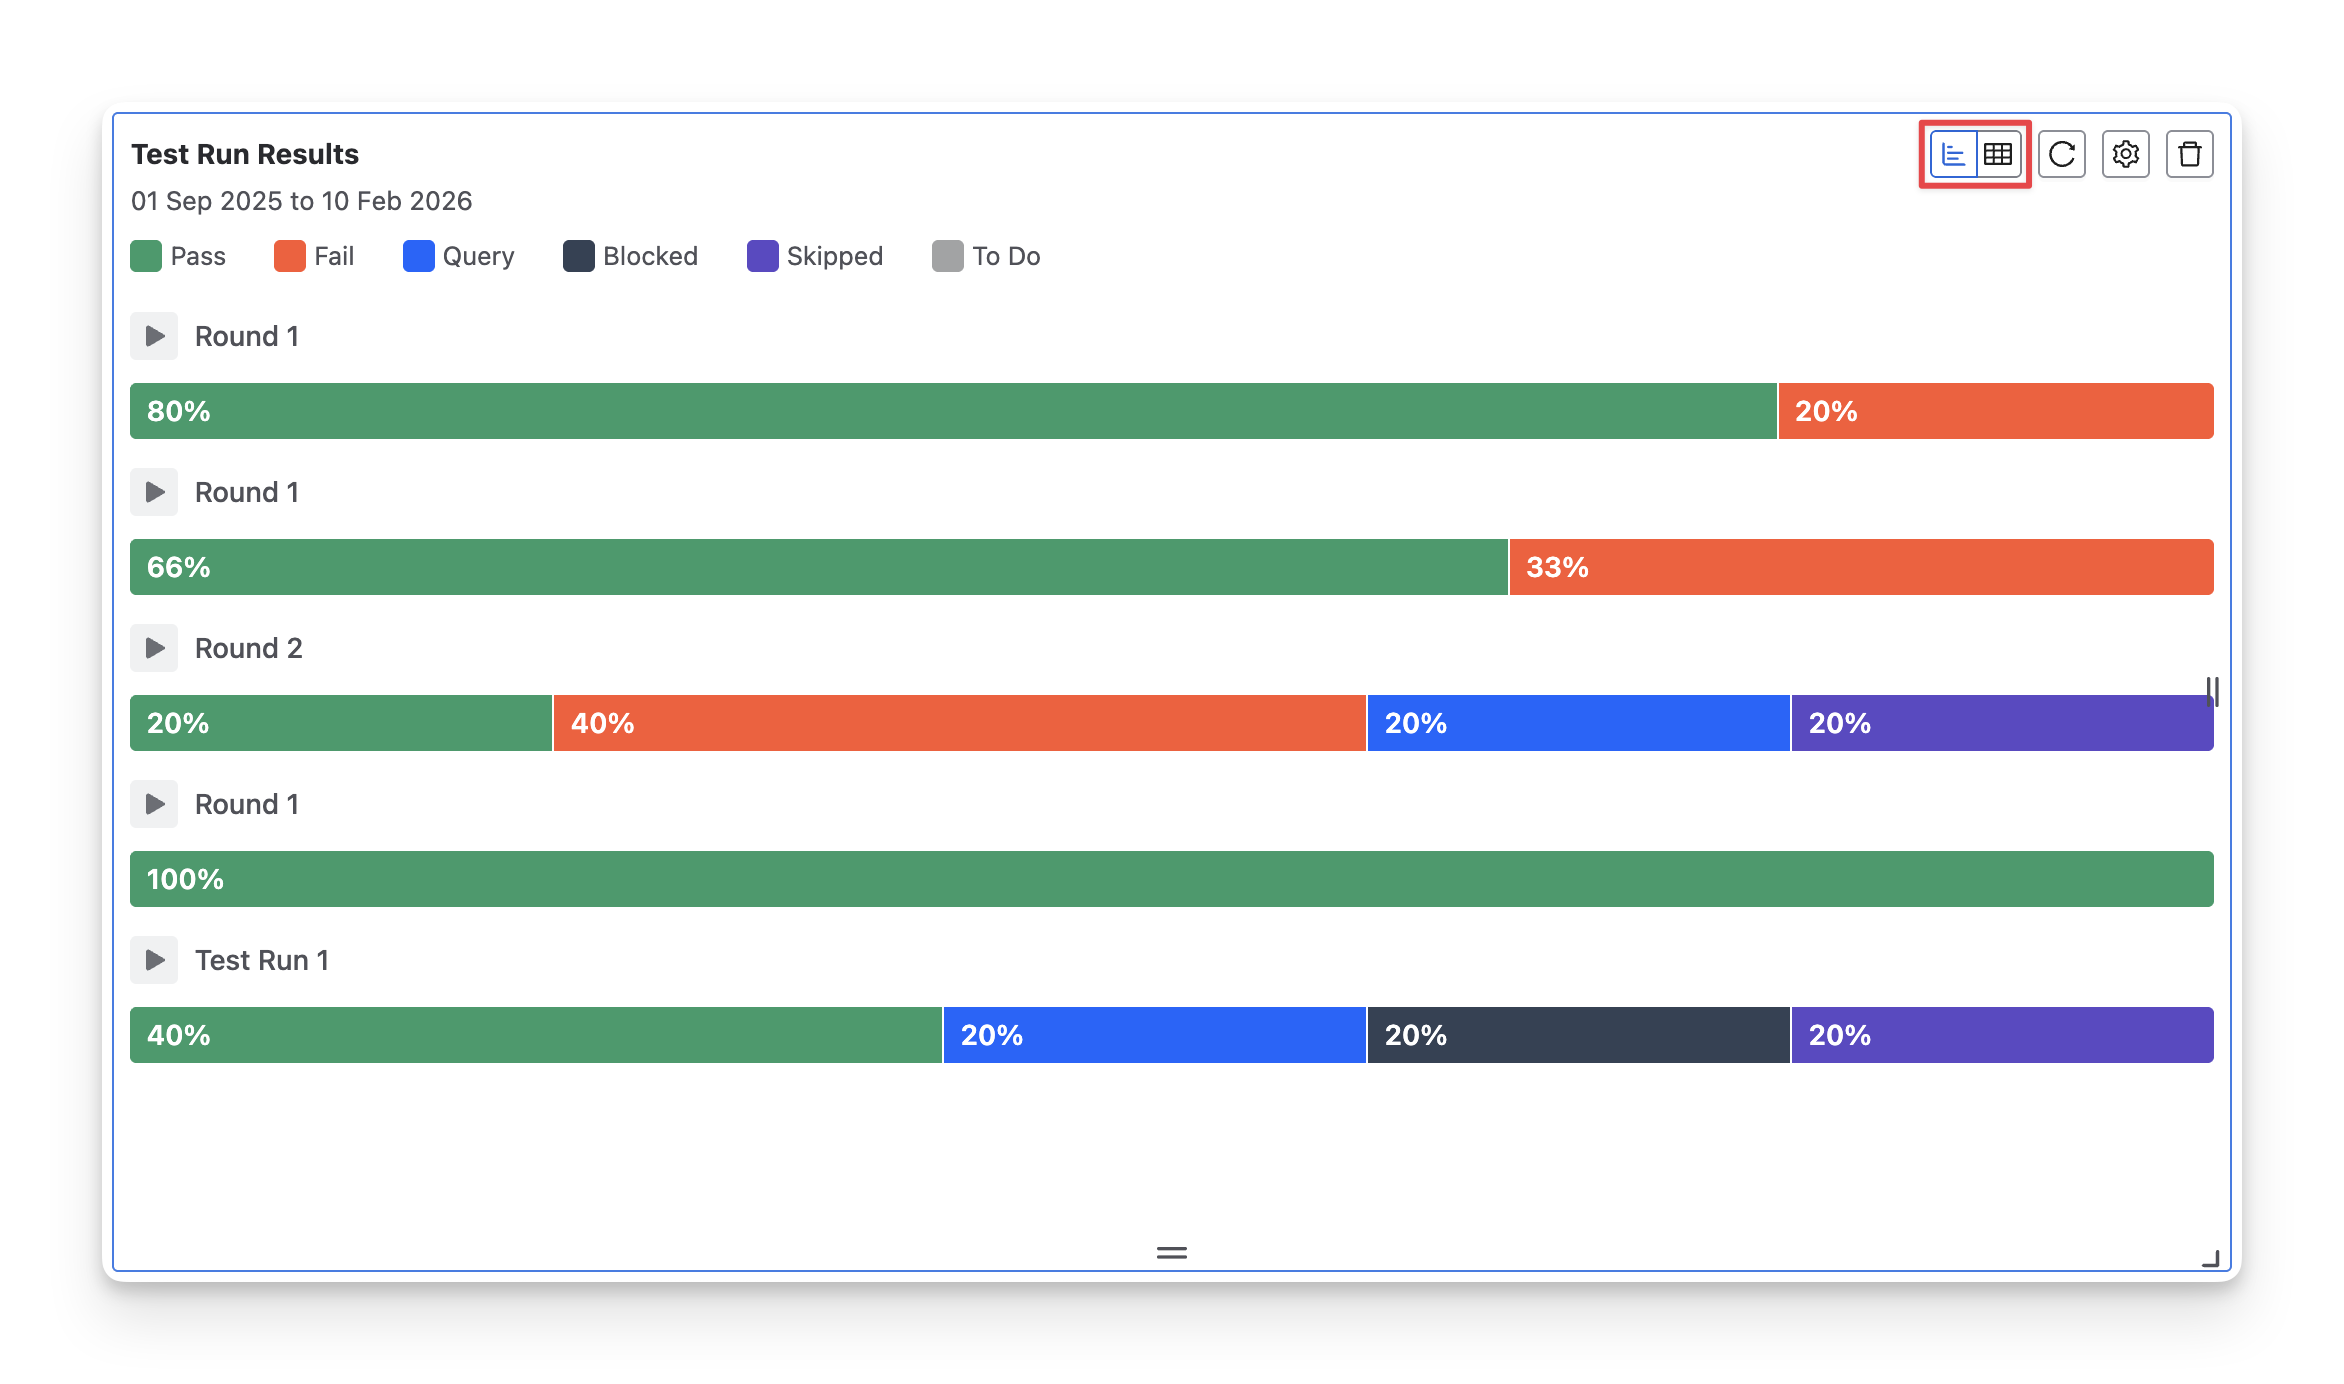
1.1 Chart Format
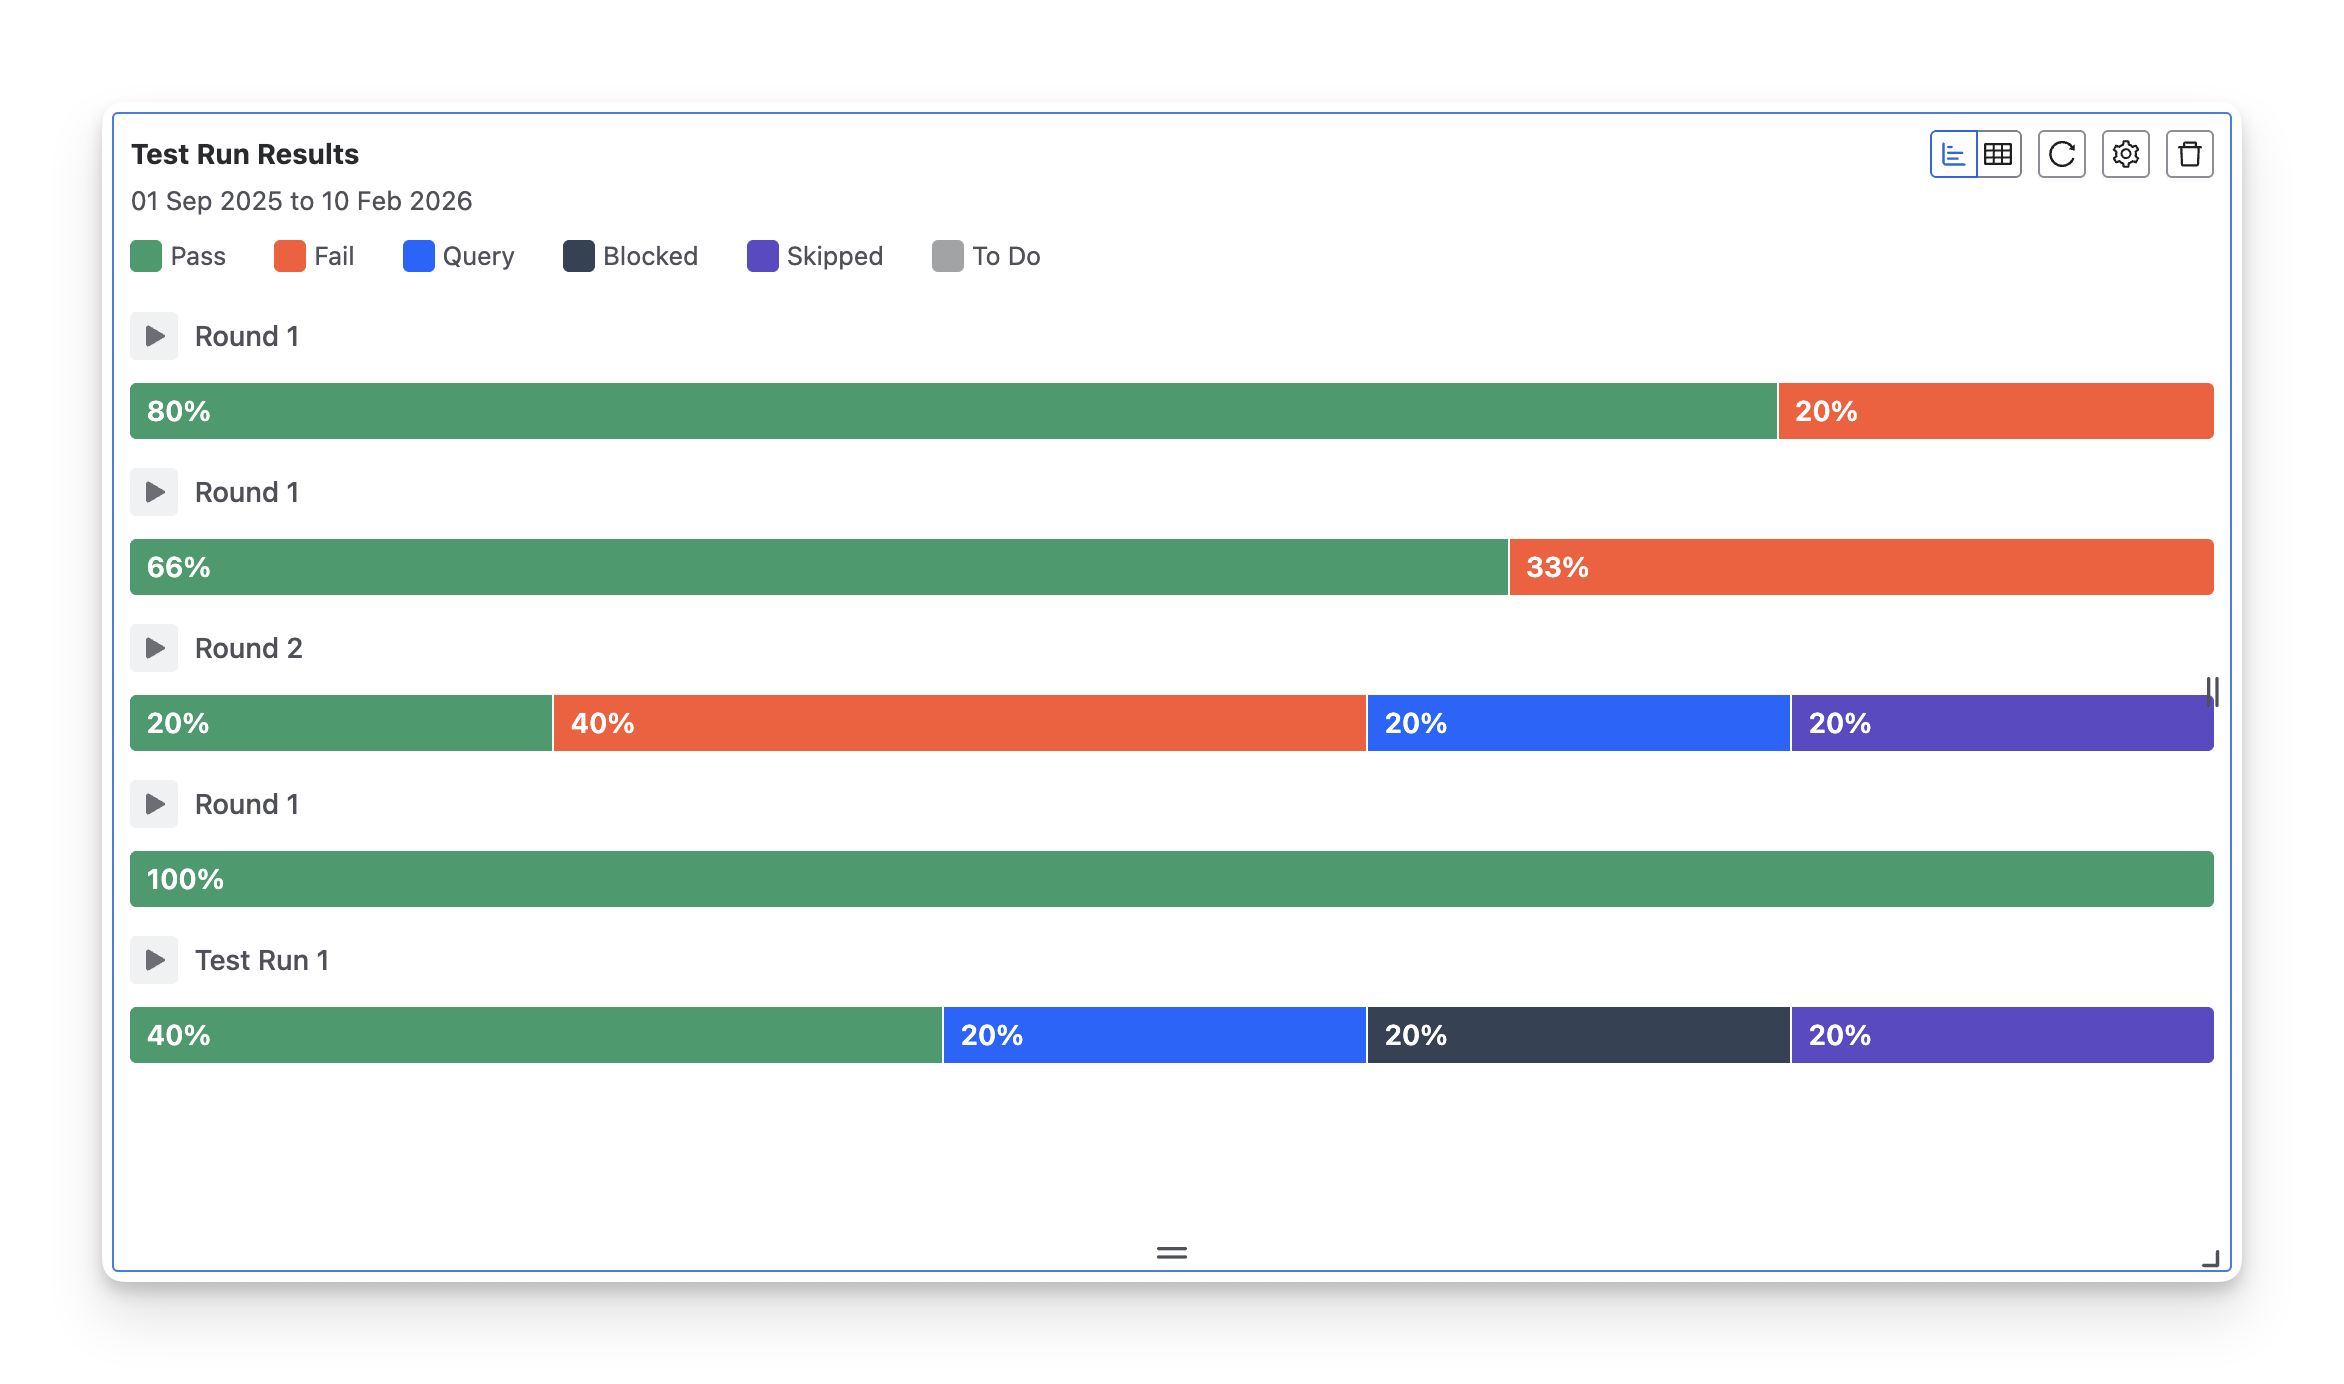
The Test Run Results chart presents each test run as a horizontal stacked bar; each bar shows the percentage of test items in different execution statuses ( Fail pass skipped blocked query todo ).
This format is particularly useful when you need to:
-
Identify problem test runs early: Spot test runs with a high percentage of Fail blocked query statuses, so critical issues can be investigated and resolved before they impact later test cycles.
-
Compare results across execution rounds: Compare multiple test runs to see whether quality is improving, regressing, or remaining unstable between rounds.
-
Communicate test status clearly: Use the visual breakdown to provide stakeholders and team leads with a clear, easy-to-understand summary of test run results during reviews, stand-ups, or release readiness discussions.
1.2 Table Format
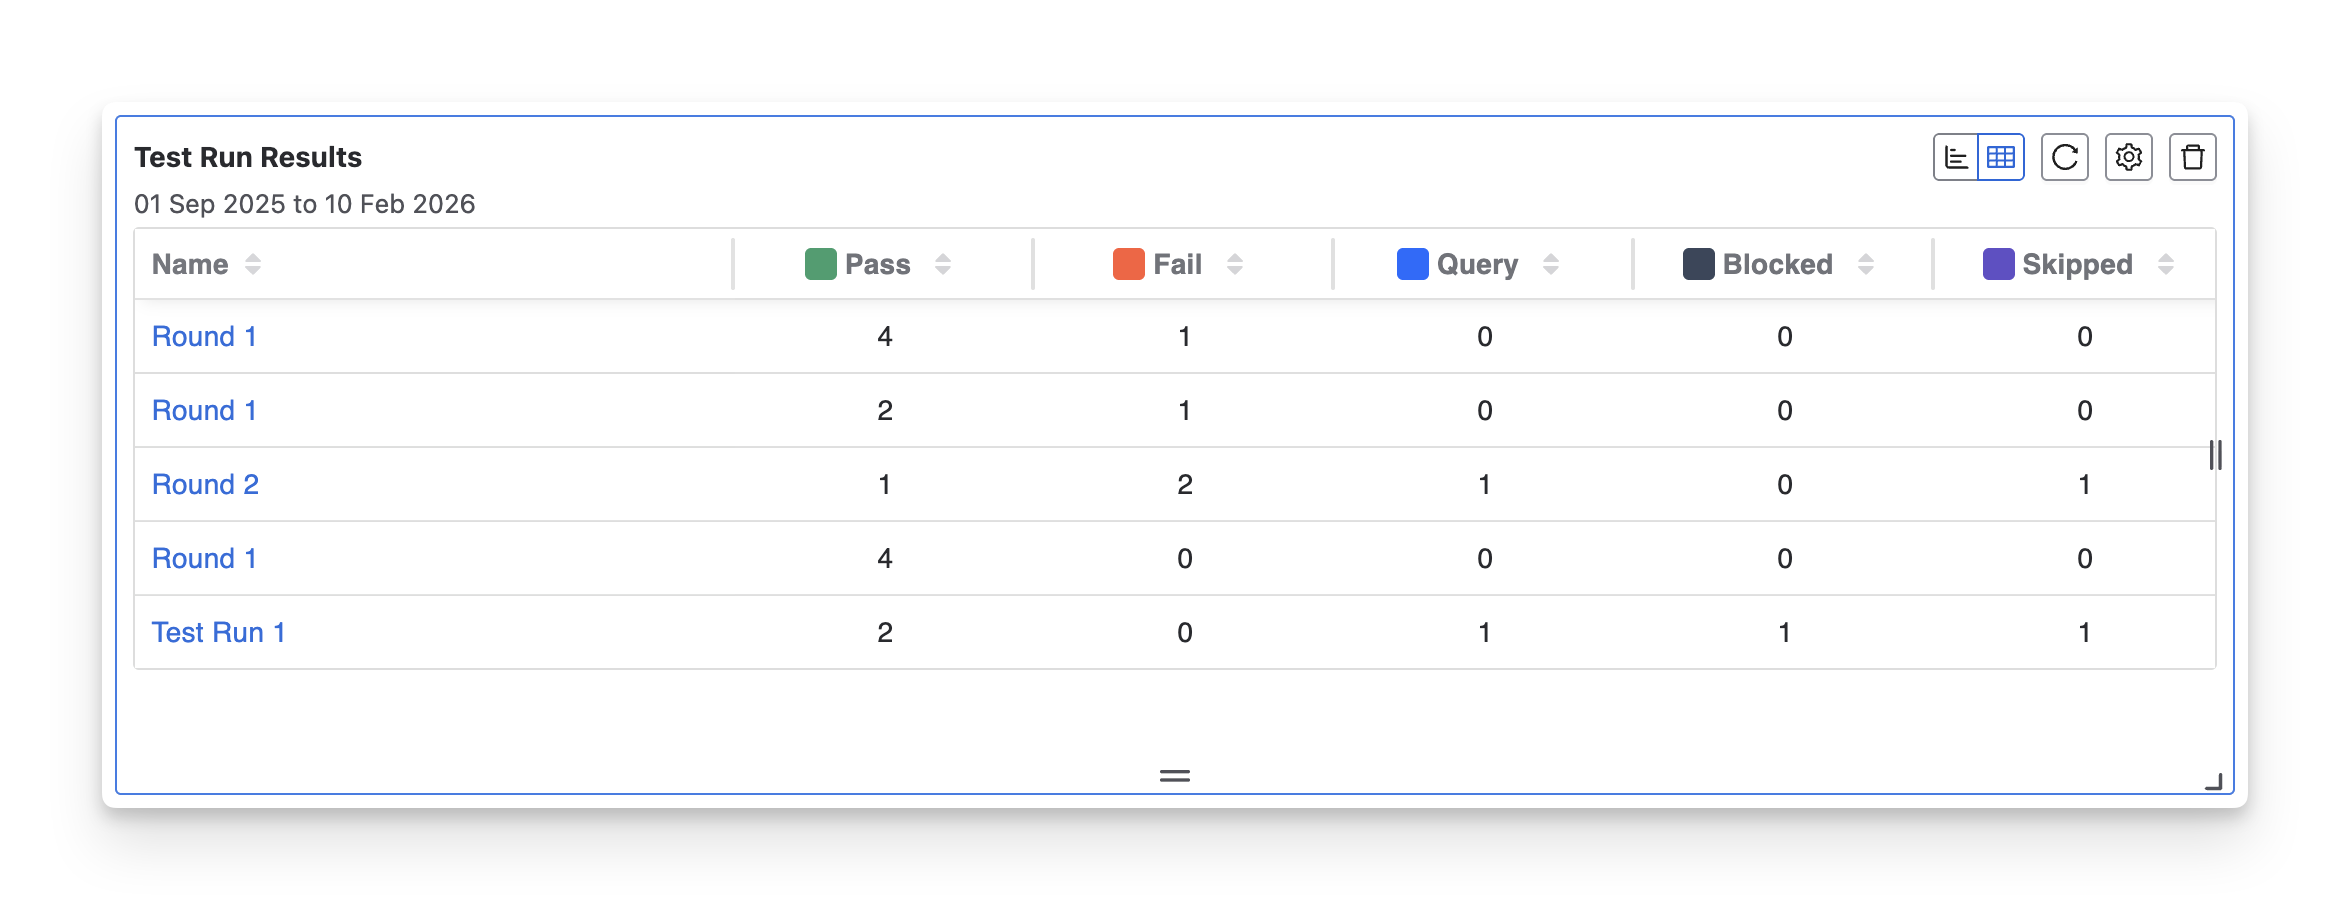
The Test Run Results table presents test run results in a structured, row-by-row view, where each row represents a test run, and each column shows the exact number of test run items in each executed status ( Fail pass skipped blocked query todo ).
This format is particularly useful when you need to:
-
Get detailed execution data: The table view provides a clear, numeric breakdown of test run results, showing the exact number of test cases in each status for every test run. This level of detail is ideal for monitoring progress and investigating issues.
-
Track specific test run progress: Easily compare multiple test runs side by side to understand how execution results evolve across rounds. This helps QA teams identify unstable runs, recurring failures, or executions that require additional testing effort before moving forward.
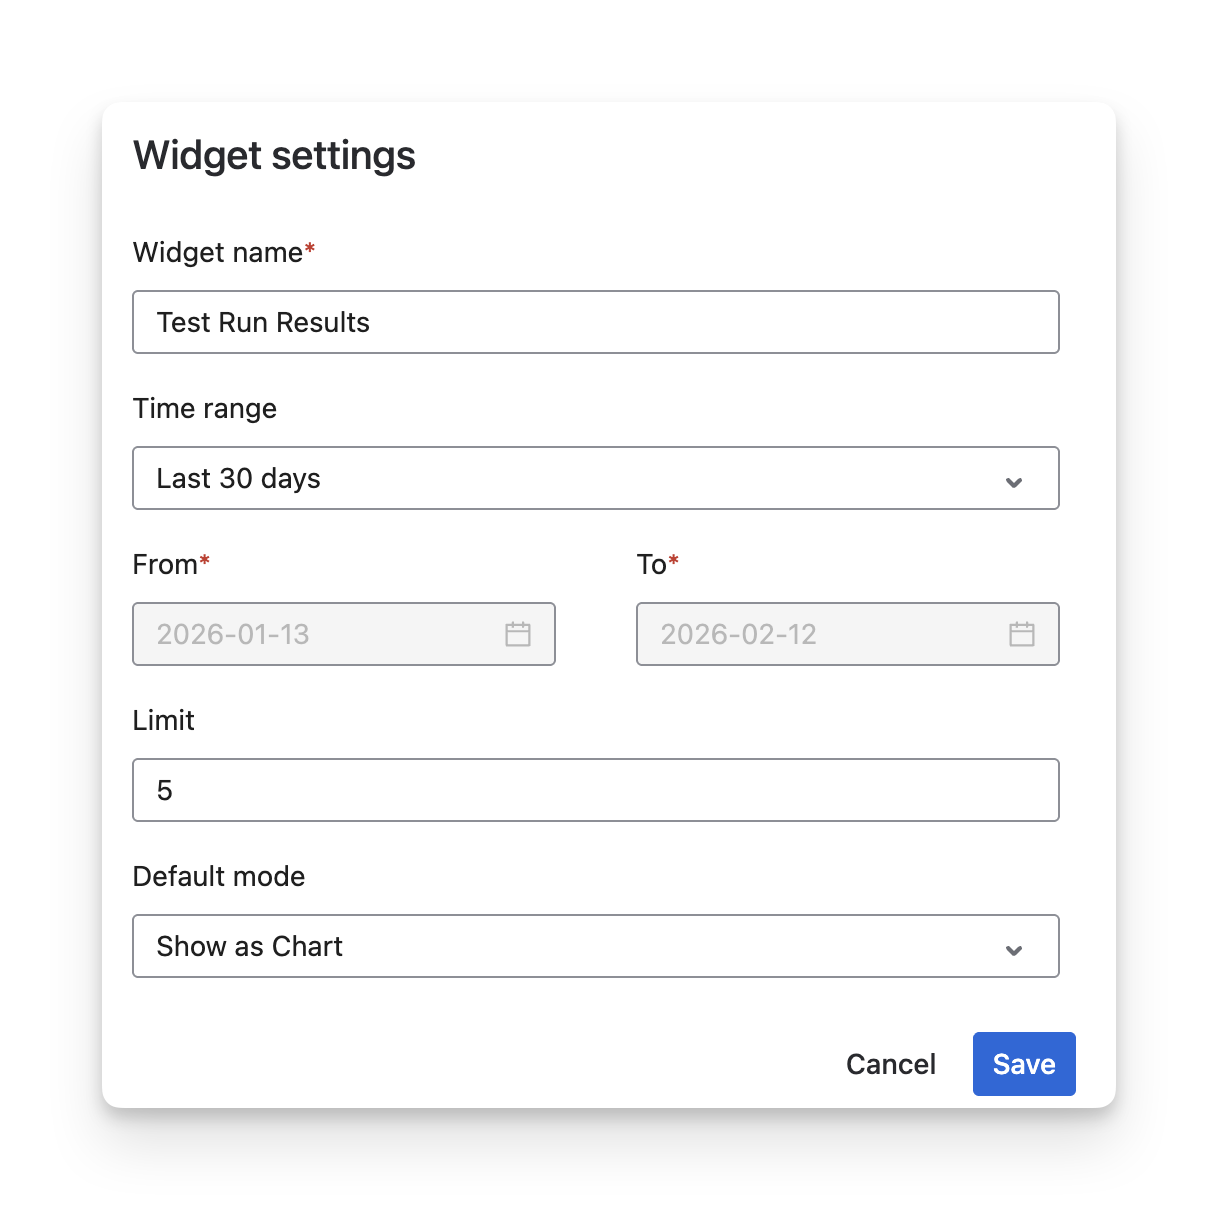
2. Configurations
-
Rename the widget to reflect your reporting purpose.
-
Select a time range using presets or define a custom From–To date range to control the reporting period.
-
Limit the number of test runs displayed to focus on the most recent or most relevant results.
-
Choose the default display mode (Chart or Table) depending on whether you prefer a visual overview or detailed data.
Should you need any assistance or further AgileTest inquiries, contact our 24/7 Support Desk!