Priority Matrix
What is the prioritization matrix?
A prioritization matrix is a tool that helps individuals or teams prioritize and make decisions by visually mapping out various options or tasks according to their relative importance or urgency. It is a two-dimensional grid that provides a clear and objective way to rank and compare different options.
The prioritization matrix typically has two axes, with each axis representing a different dimension that is important for the decision-making process.
For example, the x-axis may represent the importance of a task or option, while the y-axis may represent the urgency or impact of the task or option. Other dimensions that may be used include cost, risk, complexity, or feasibility.
1. Toolbar
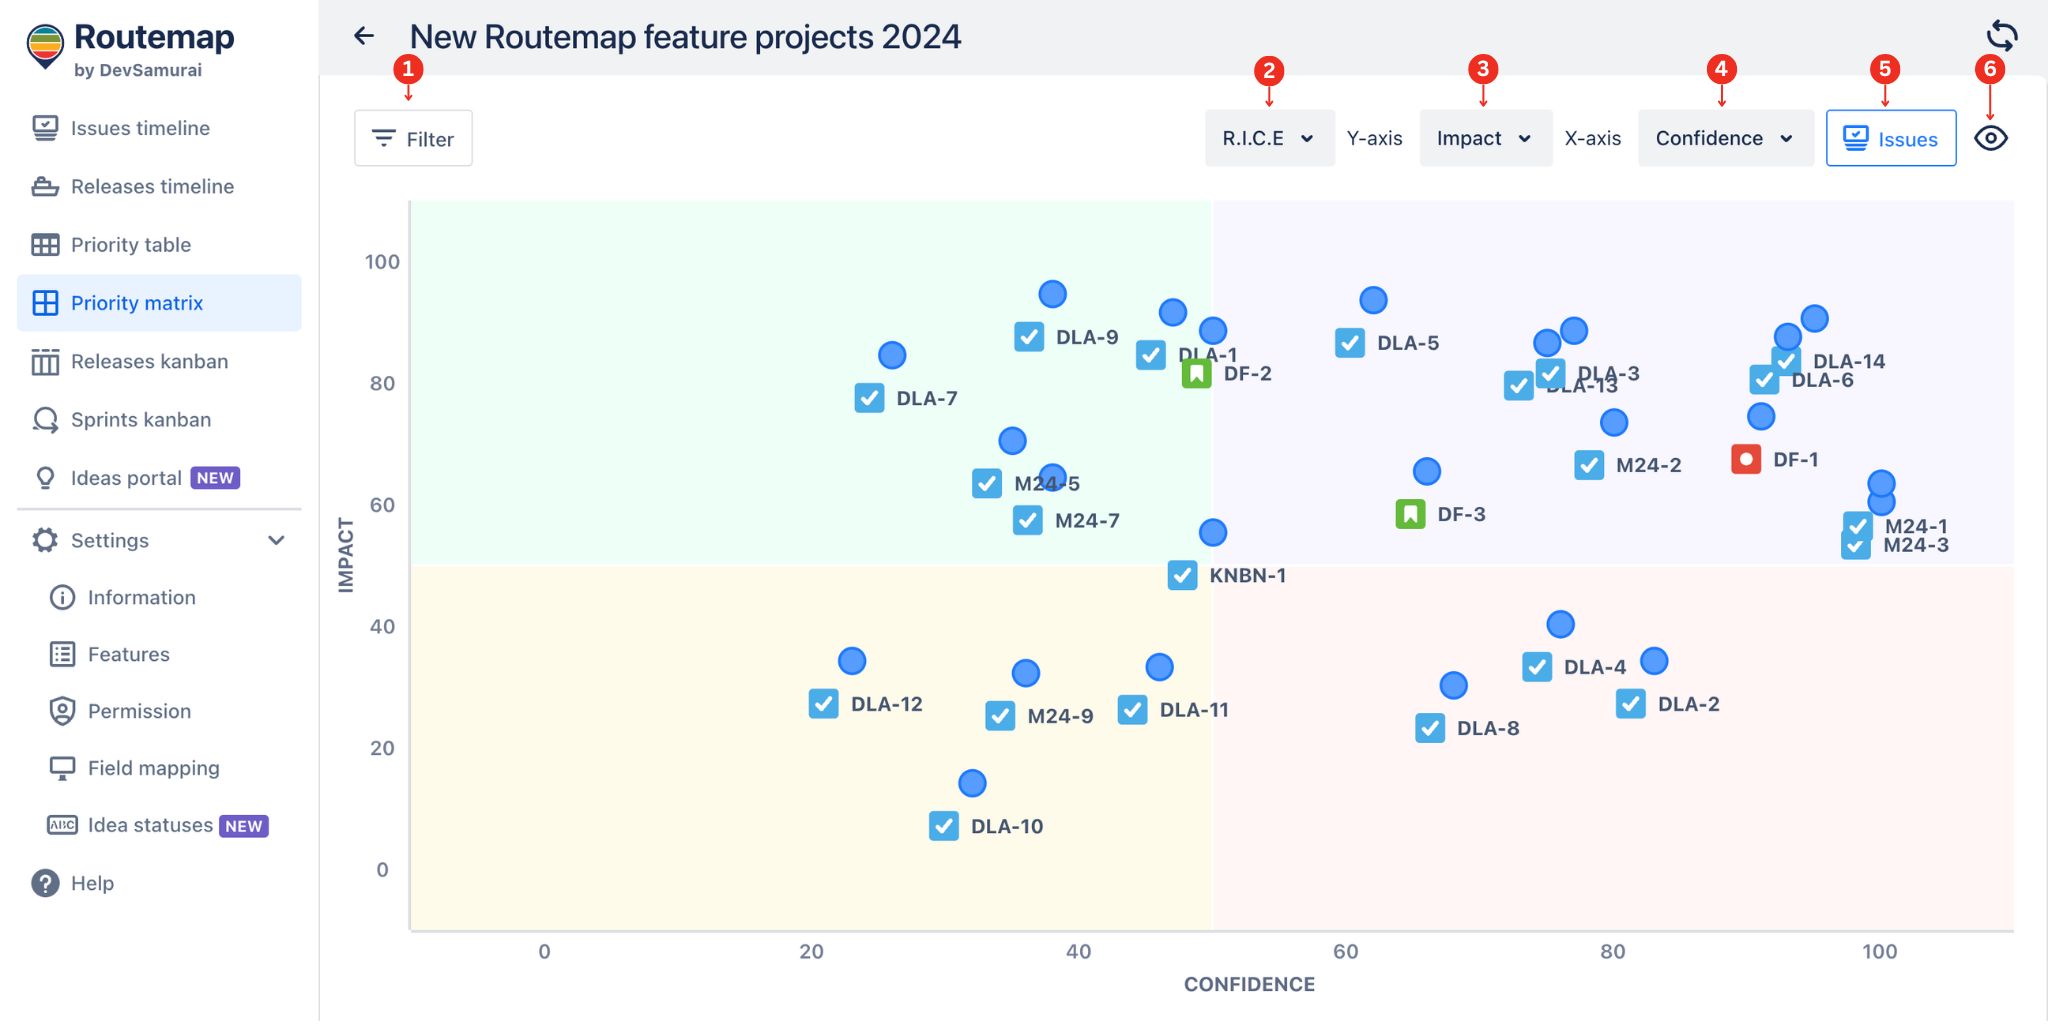
Again, let’s take a look at the toolbar to help you work with the prioritization matrix.

| 1 | Filter | Render the Priority matrix view based on projects, issue types, issue status, and assignee. You can also use JQL as an advanced filtering method. |
| 2 | Change prioritization method | Allow you to switch between the Value vs. Effort and R.I.C.E prioritization method. |
| 3 | Y-axis | Visualize the value of the chosen prioritization method vertically. |
| 4 | X-axis | Visualize the value of the chosen prioritization method horizontally. |
| 5 | Issues box | Contain all Jira issues from multiple projects where you can drag them into the Priority matrix. |
| 6 | Display settings | Toggle on/off the matrix quadrants for a cleaner view. |
2. Work on the Prioritization matrix
You can start with filtering data for the issues on the matrix using the basic filter or advanced JQL.
.jpg?inst-v=6f1537b8-5137-4e8a-bedd-e0259ff63494)
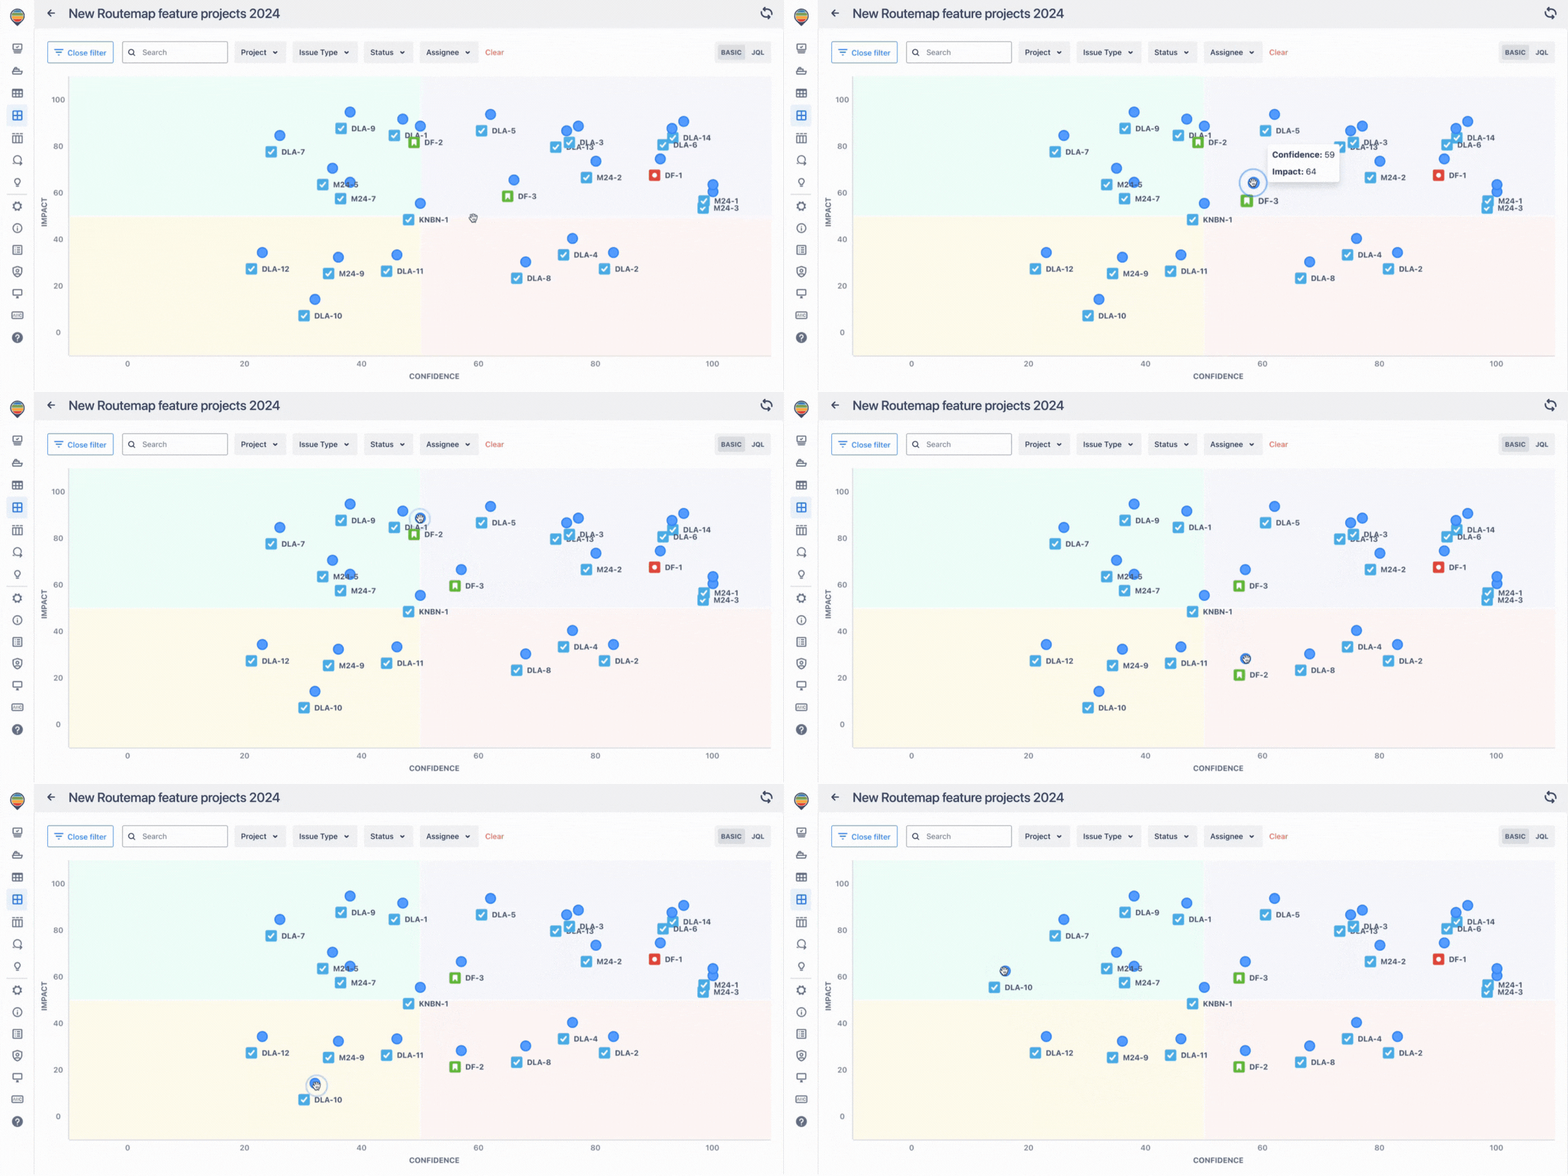
If you’ve already made prioritization in the table, the ticket’s values will also appear in the value fields accordingly. You can continue to drag and drop these tickets on the matrix to change the priority fields.

Remember that adjusting tickets on this matrix will apply new changes to their values in the Priority Table.
You can click on the issue key to show its details.
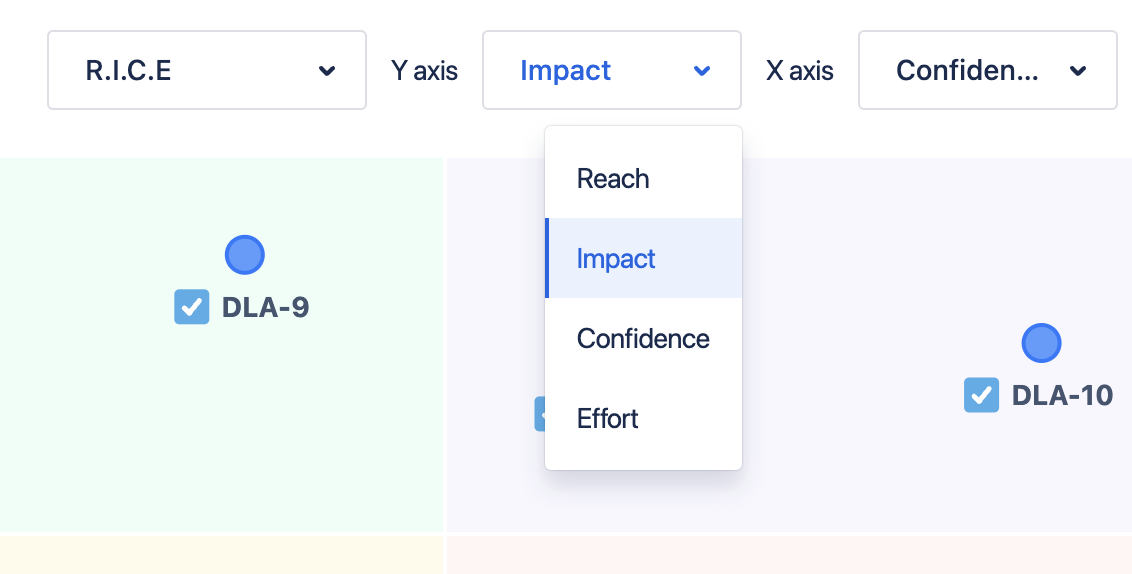
The Priority Matrix can only show 2 axes at a time. However, you can freely change the value of the x-axis or y-axis labels to the ones you need.

.png)