.png)
Personal Activities
The Personal Activity section lets you track your work, monitor your capacity, manage leave requests, and view visual reports of your performance. It helps you stay on top of your workload and manage your time effectively.
Overview
The Overview tab provides a snapshot of your key activities, including active projects, workload, scheduled tasks, time logs, and essential stats.
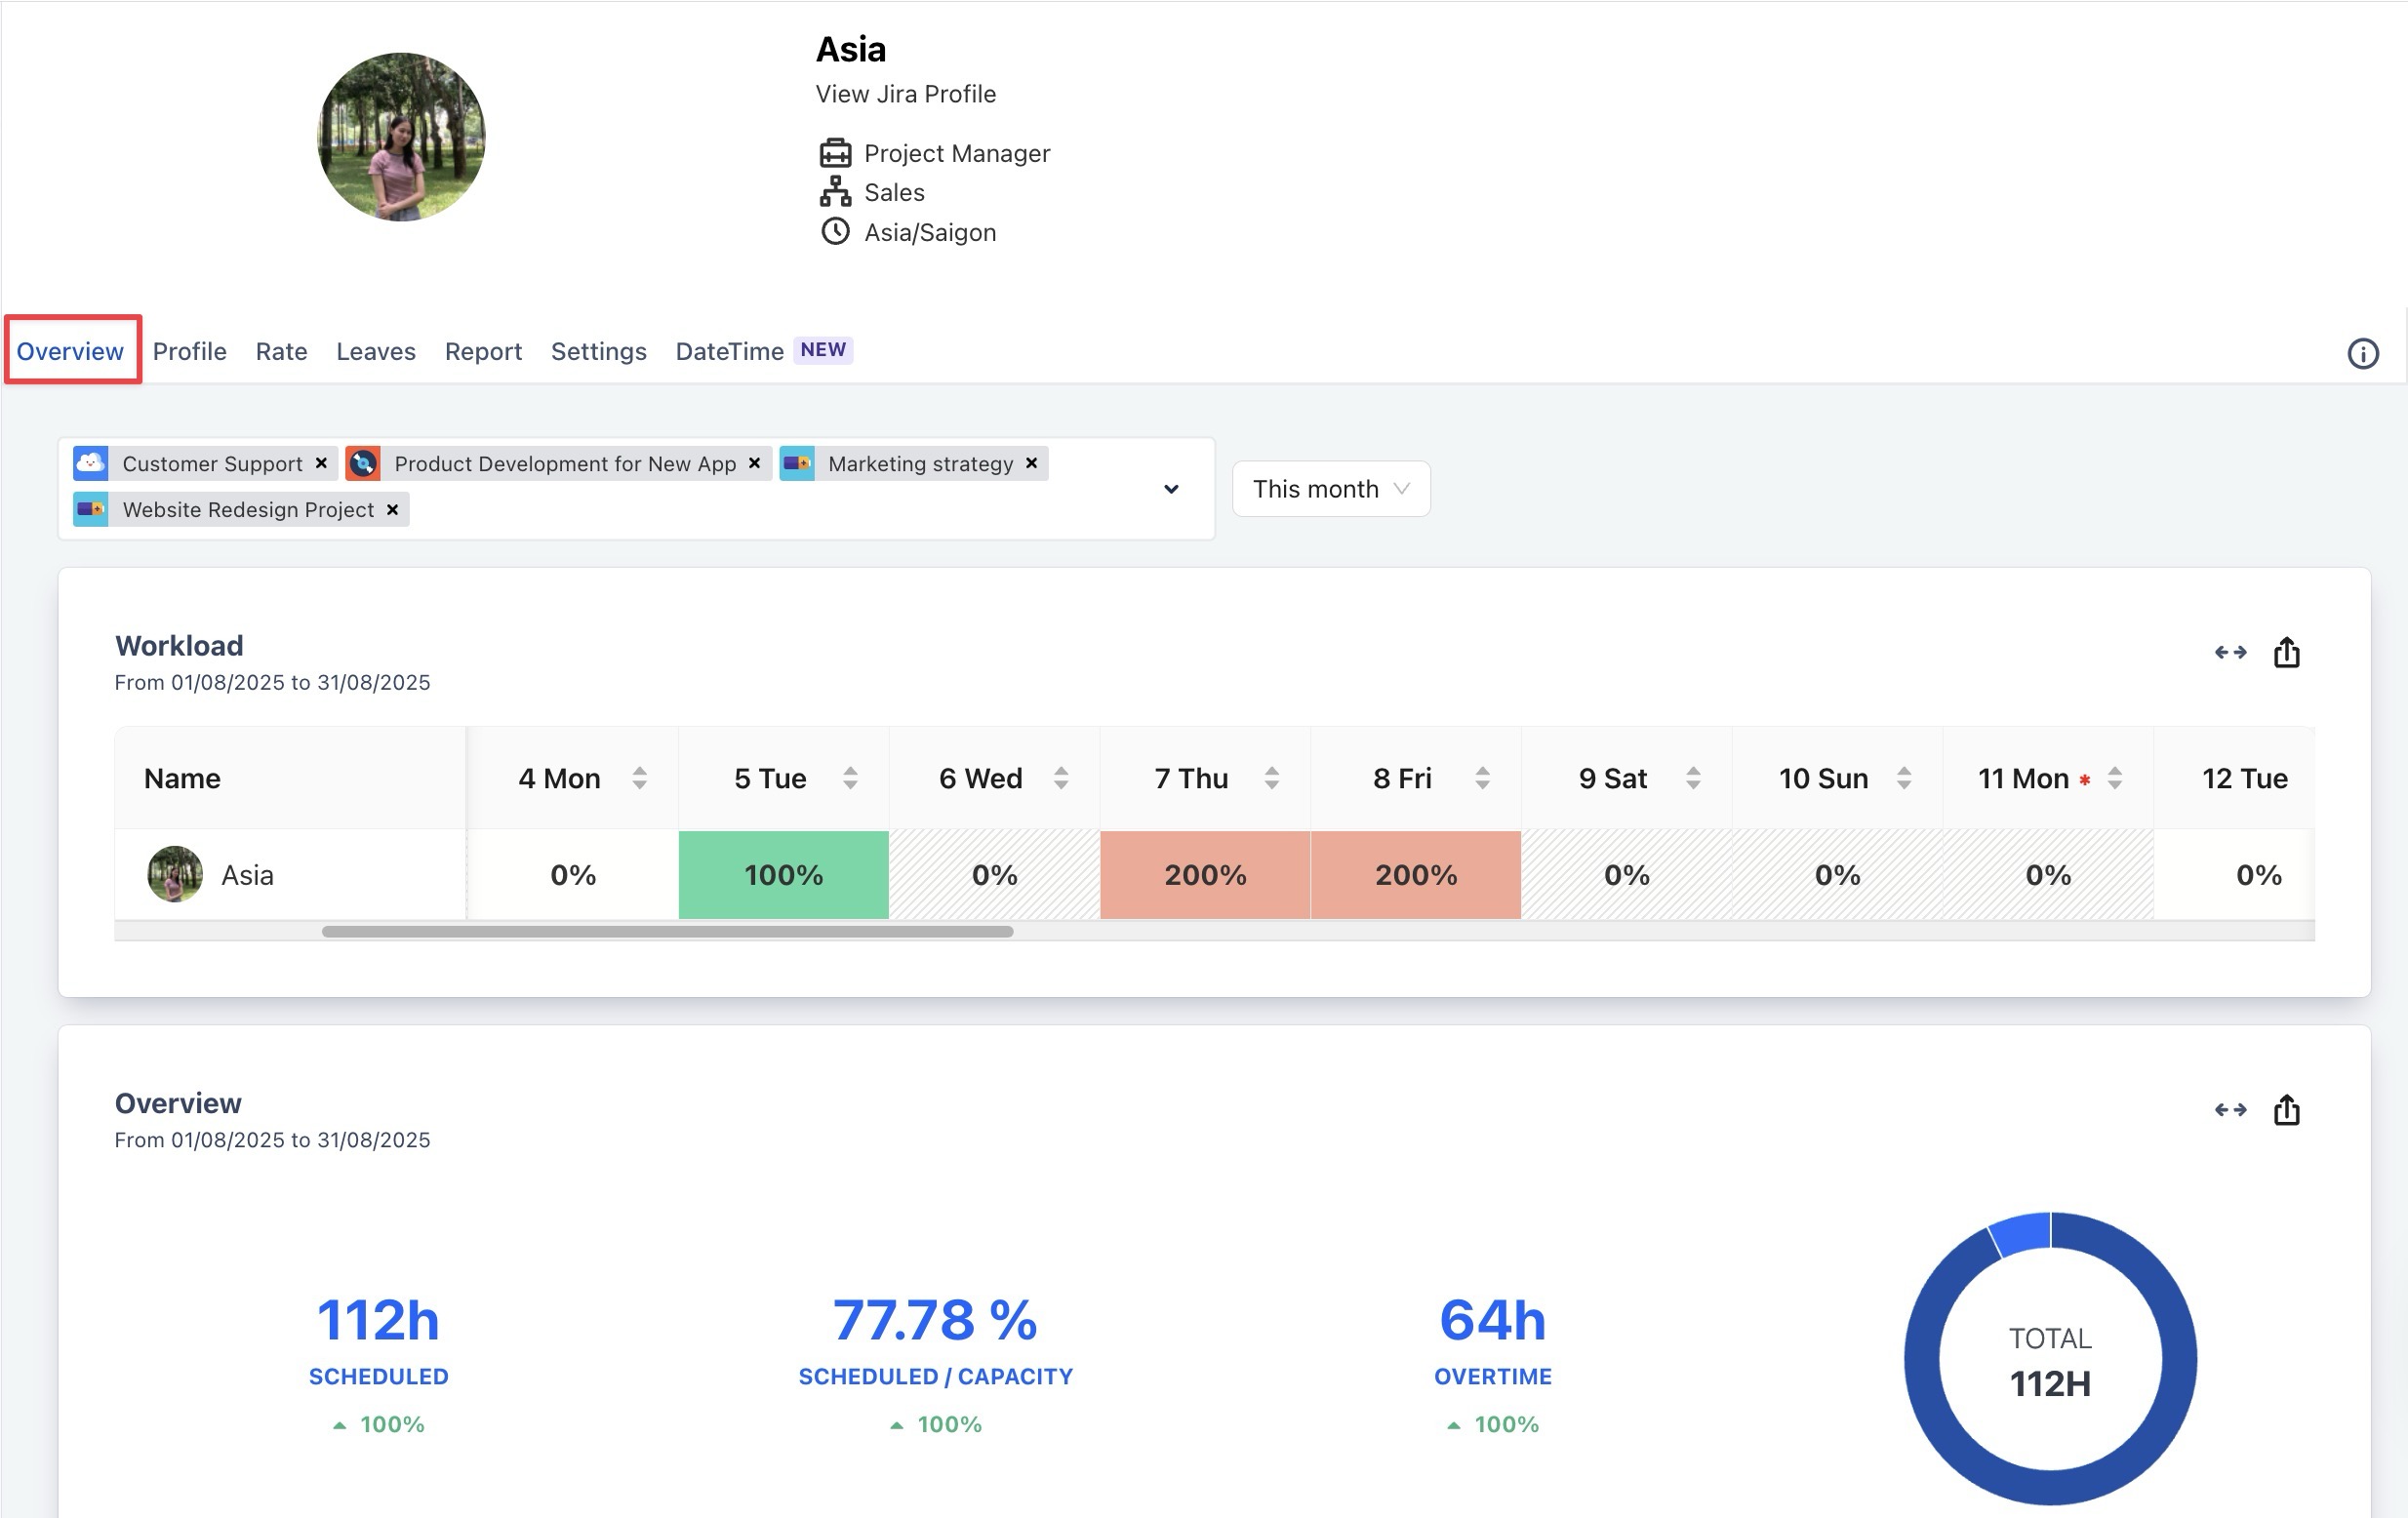
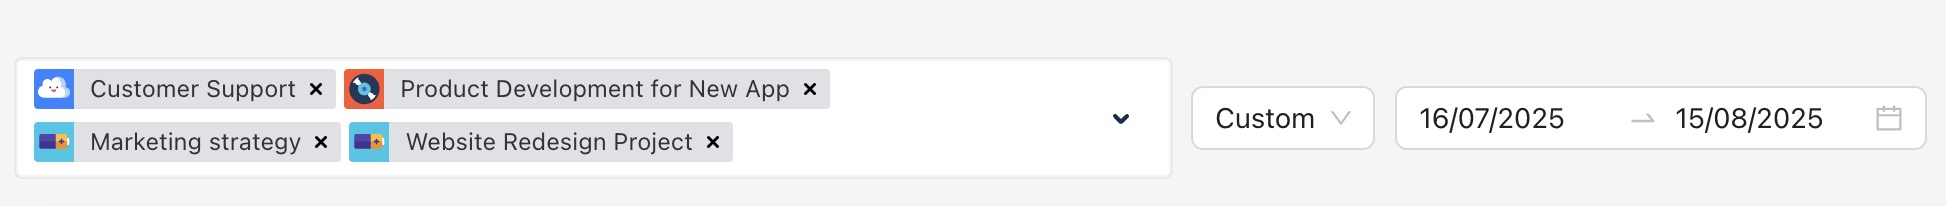
Filter Configuration: You can customize your data by selecting the project and date range you want to track.
This section includes the following sections:
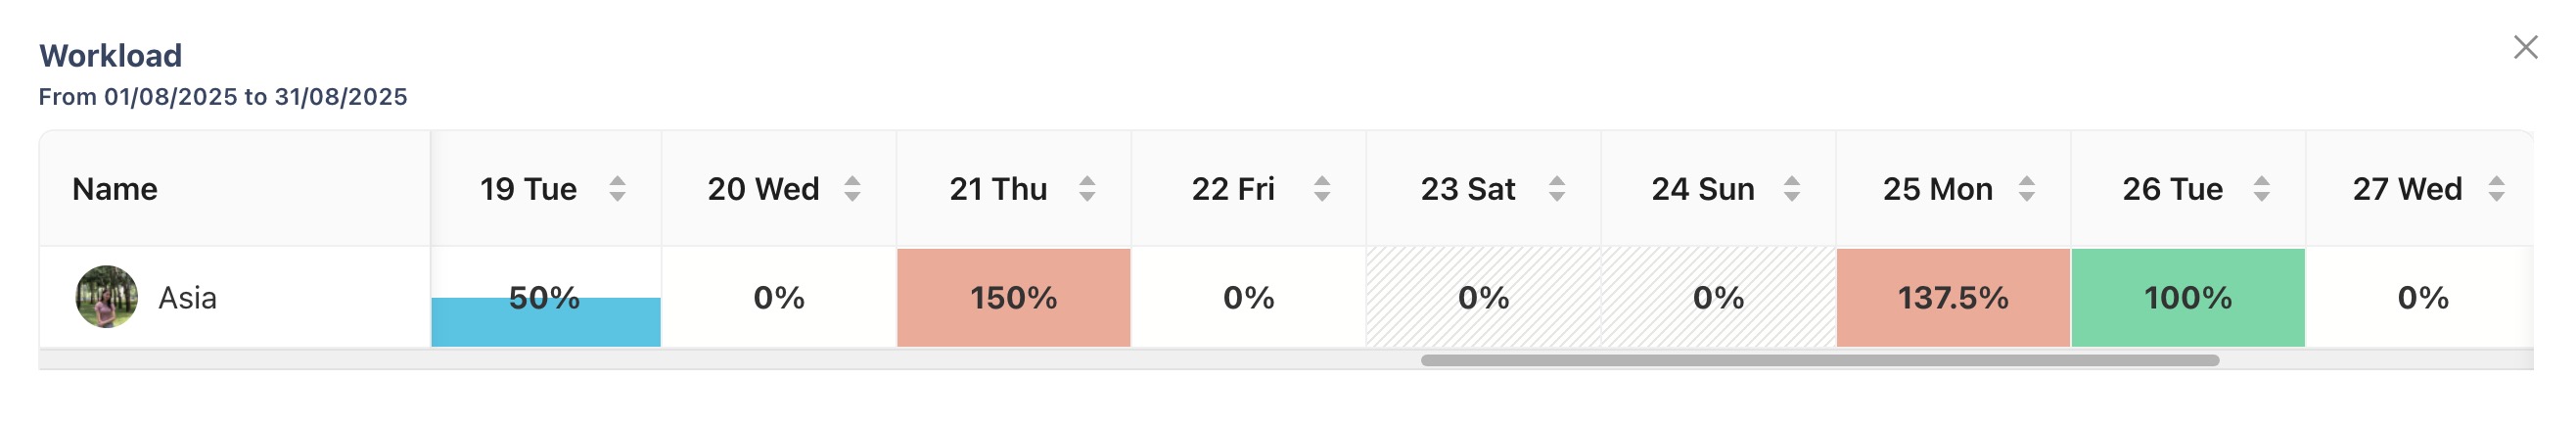
a. Workload
The Workload section displays the distribution of your tasks and capacity usage, enabling you to manage your workload effectively and avoid burnout or underutilization.
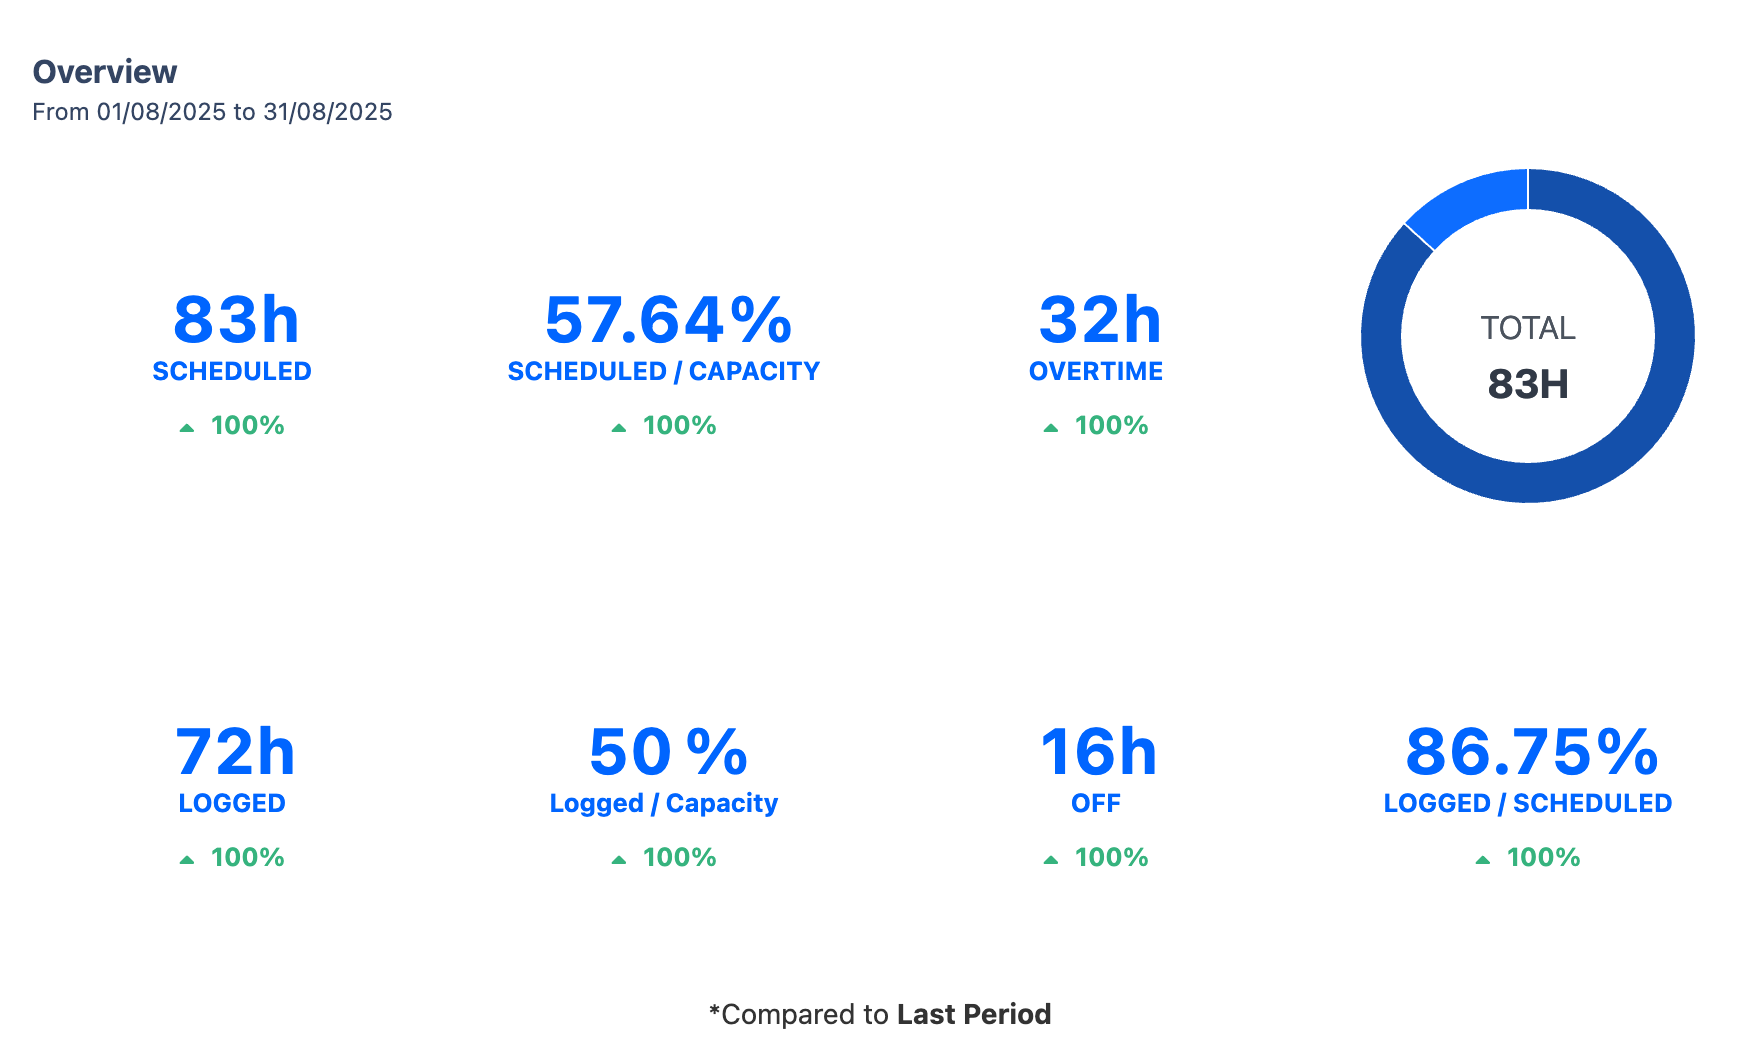
b. Overview
The Overview section provides a quick glance at your total work stats, including scheduled hours, overtime, and the overall total hours worked, helping you gauge your productivity and manage your time effectively.
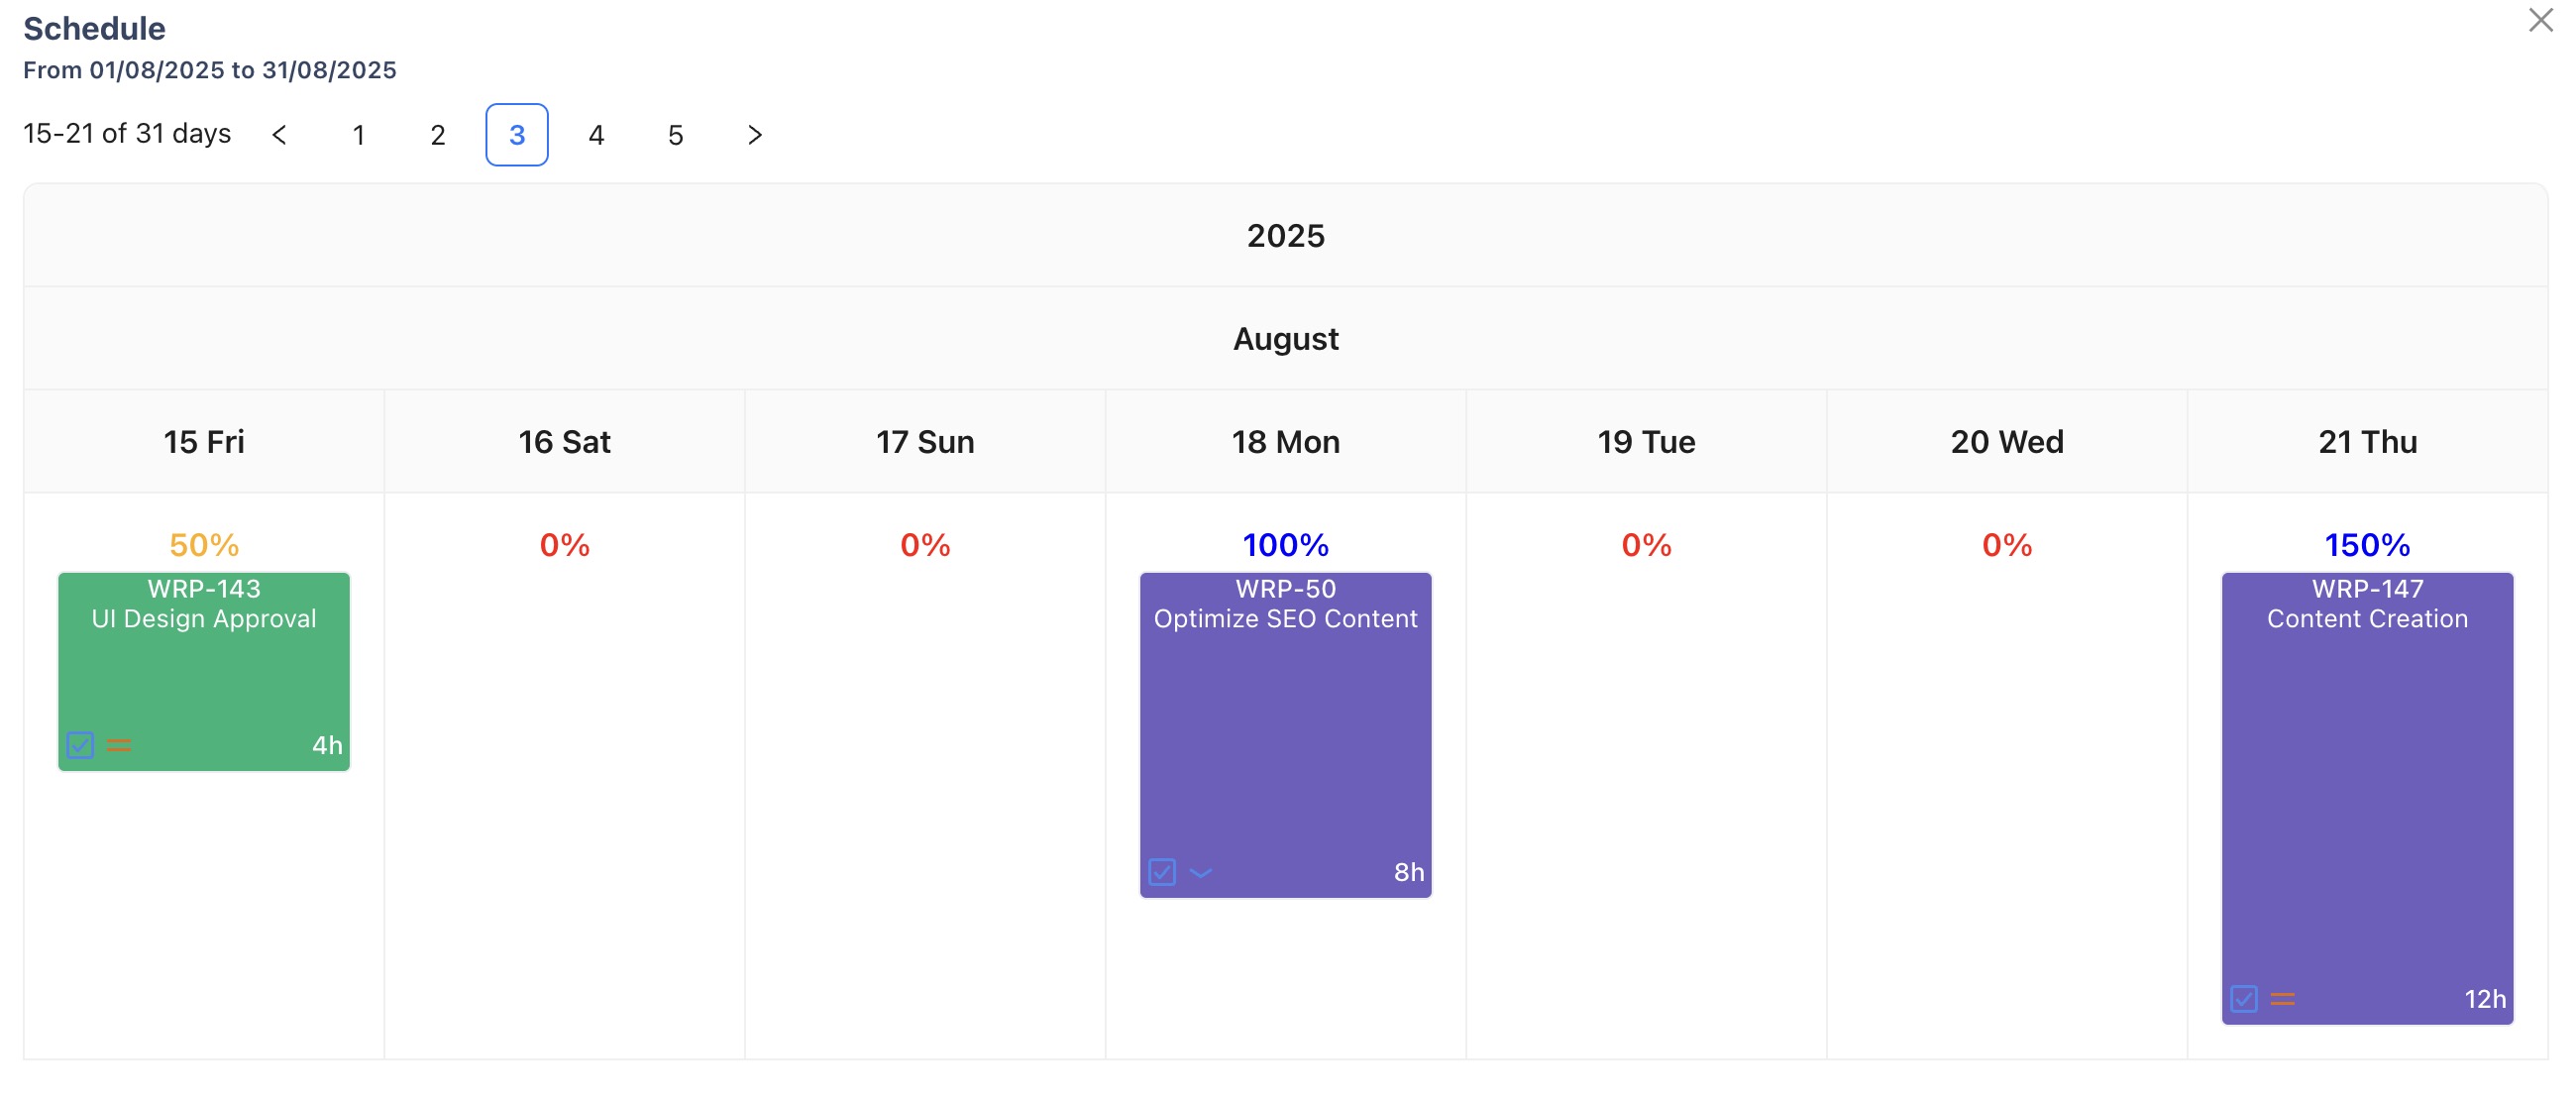
c. Schedule
The Schedule section provides a structured overview of your daily tasks and their allocated time, helping you manage your day effectively.
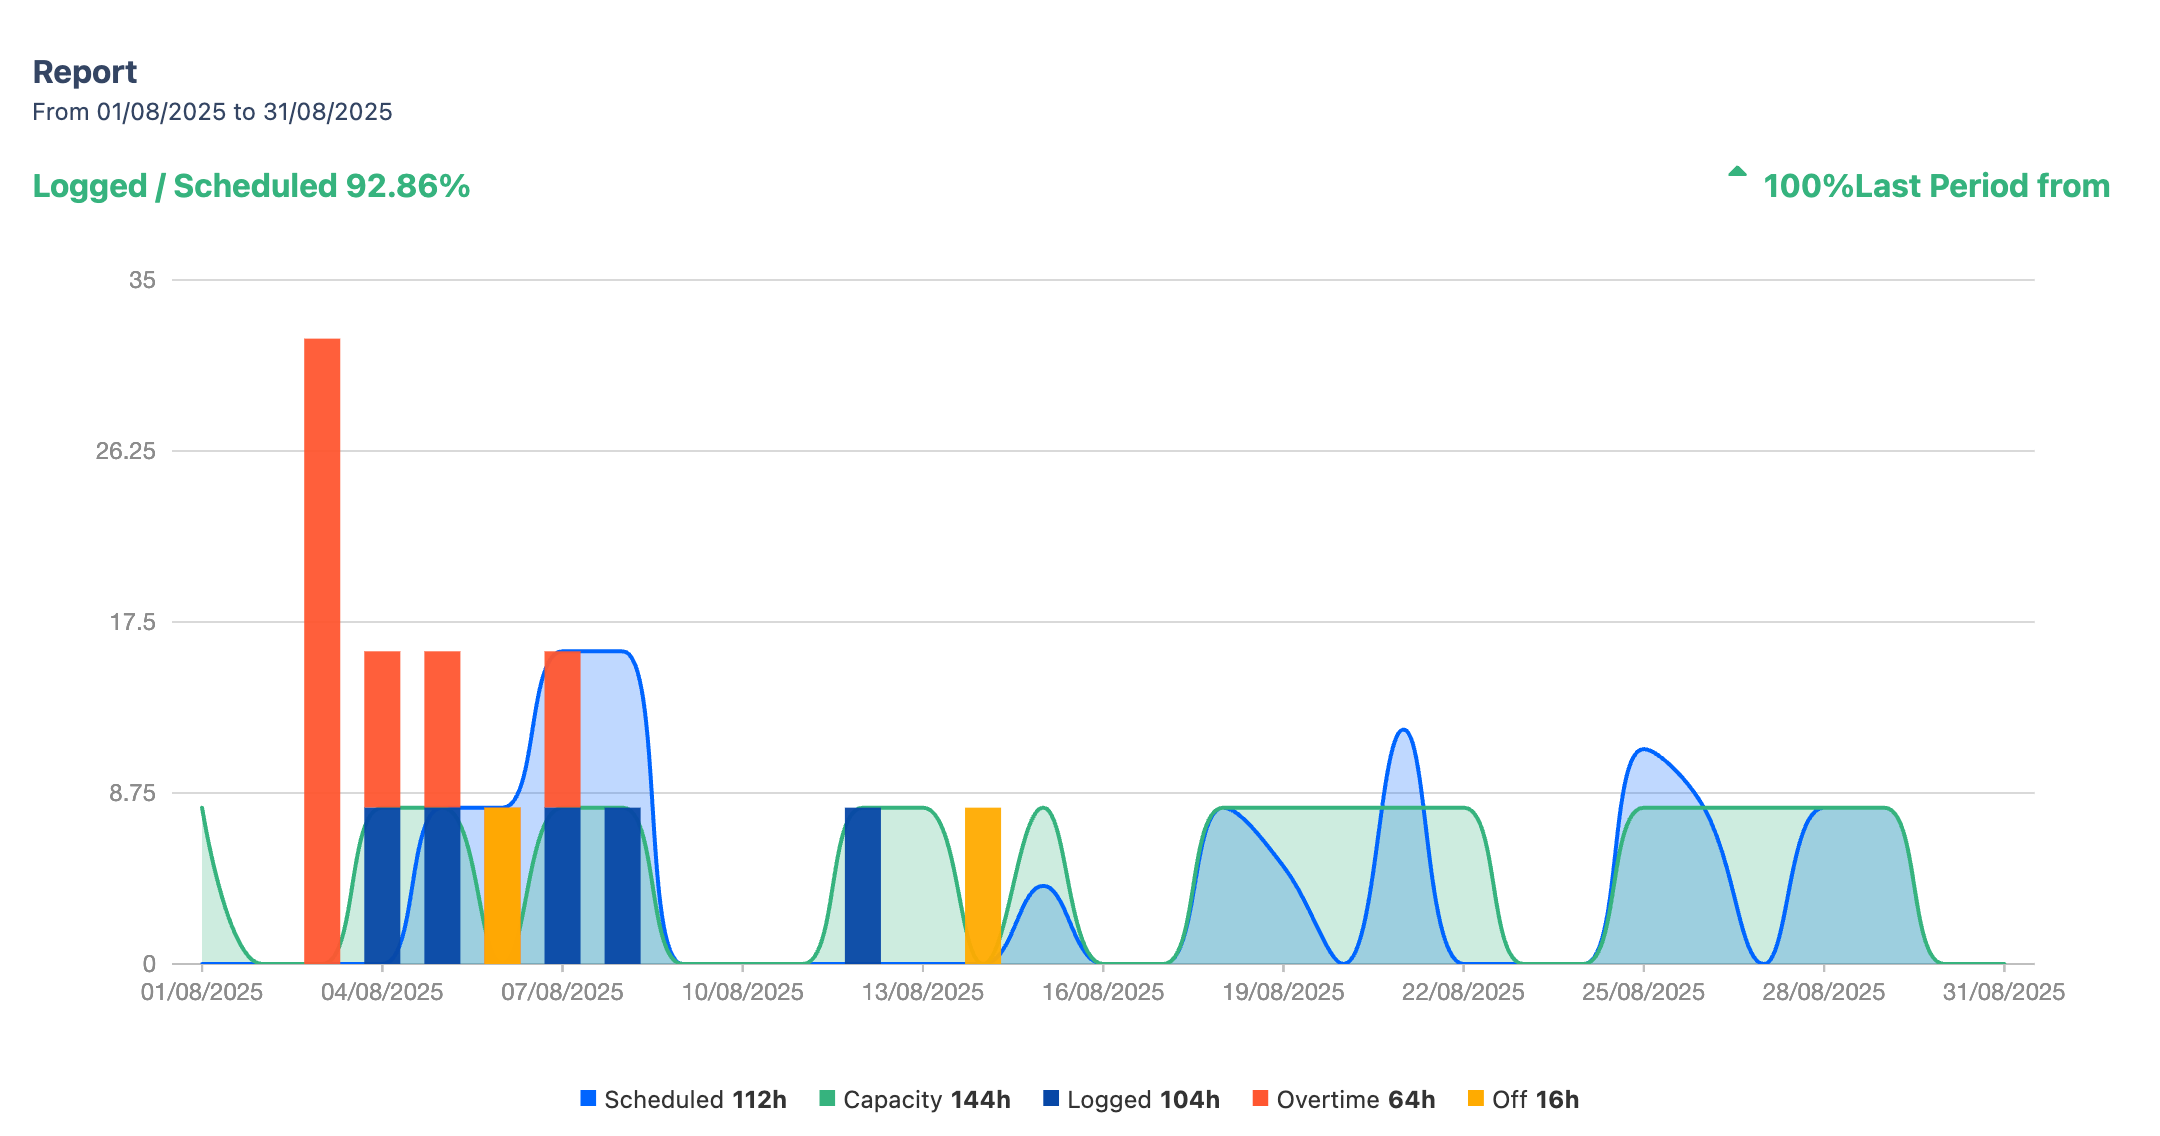
d. Report
The Report section provides a graphical representation and a visual overview of key metrics such as capacity, scheduled hours, logged hours, and time off, helping you track your time and identify any overtime or undertime.
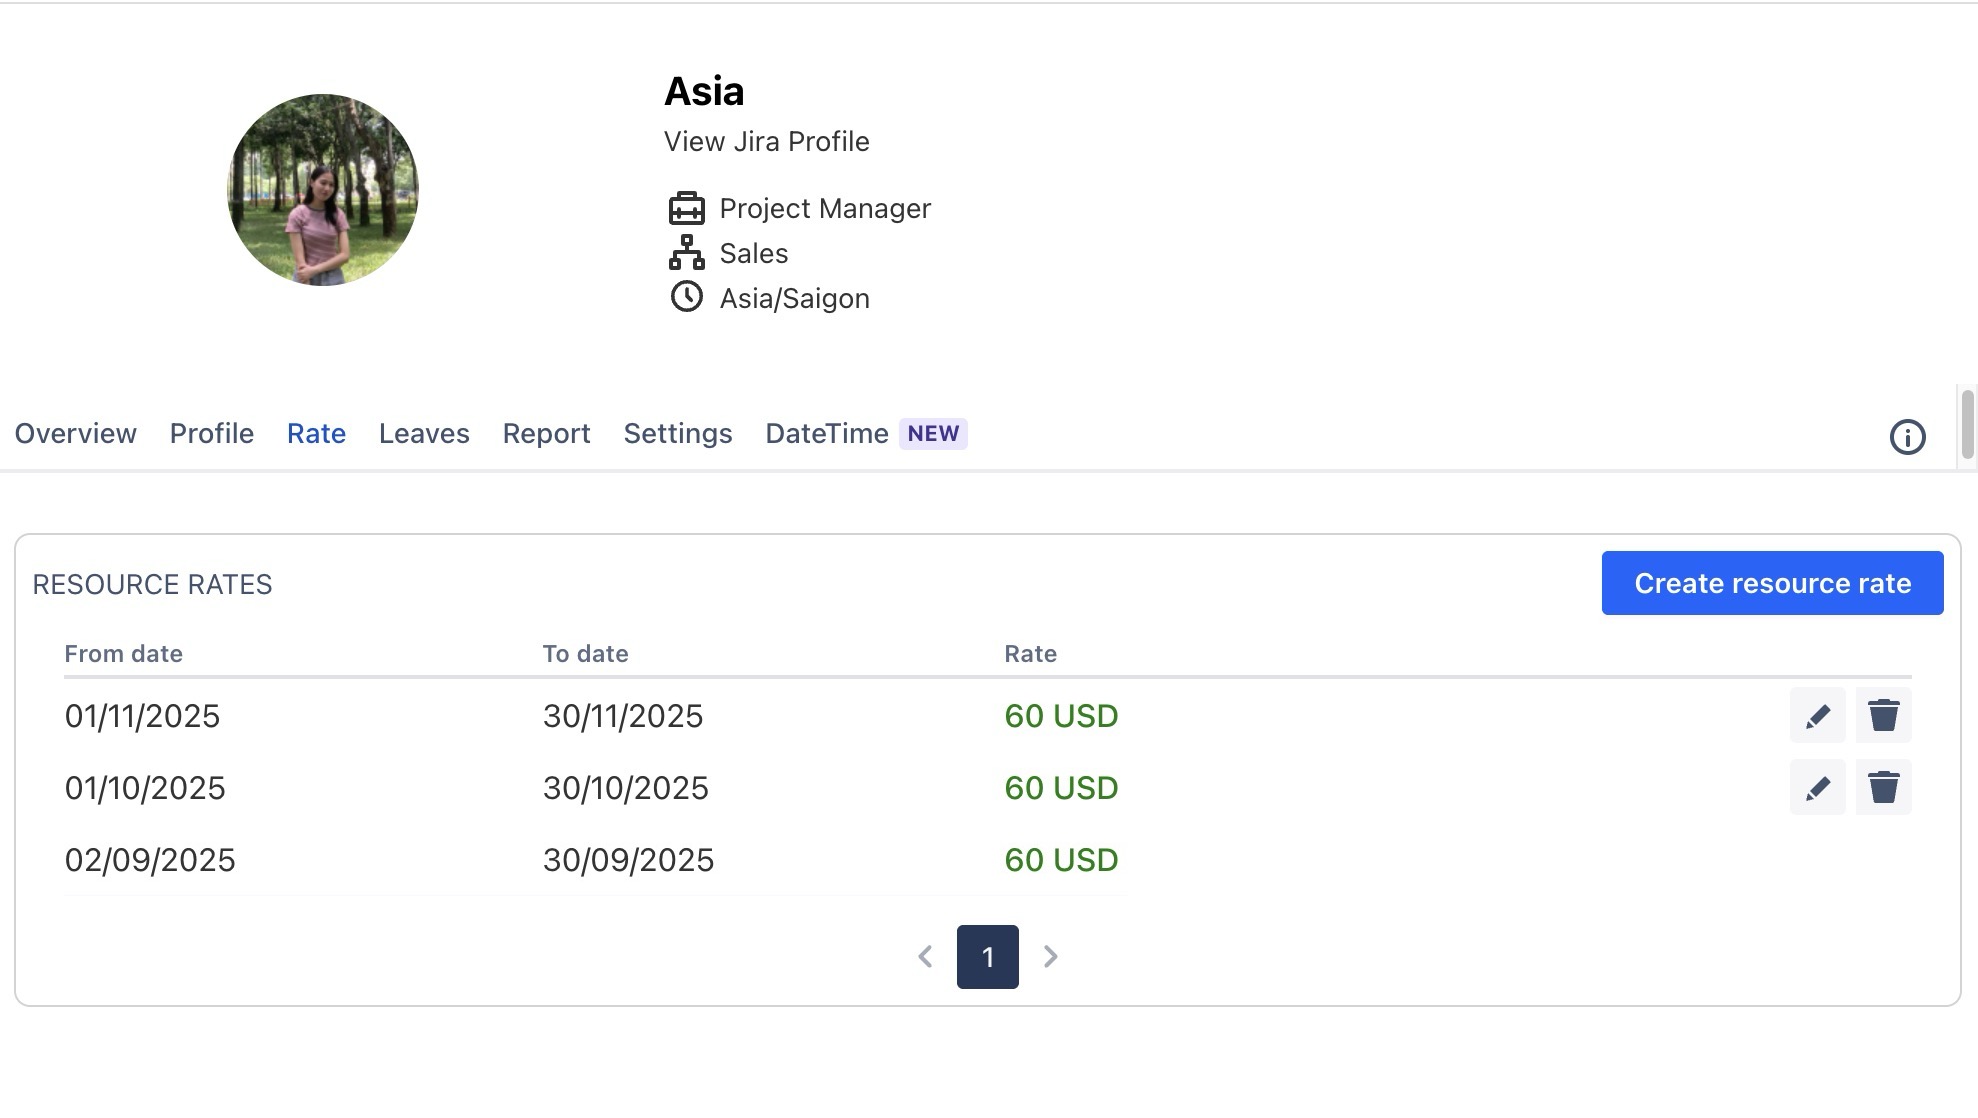
Rate
The Rate tab displays your personal resource rate history, showing the hourly costs applied to you across different time periods. This information is visible only to App Admins, Billing/Cost Admins, or Billing/Cost Viewers.
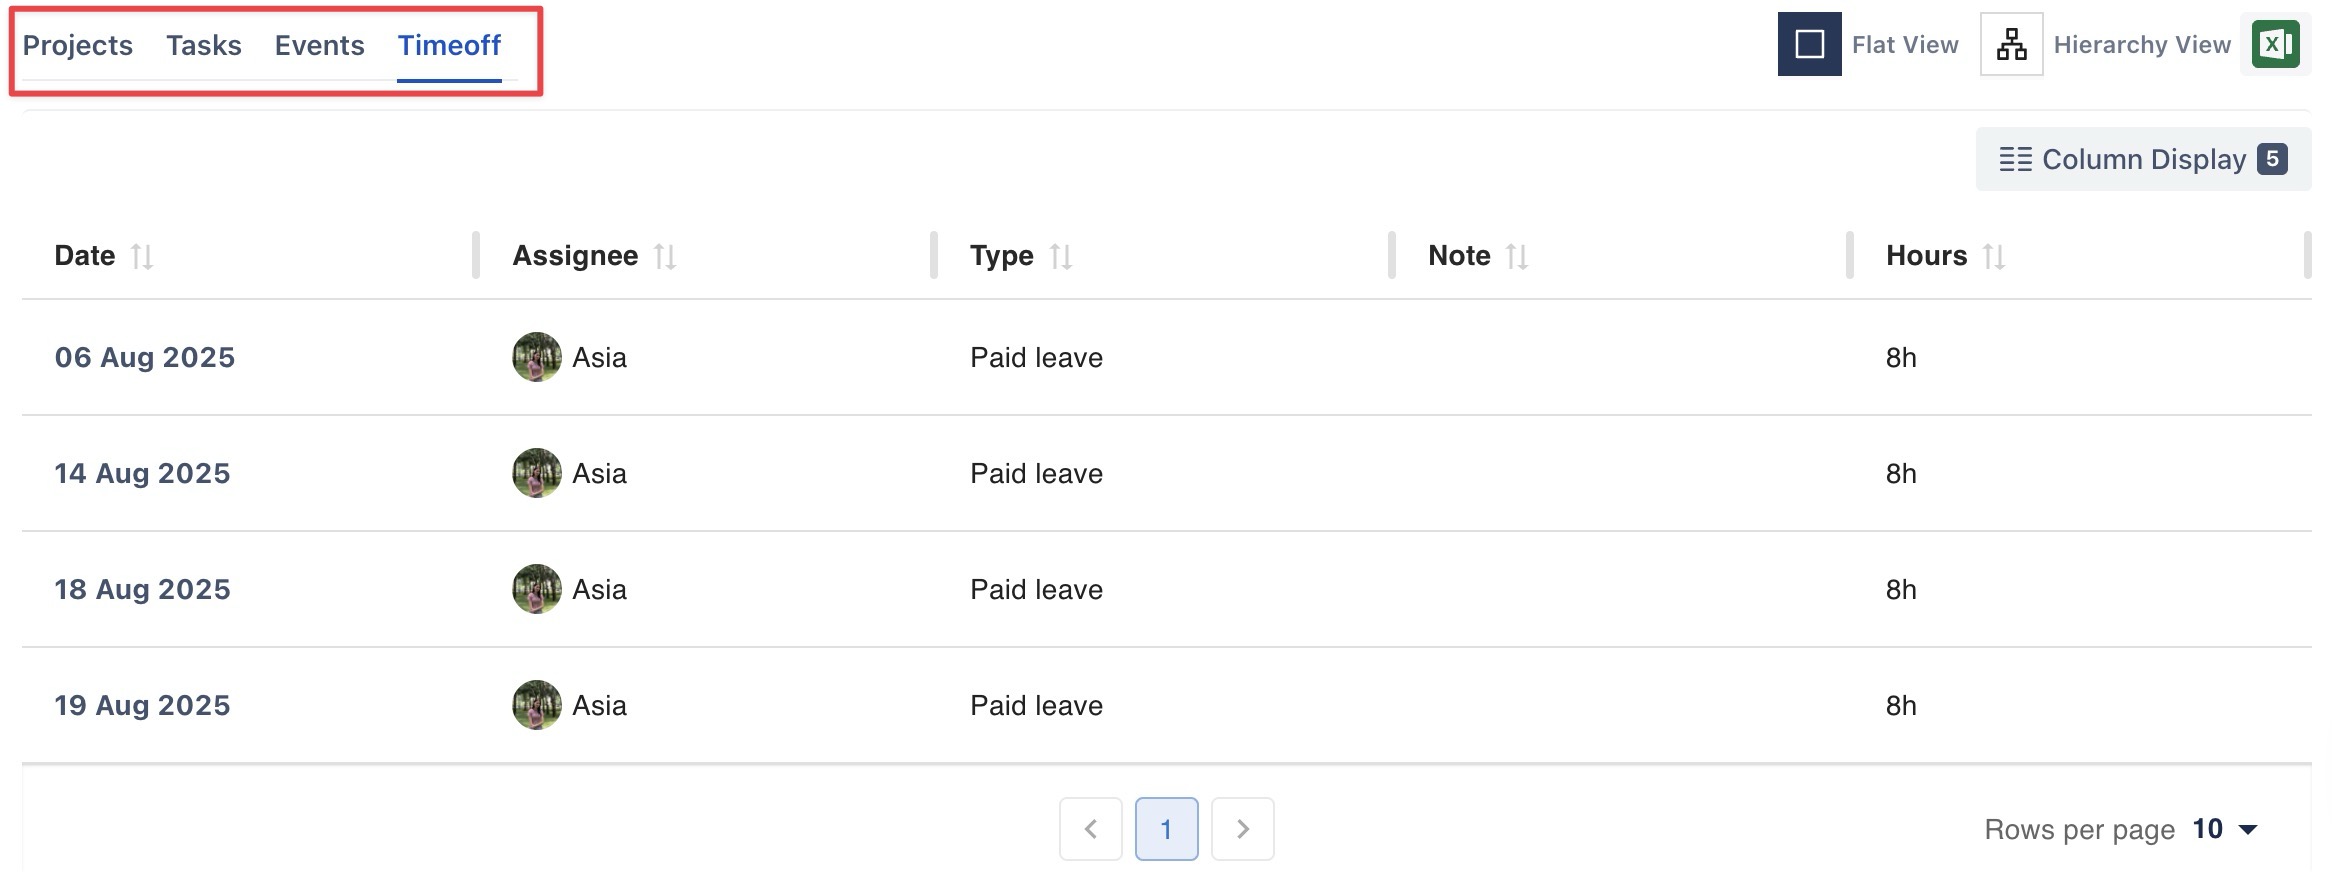
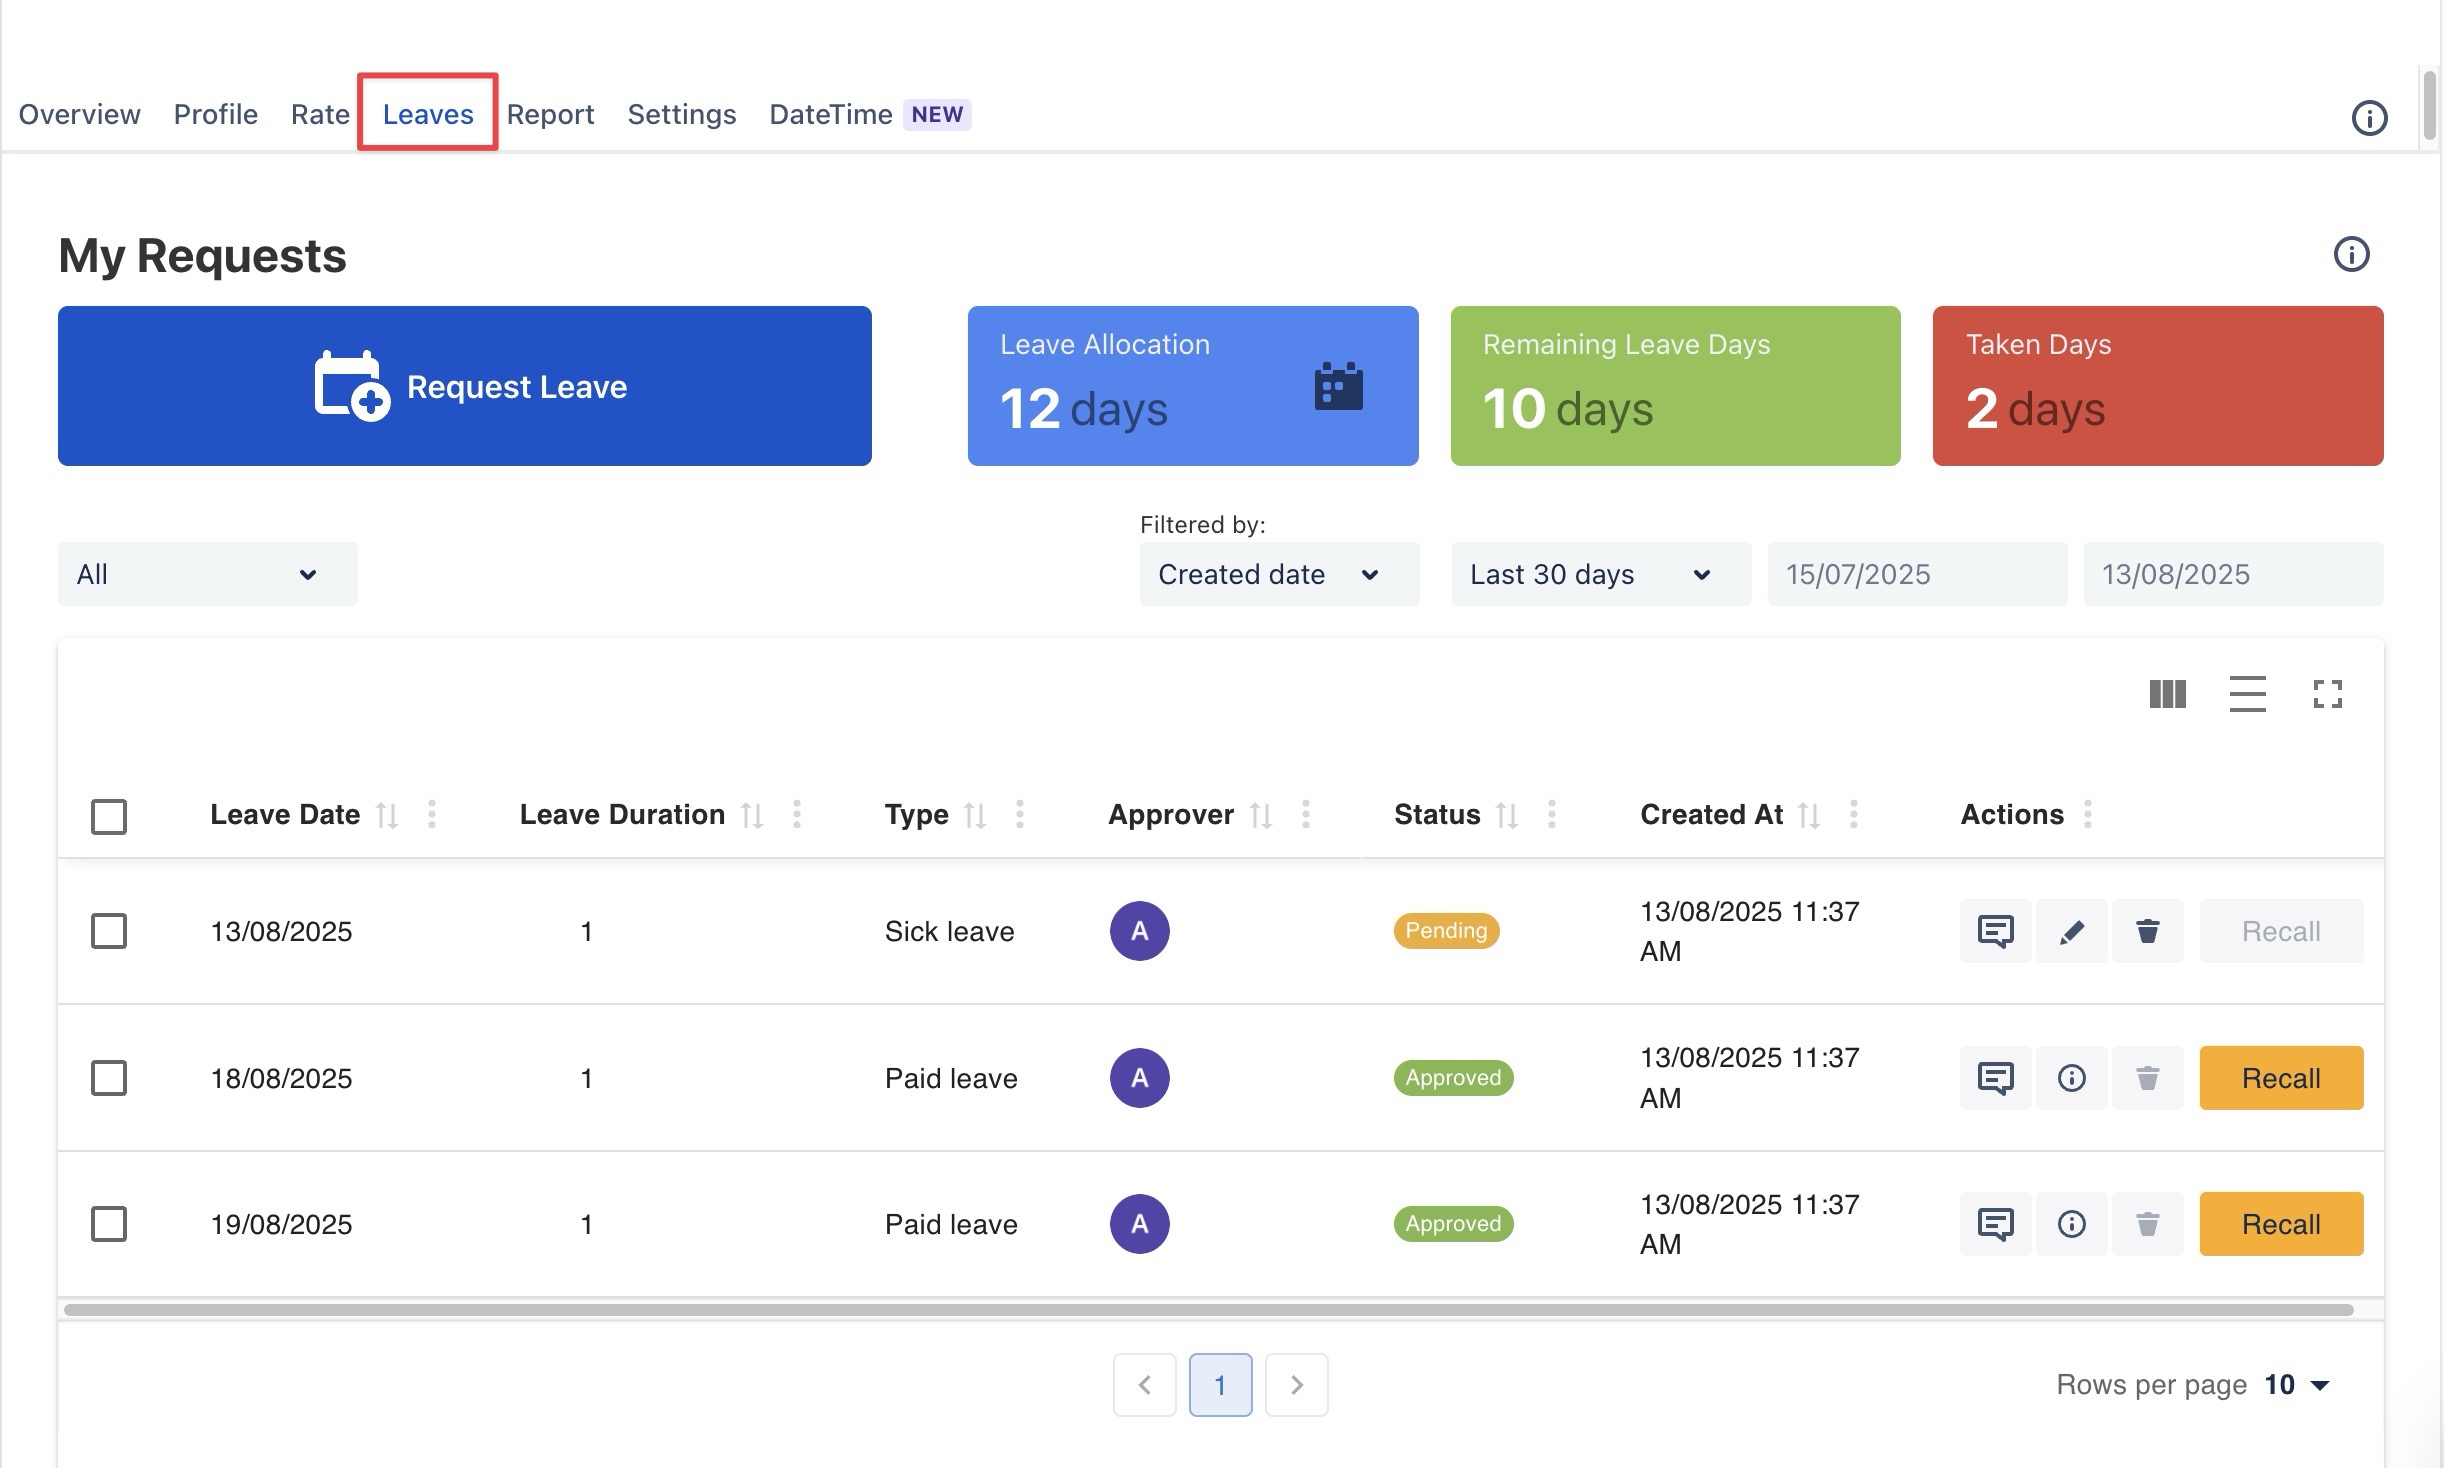
Leaves
The Leaves tab allows you to track your leave status and submit leave requests. You can view details about your leave statuses.
The page includes the following information:
Leave Allocation: Total days allocated for the current year, including any accumulated leave days from the previous year.
Remaining Leave Days: The number of leave days still available for use, and users can submit requests for these days.
Taken Days: The number of leave days already used.
Learn more: How to create, edit, or cancel a Leave Request
Report
The Report tab provides a graphical and visual overview of key performance metrics, including capacity, scheduled hours, logged hours, and time off. It helps you track your time and analyze your work effectively.
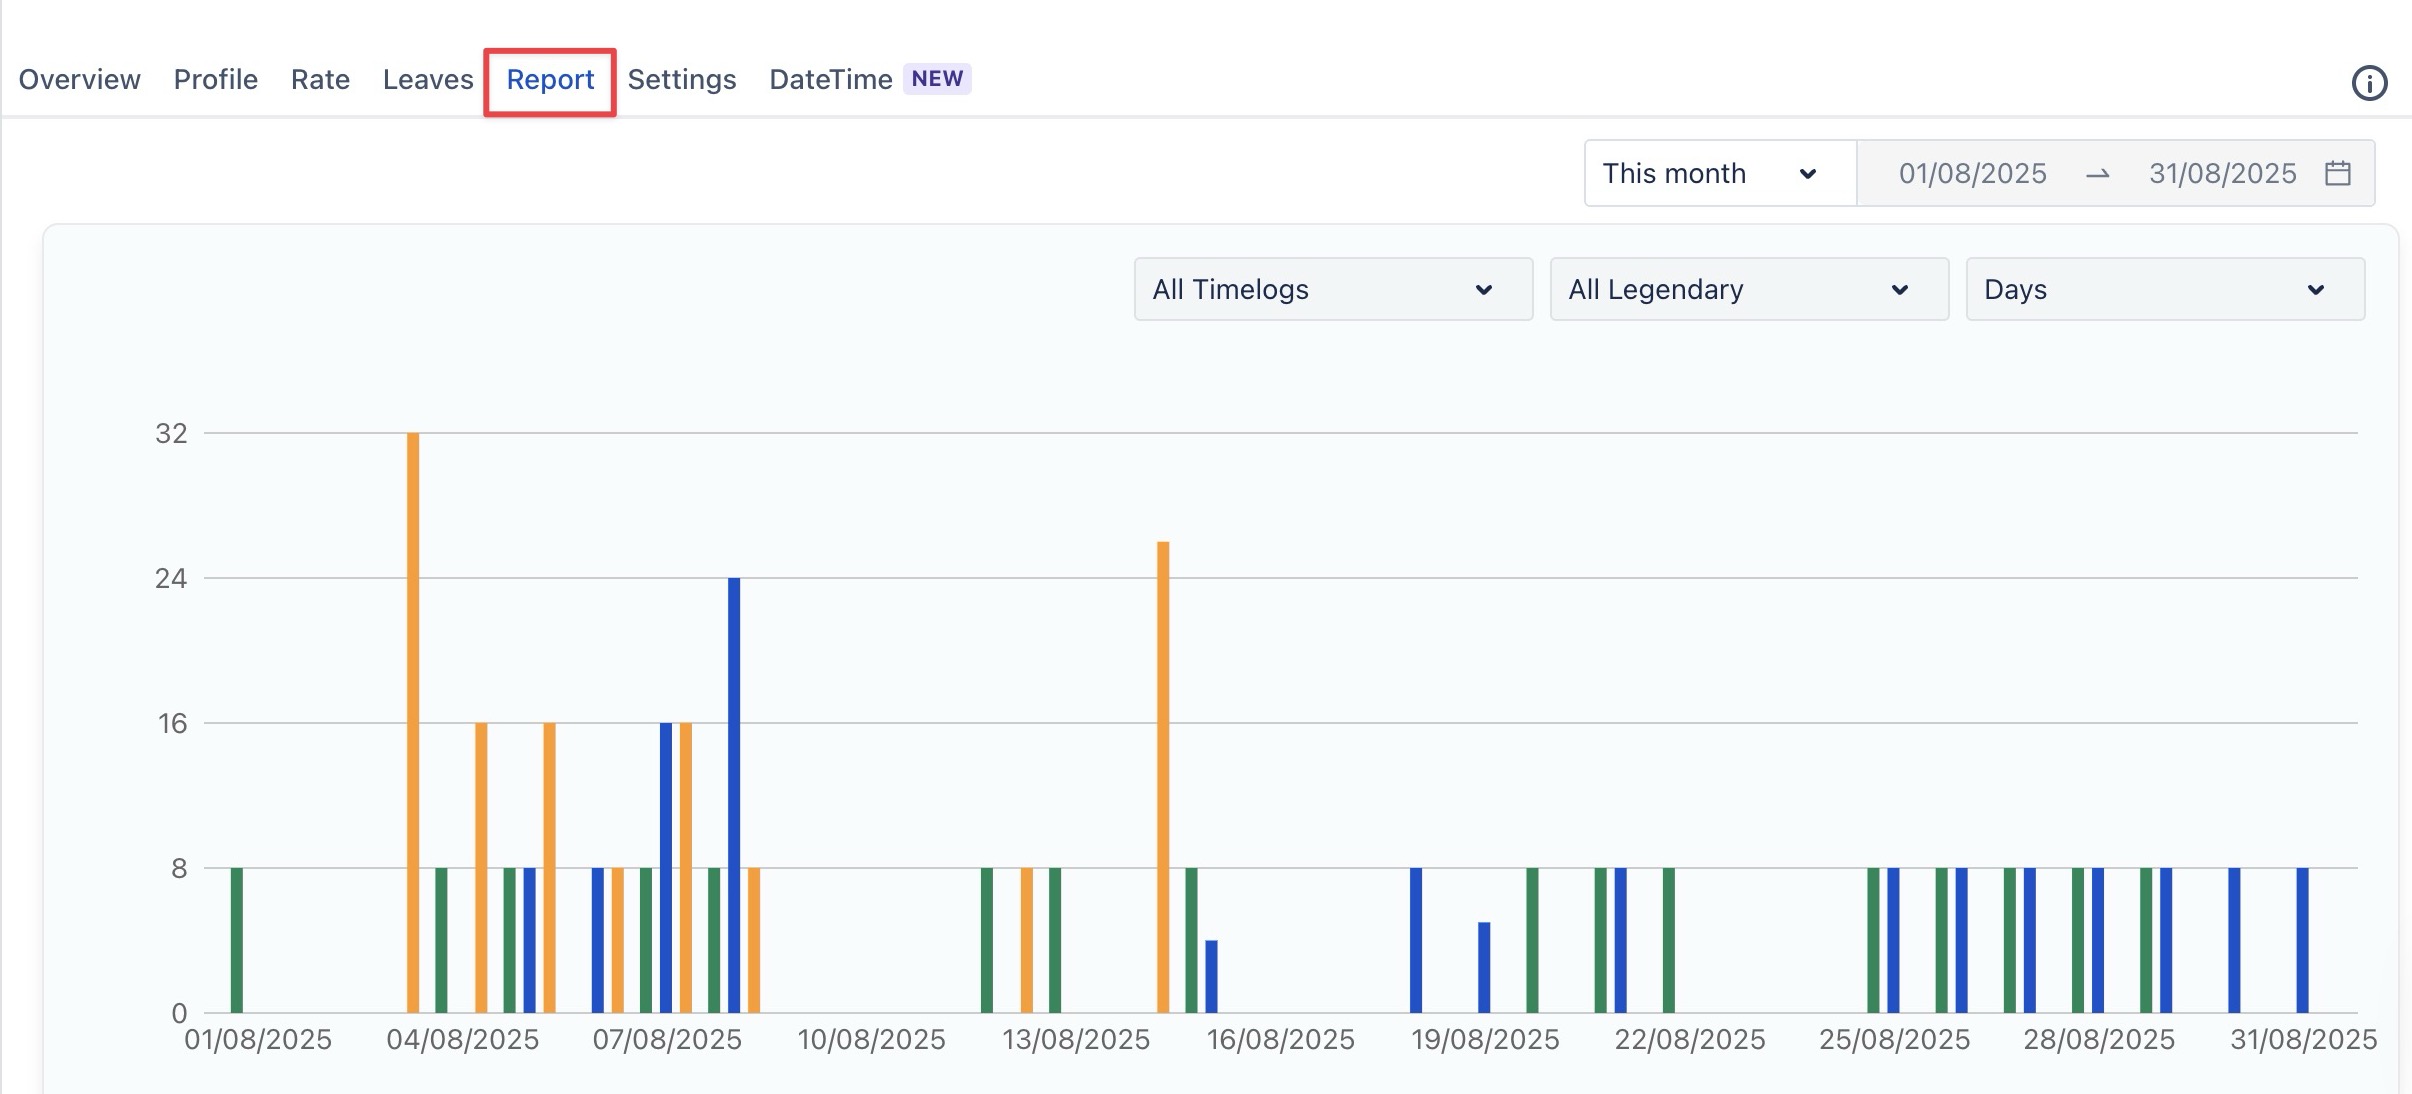
This section includes the following:
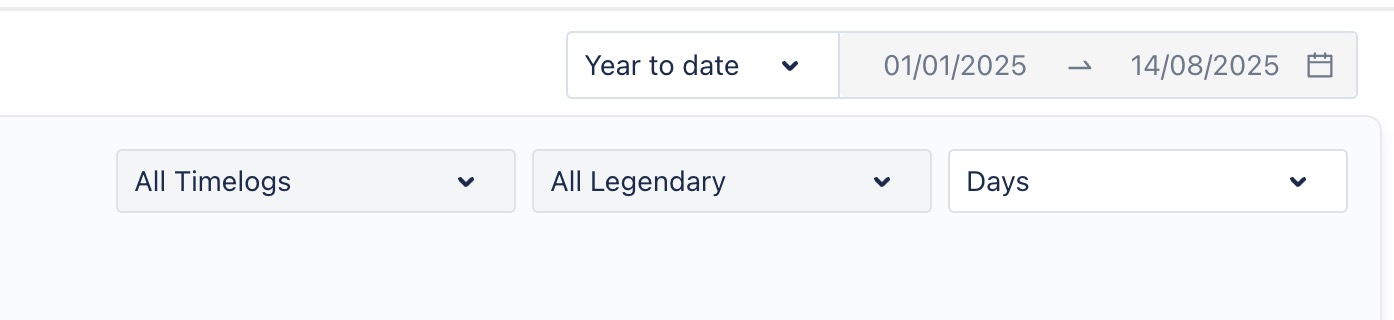
Filters: You can filter your data by Timelogs (Approved, Pending, or Rejected) and Date Range to gain deeper insights into your work status and focus on specific periods or timelog types.
Bar Chart: Displays your capacity, scheduled hours, logged hours, and overtime in column charts for easy comparison.
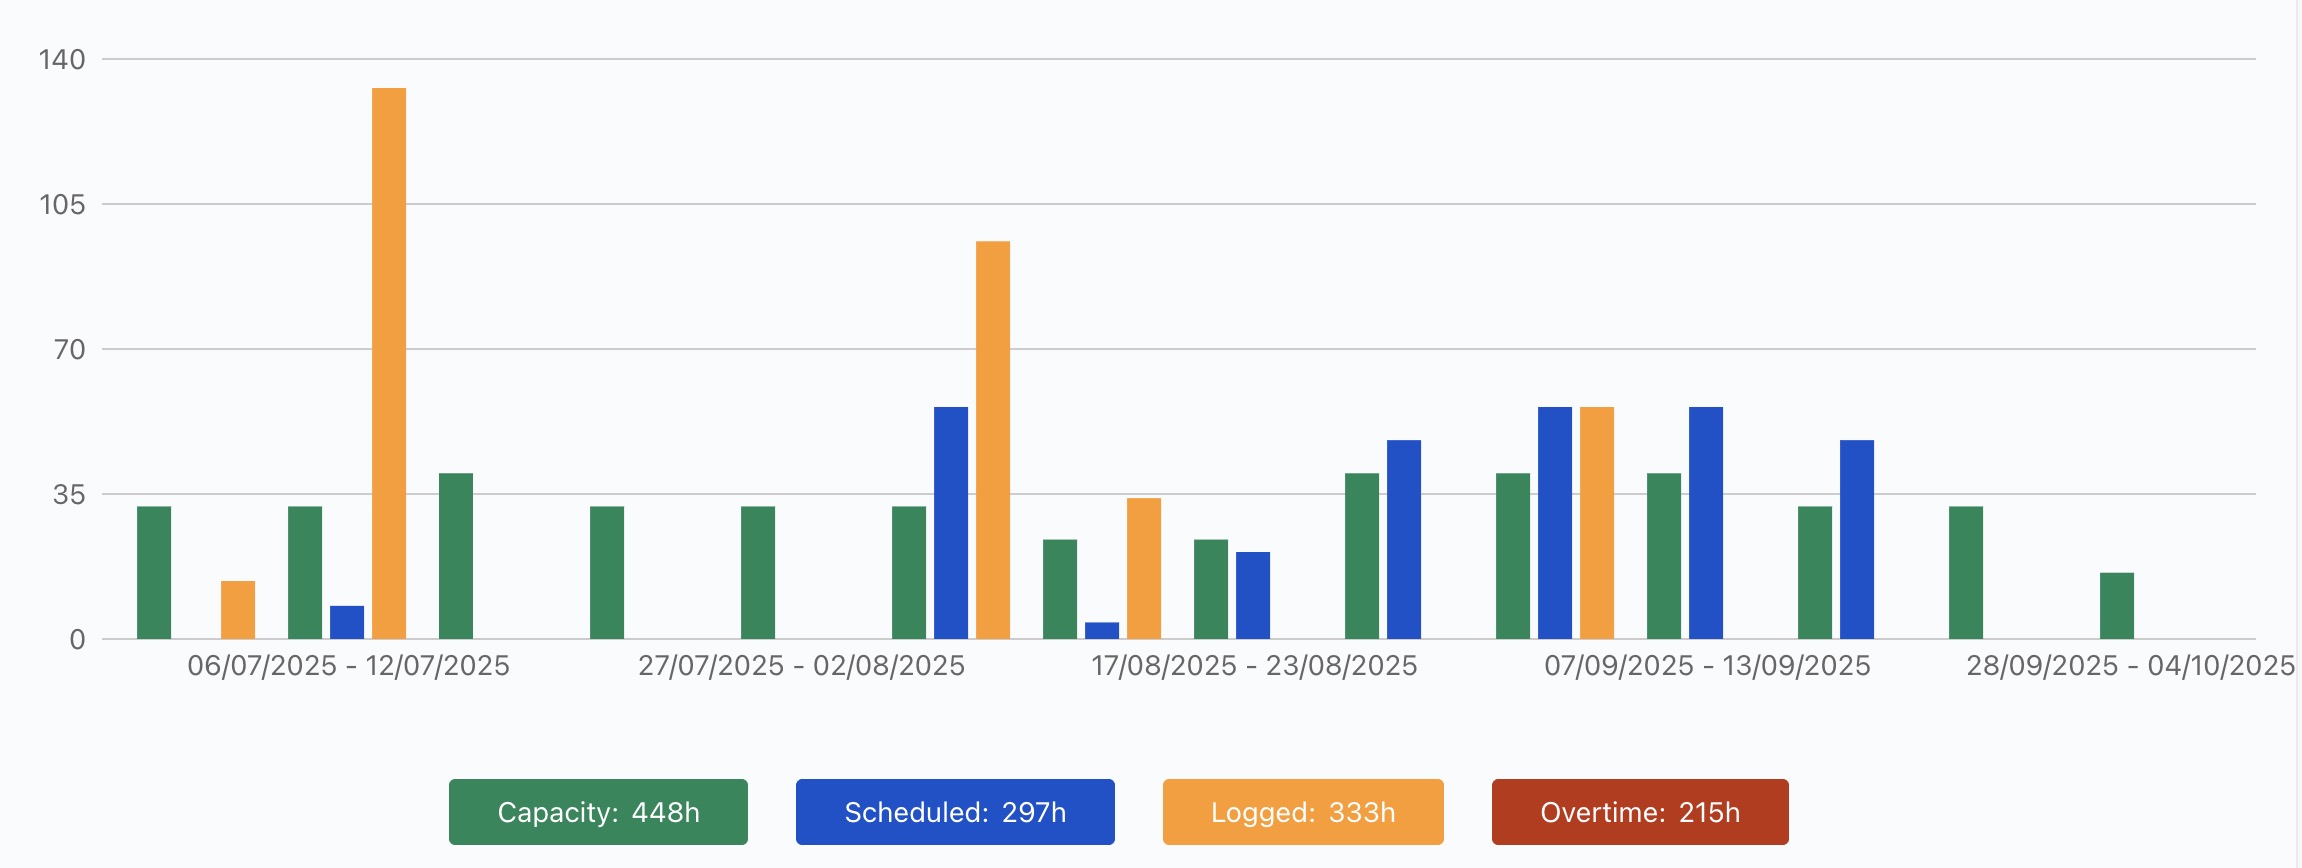
Data Table: Provides a detailed breakdown of your projects, tasks, events, and time off, displaying key metrics such as Scheduled Hours, Logged Hours, and the Difference (variance) to track your performance across different activities.