.png)
The Test Coverage Report in AgileTest analyzes the status of each requirement based on the execution results of its linked test cases. It provides a clear overview of how well your requirements are covered by test cases and helps teams quickly identify which requirements are fully tested, partially tested, or not tested.
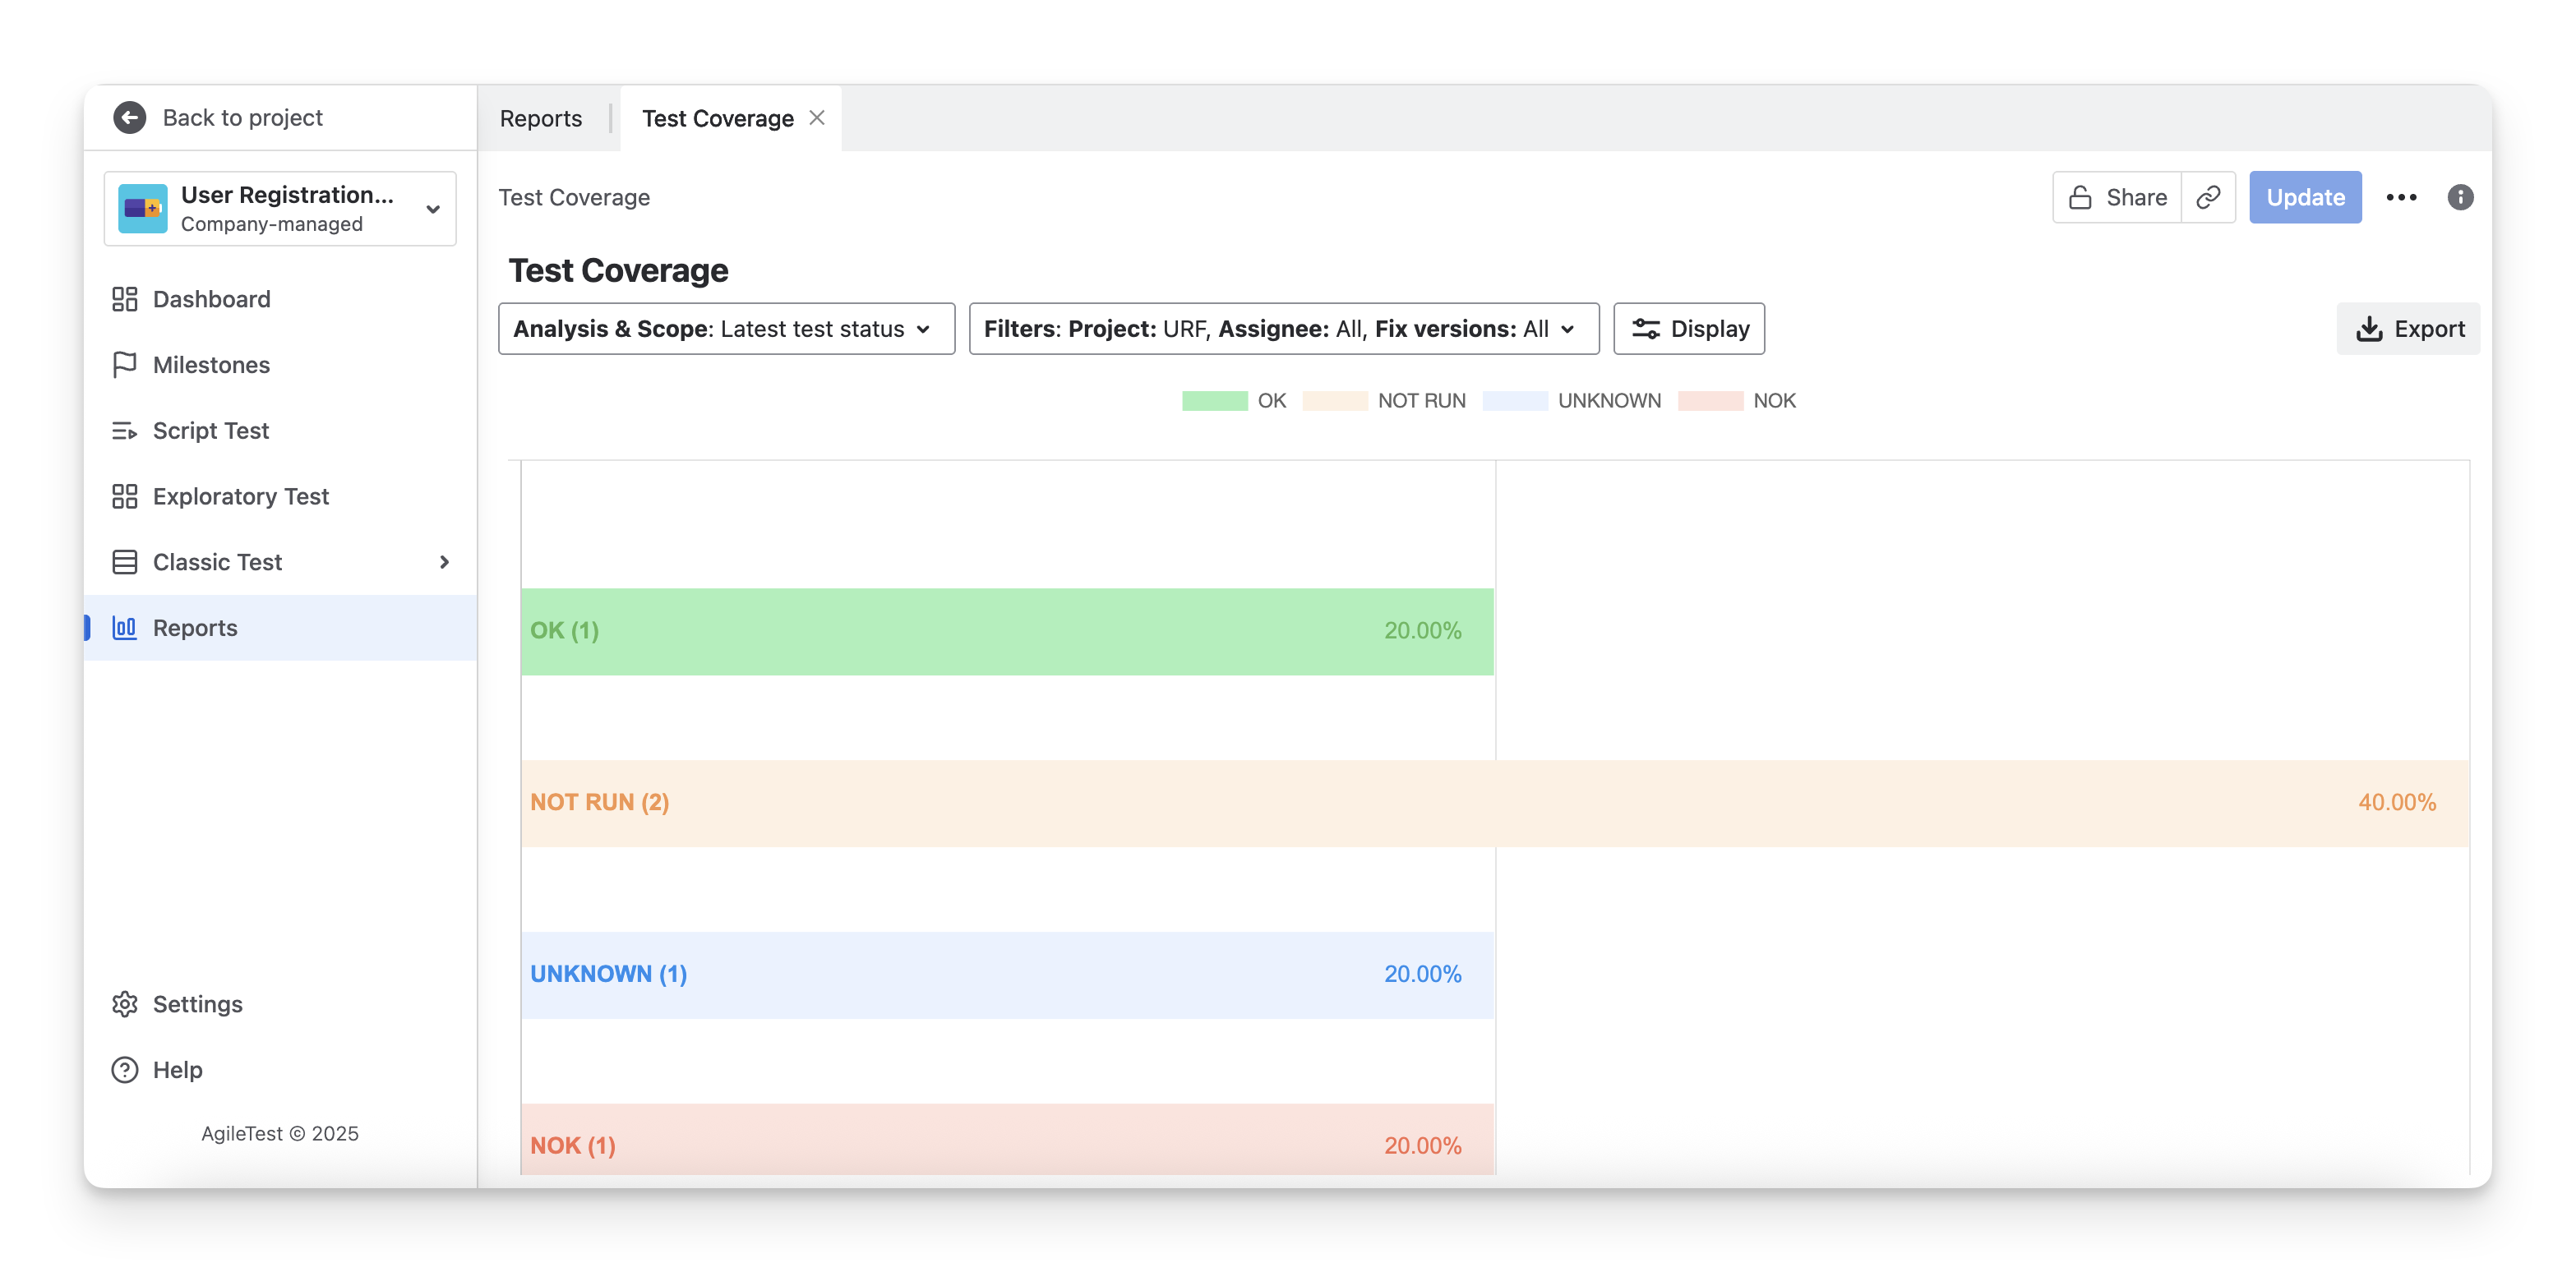
In each Test Coverage Report, you will see 2 main sections:
-
Test Coverage Chart: A bar chart that shows the distribution of requirement statuses. Each bar represents a requirement status, and its length indicates the percentage of the total requirements that fall into that status.
-
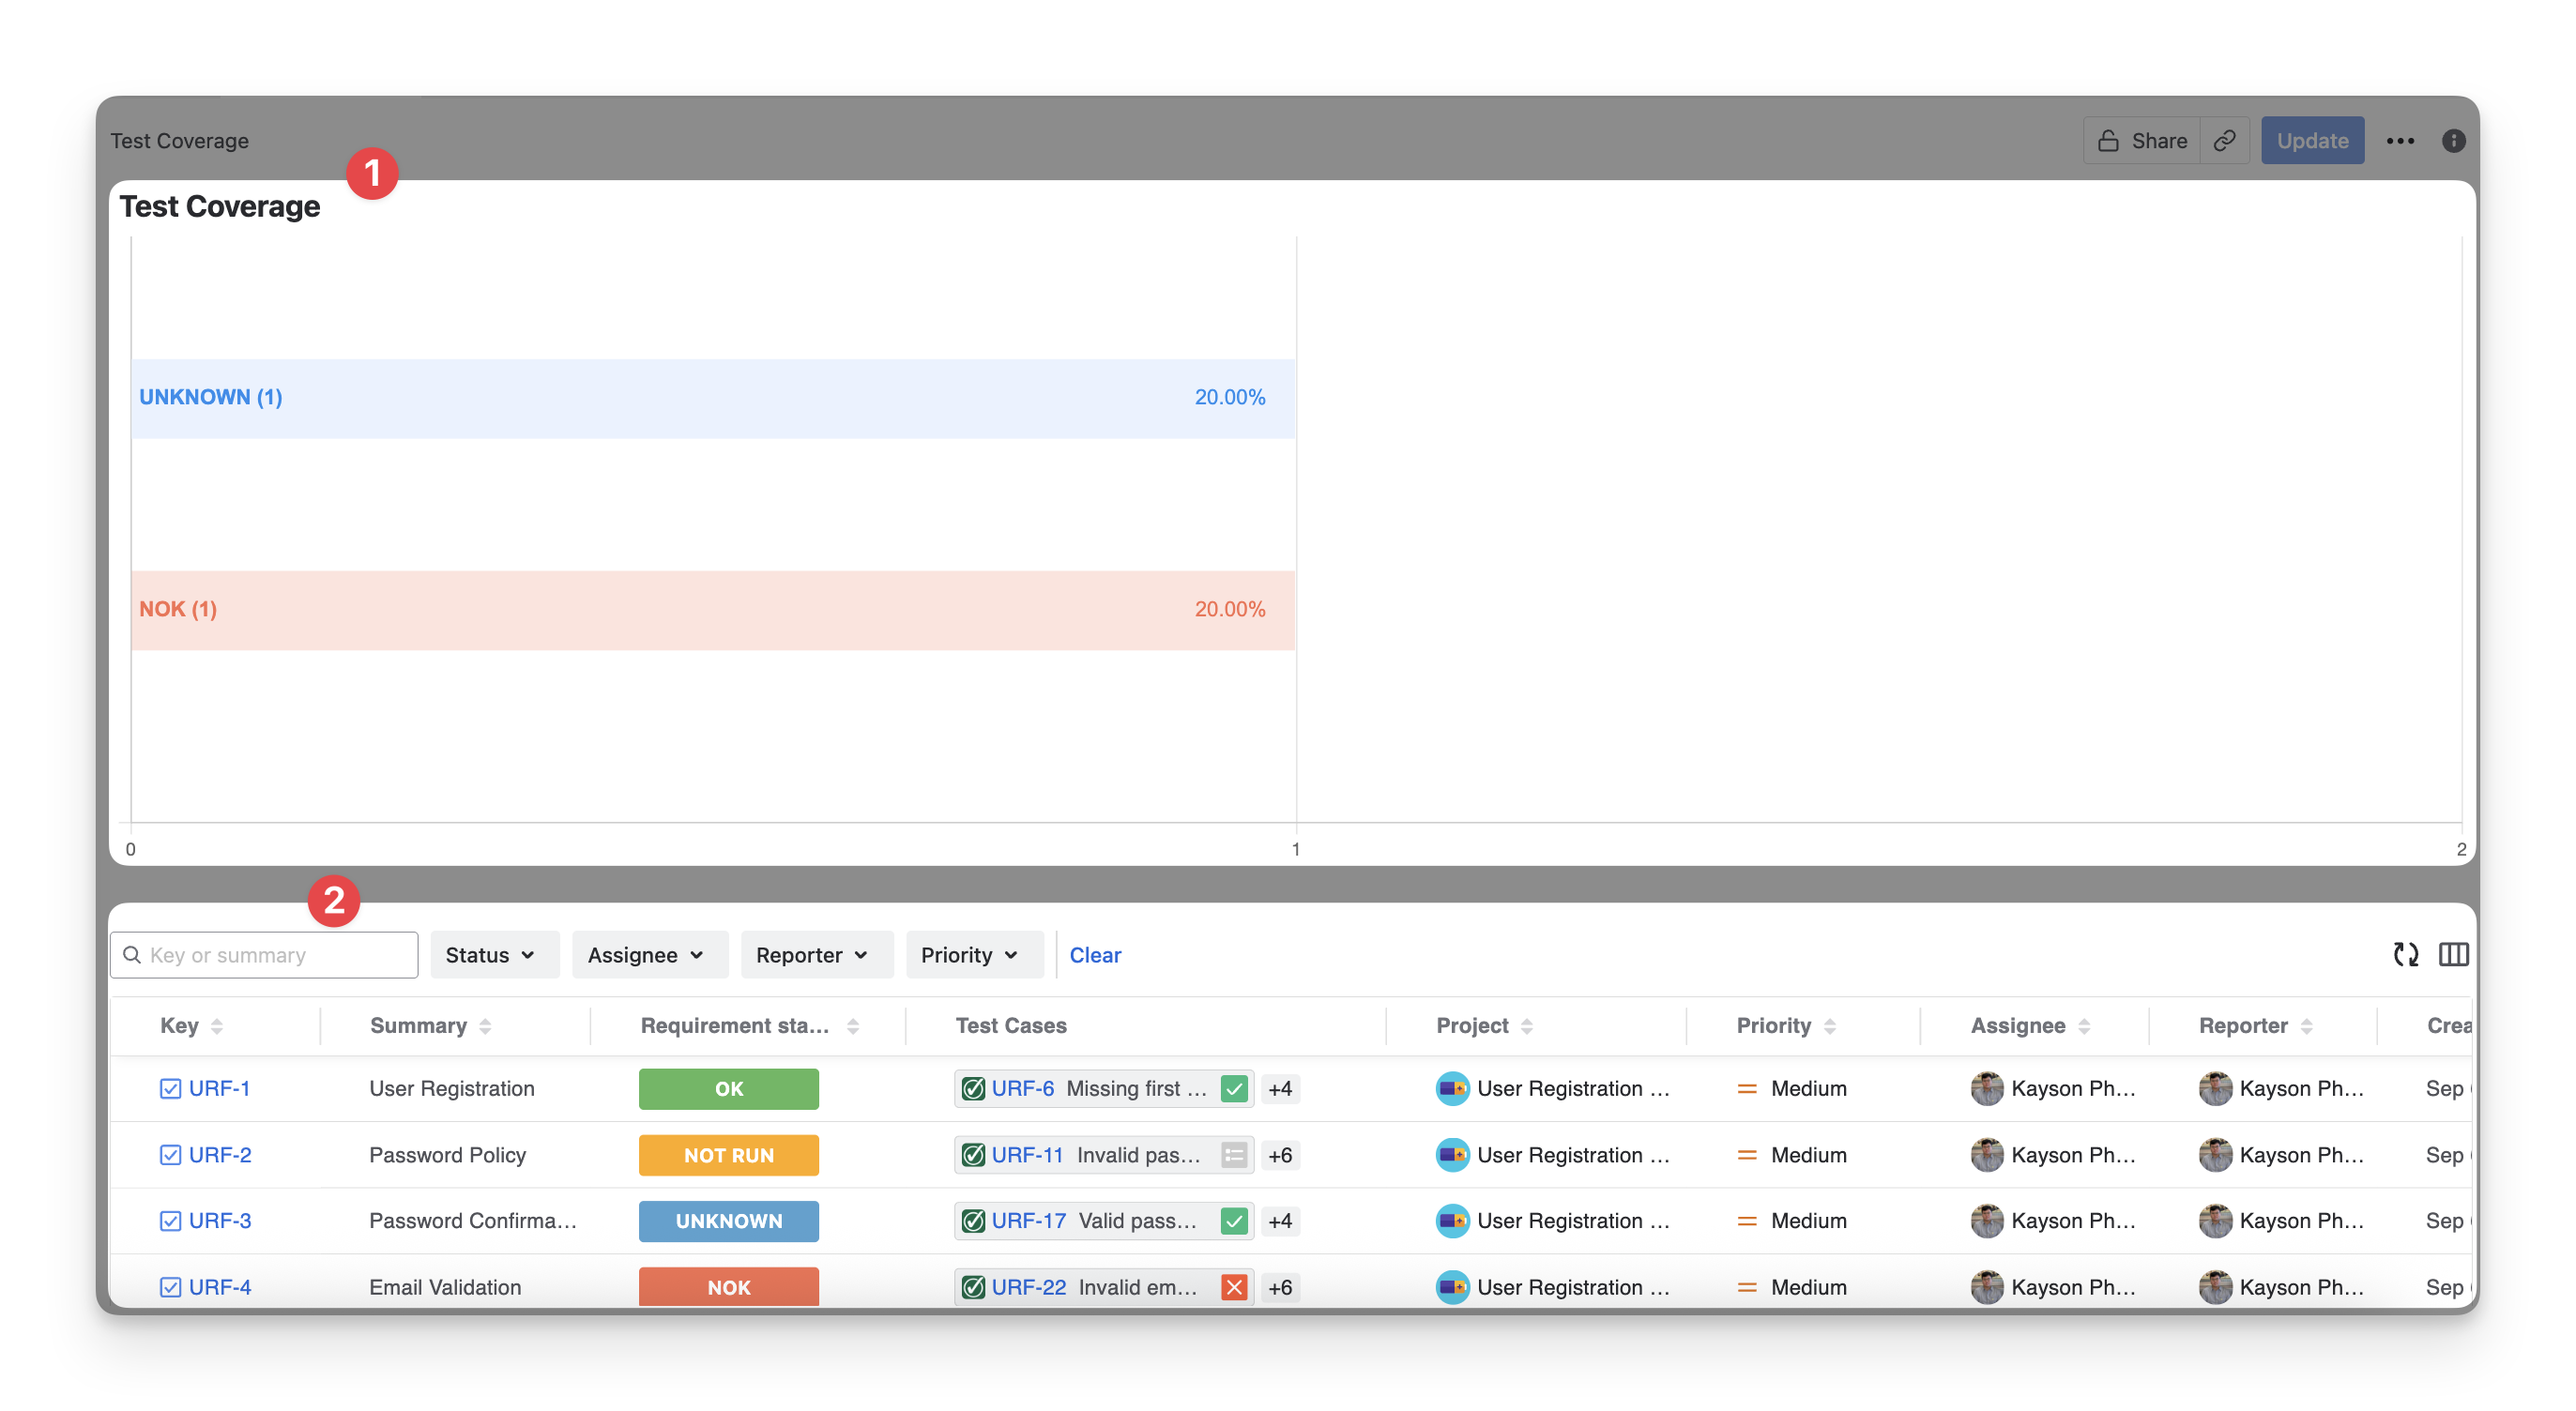
Test Coverage Table: A list of requirements with detailed information and their associated test cases, including execution results derived from test execution data.
Read more about Coverage Analysis.
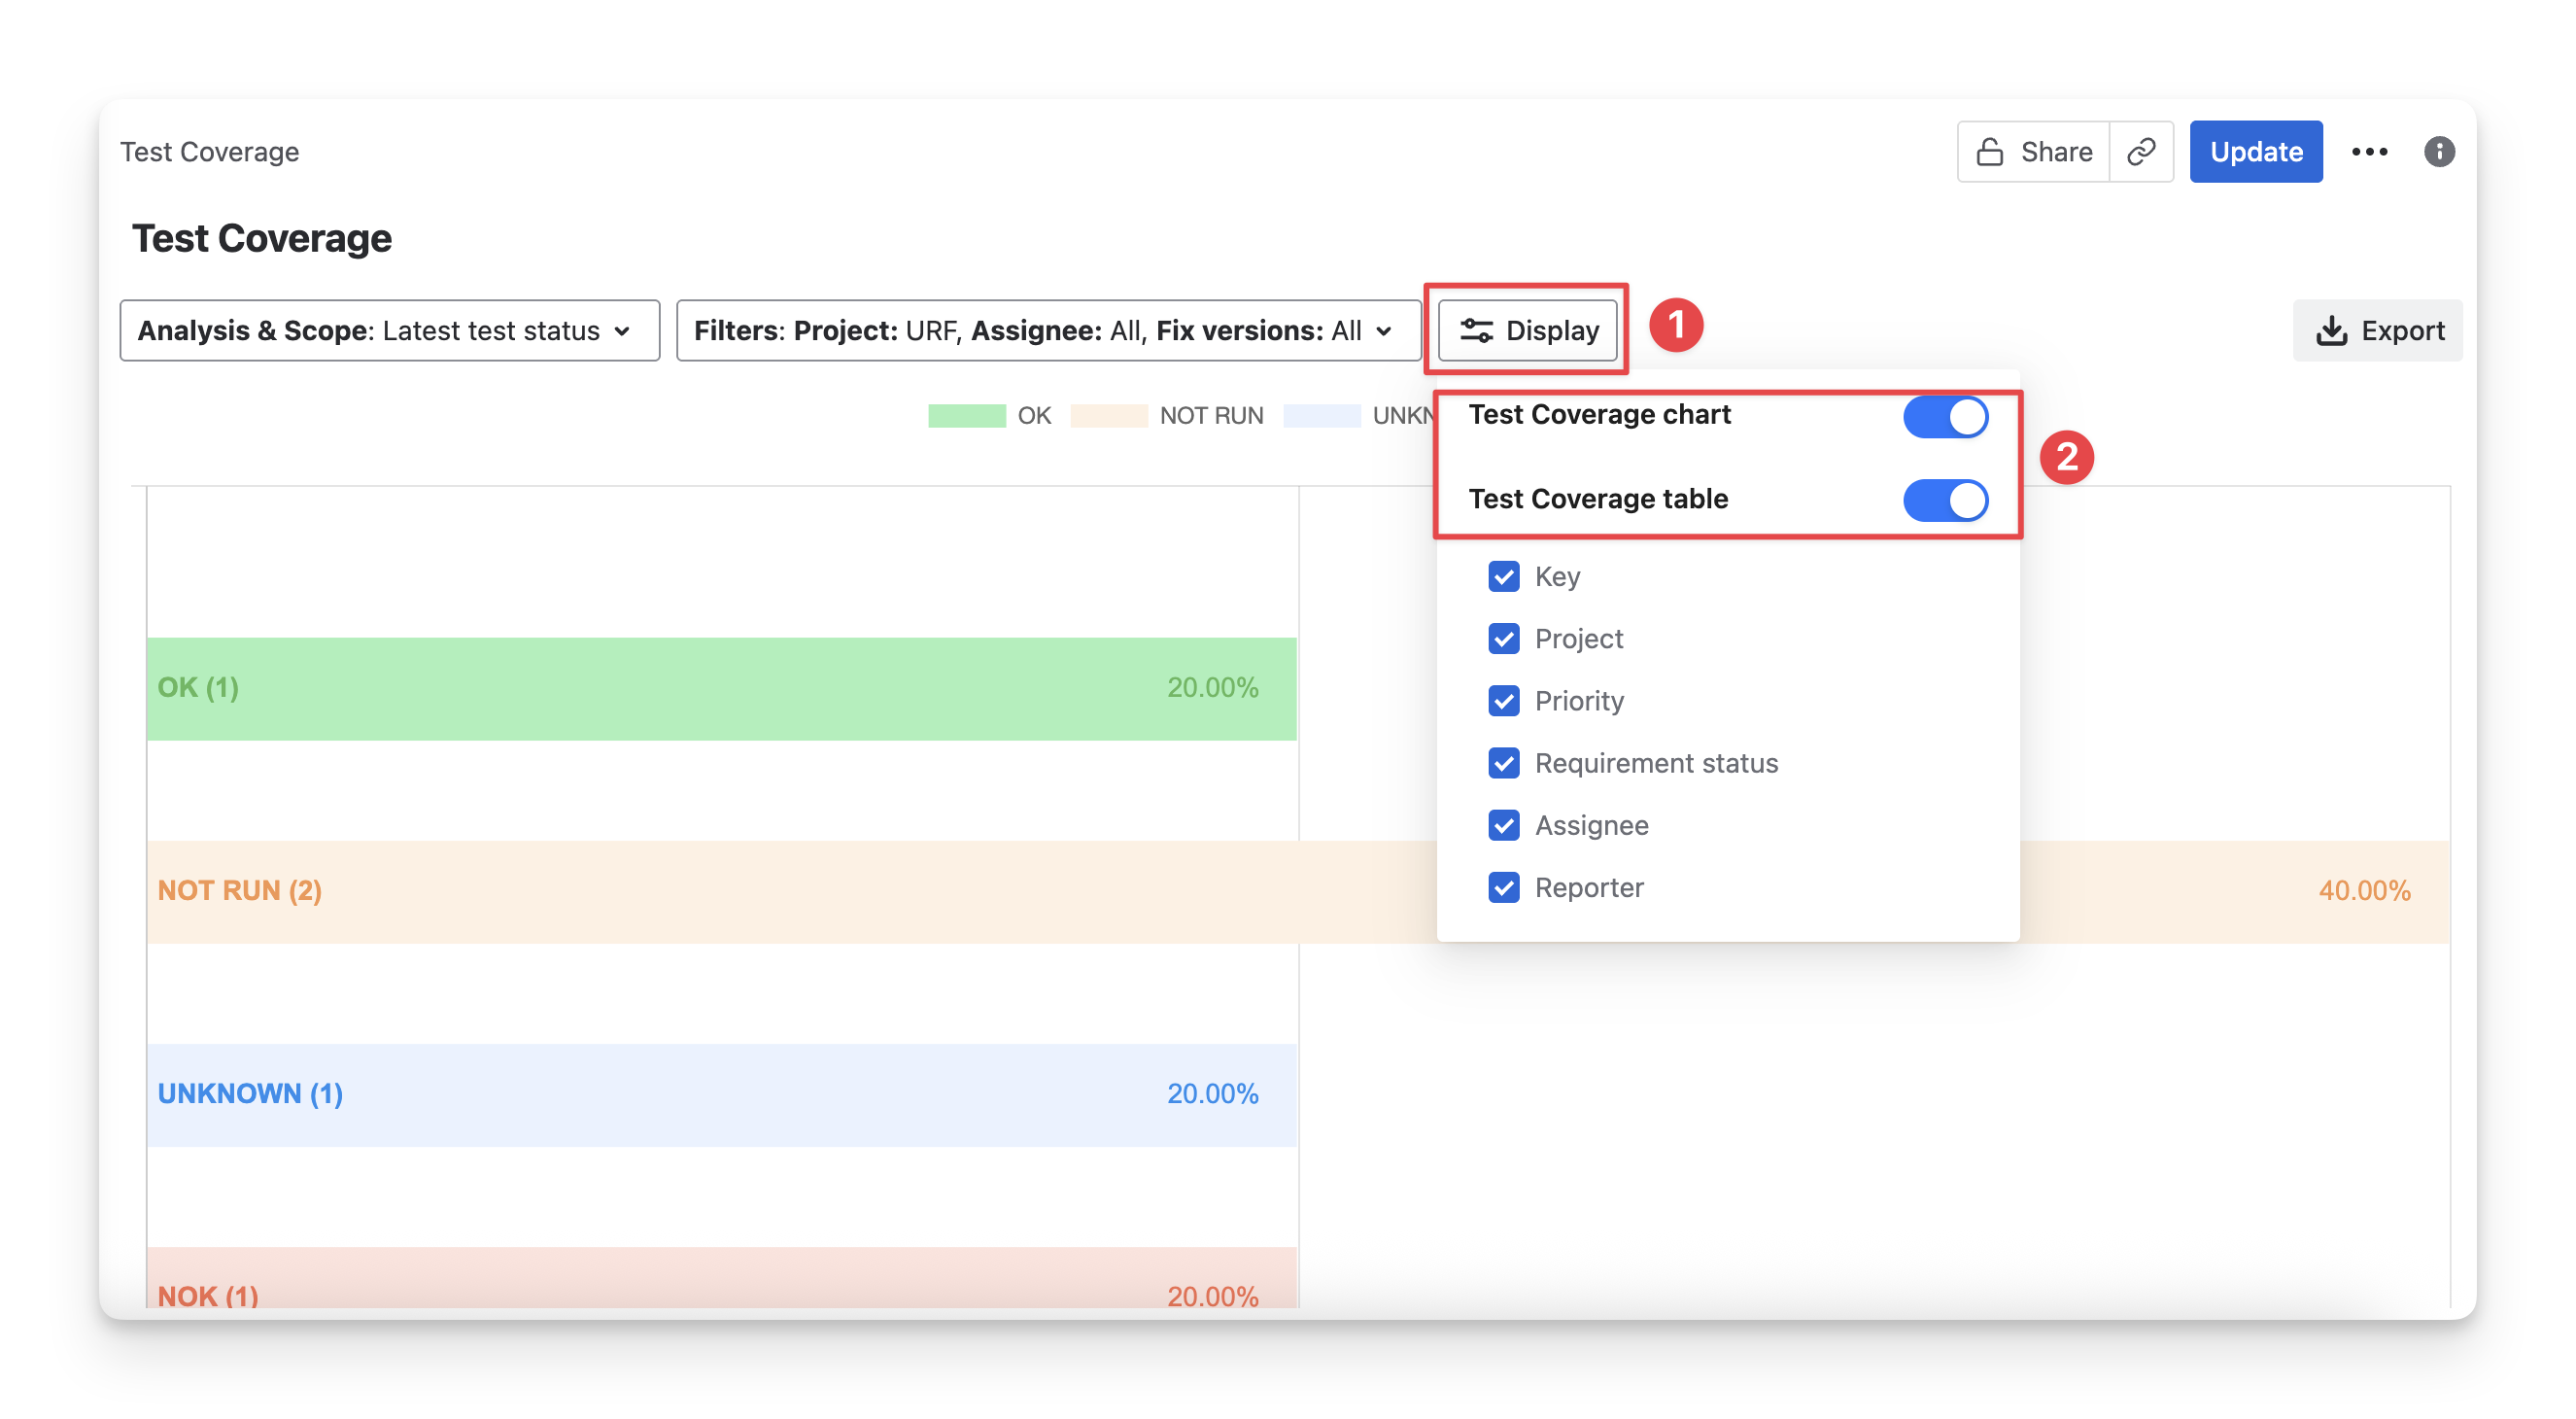
To show or hide any of the 2 sections in the Test Coverage Report:
-
Click the Display button.
-
From there, you can turn on/off the switches to show or hide the whole Test Coverage chart and table section.
1. Test Coverage Chart
The AgileTest Test Coverage report calculates requirement status based solely on the test case scope.
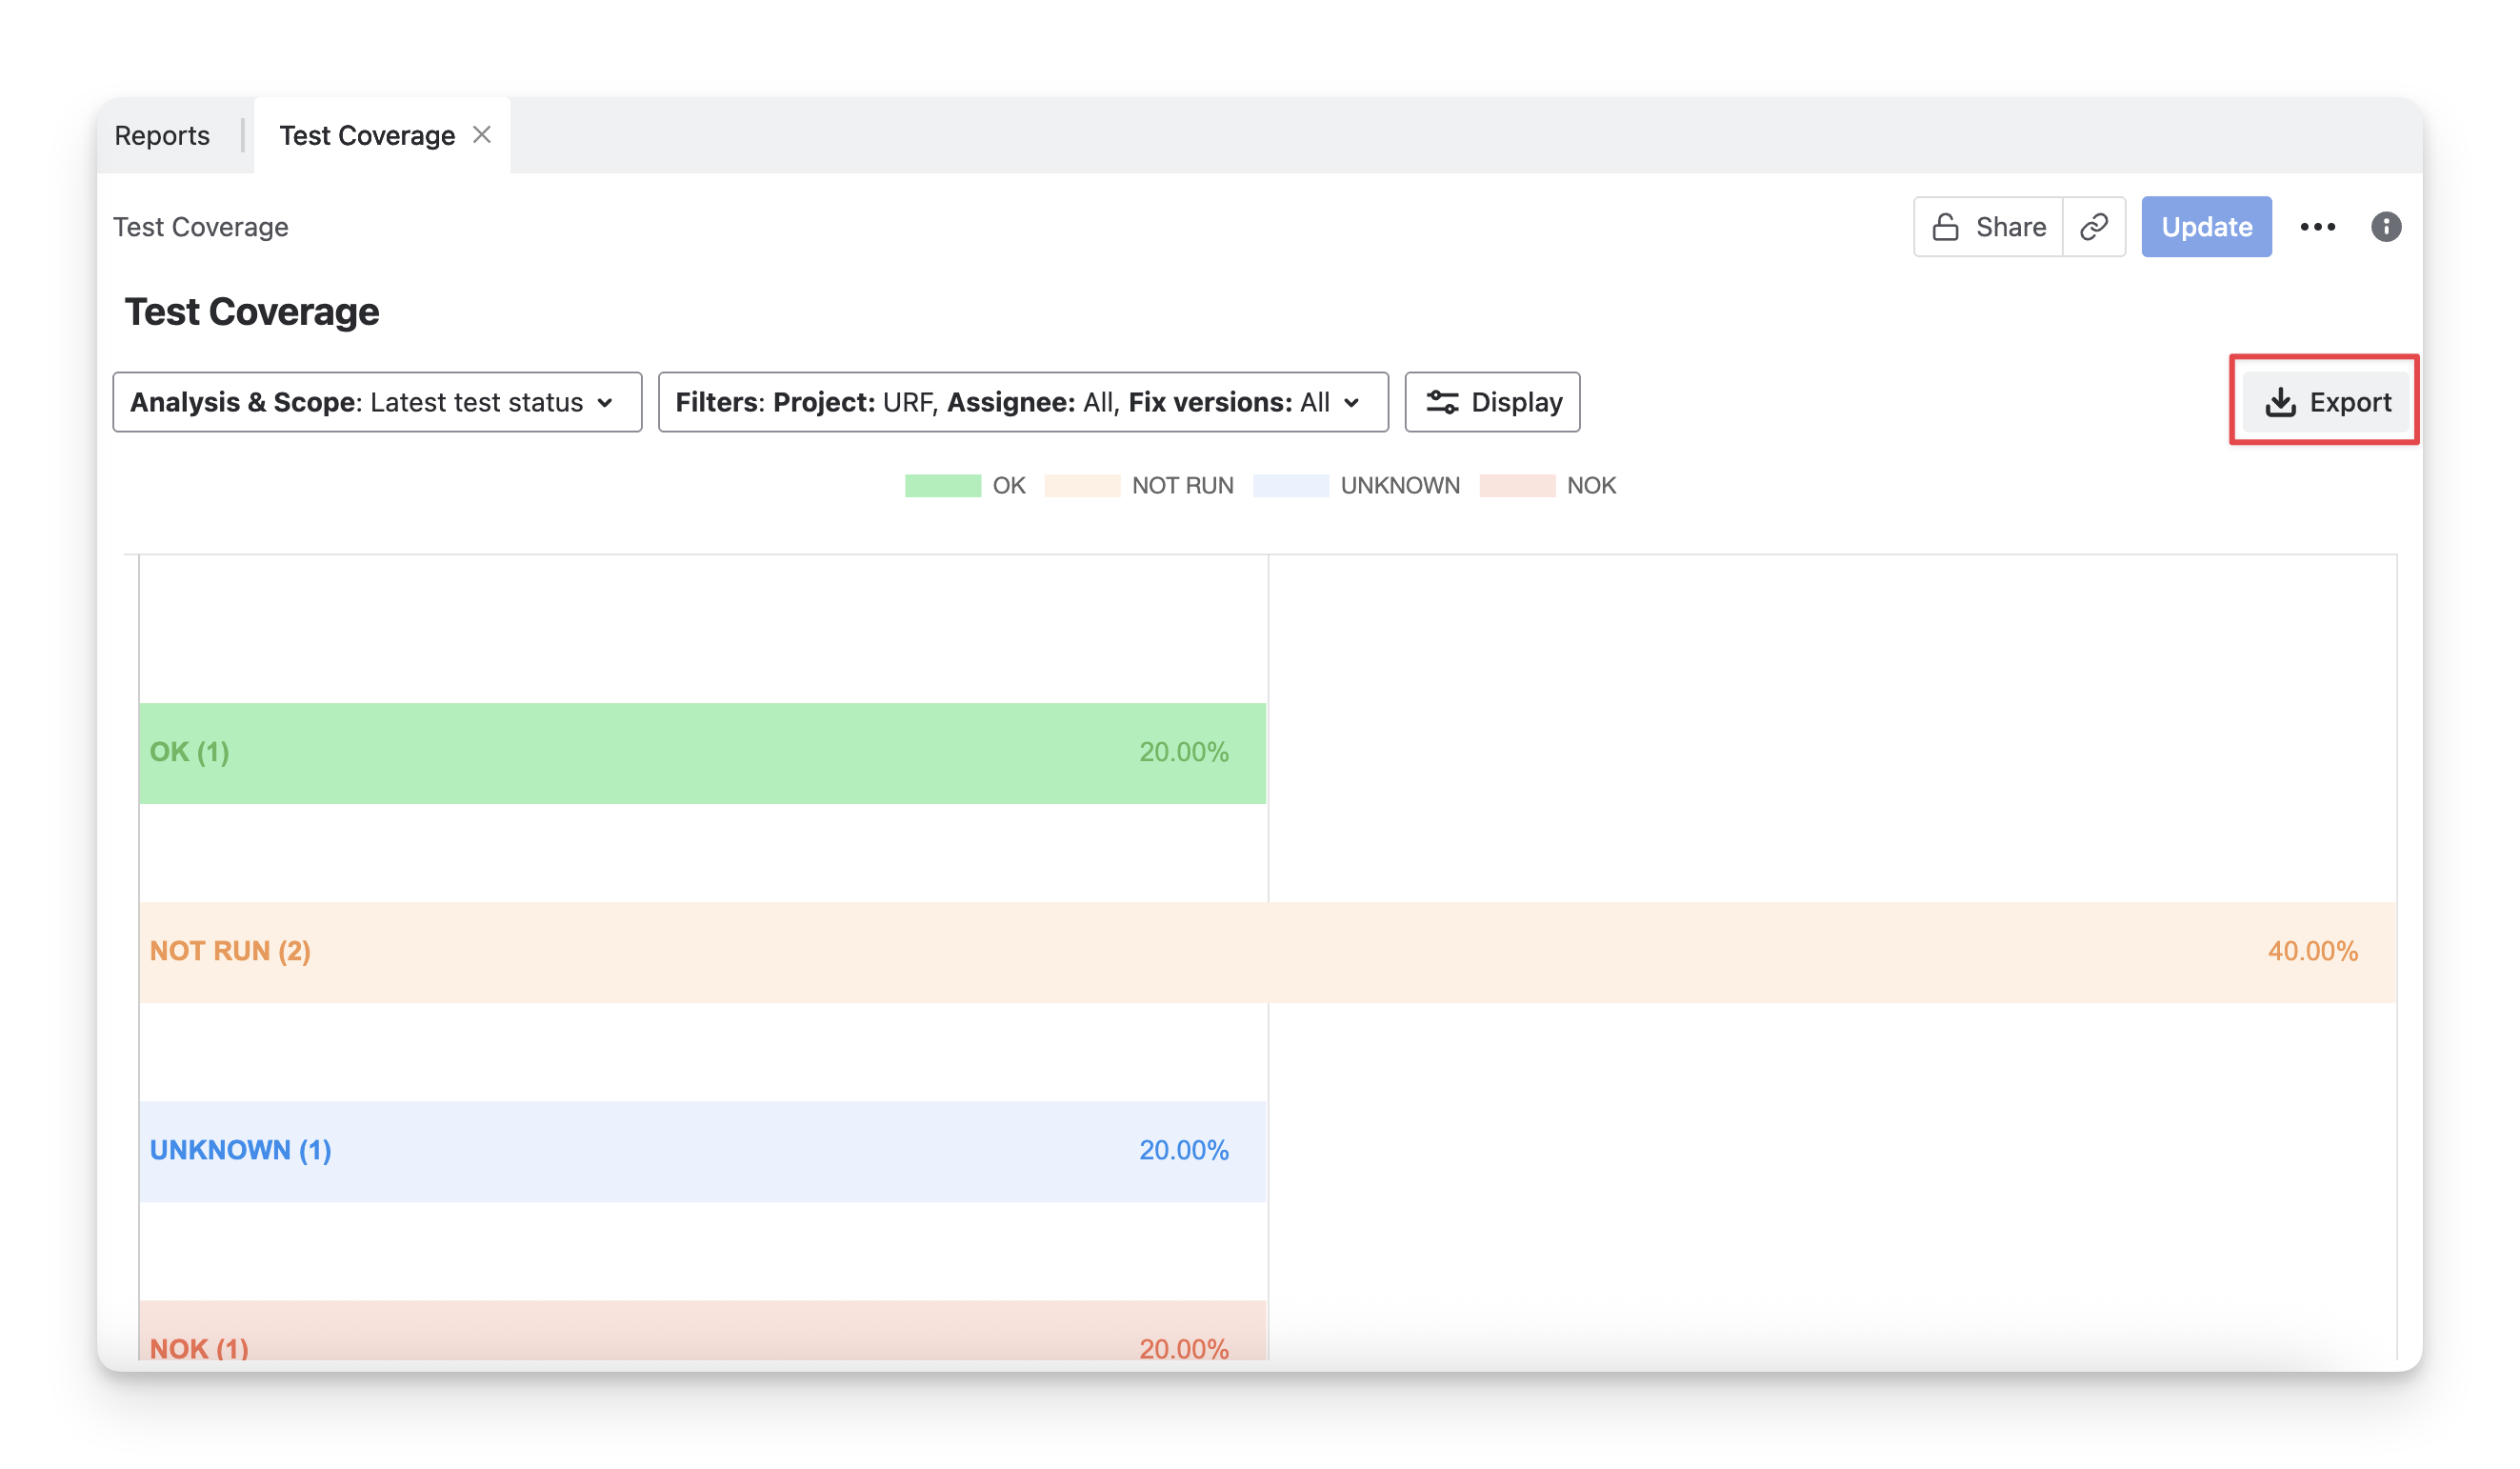
The Test Coverage Chart displays the status of your requirements as a percentage of the total requirements in scope. Each status is calculated based on the execution results of the test cases linked to those requirements, under the coverage analysis process.
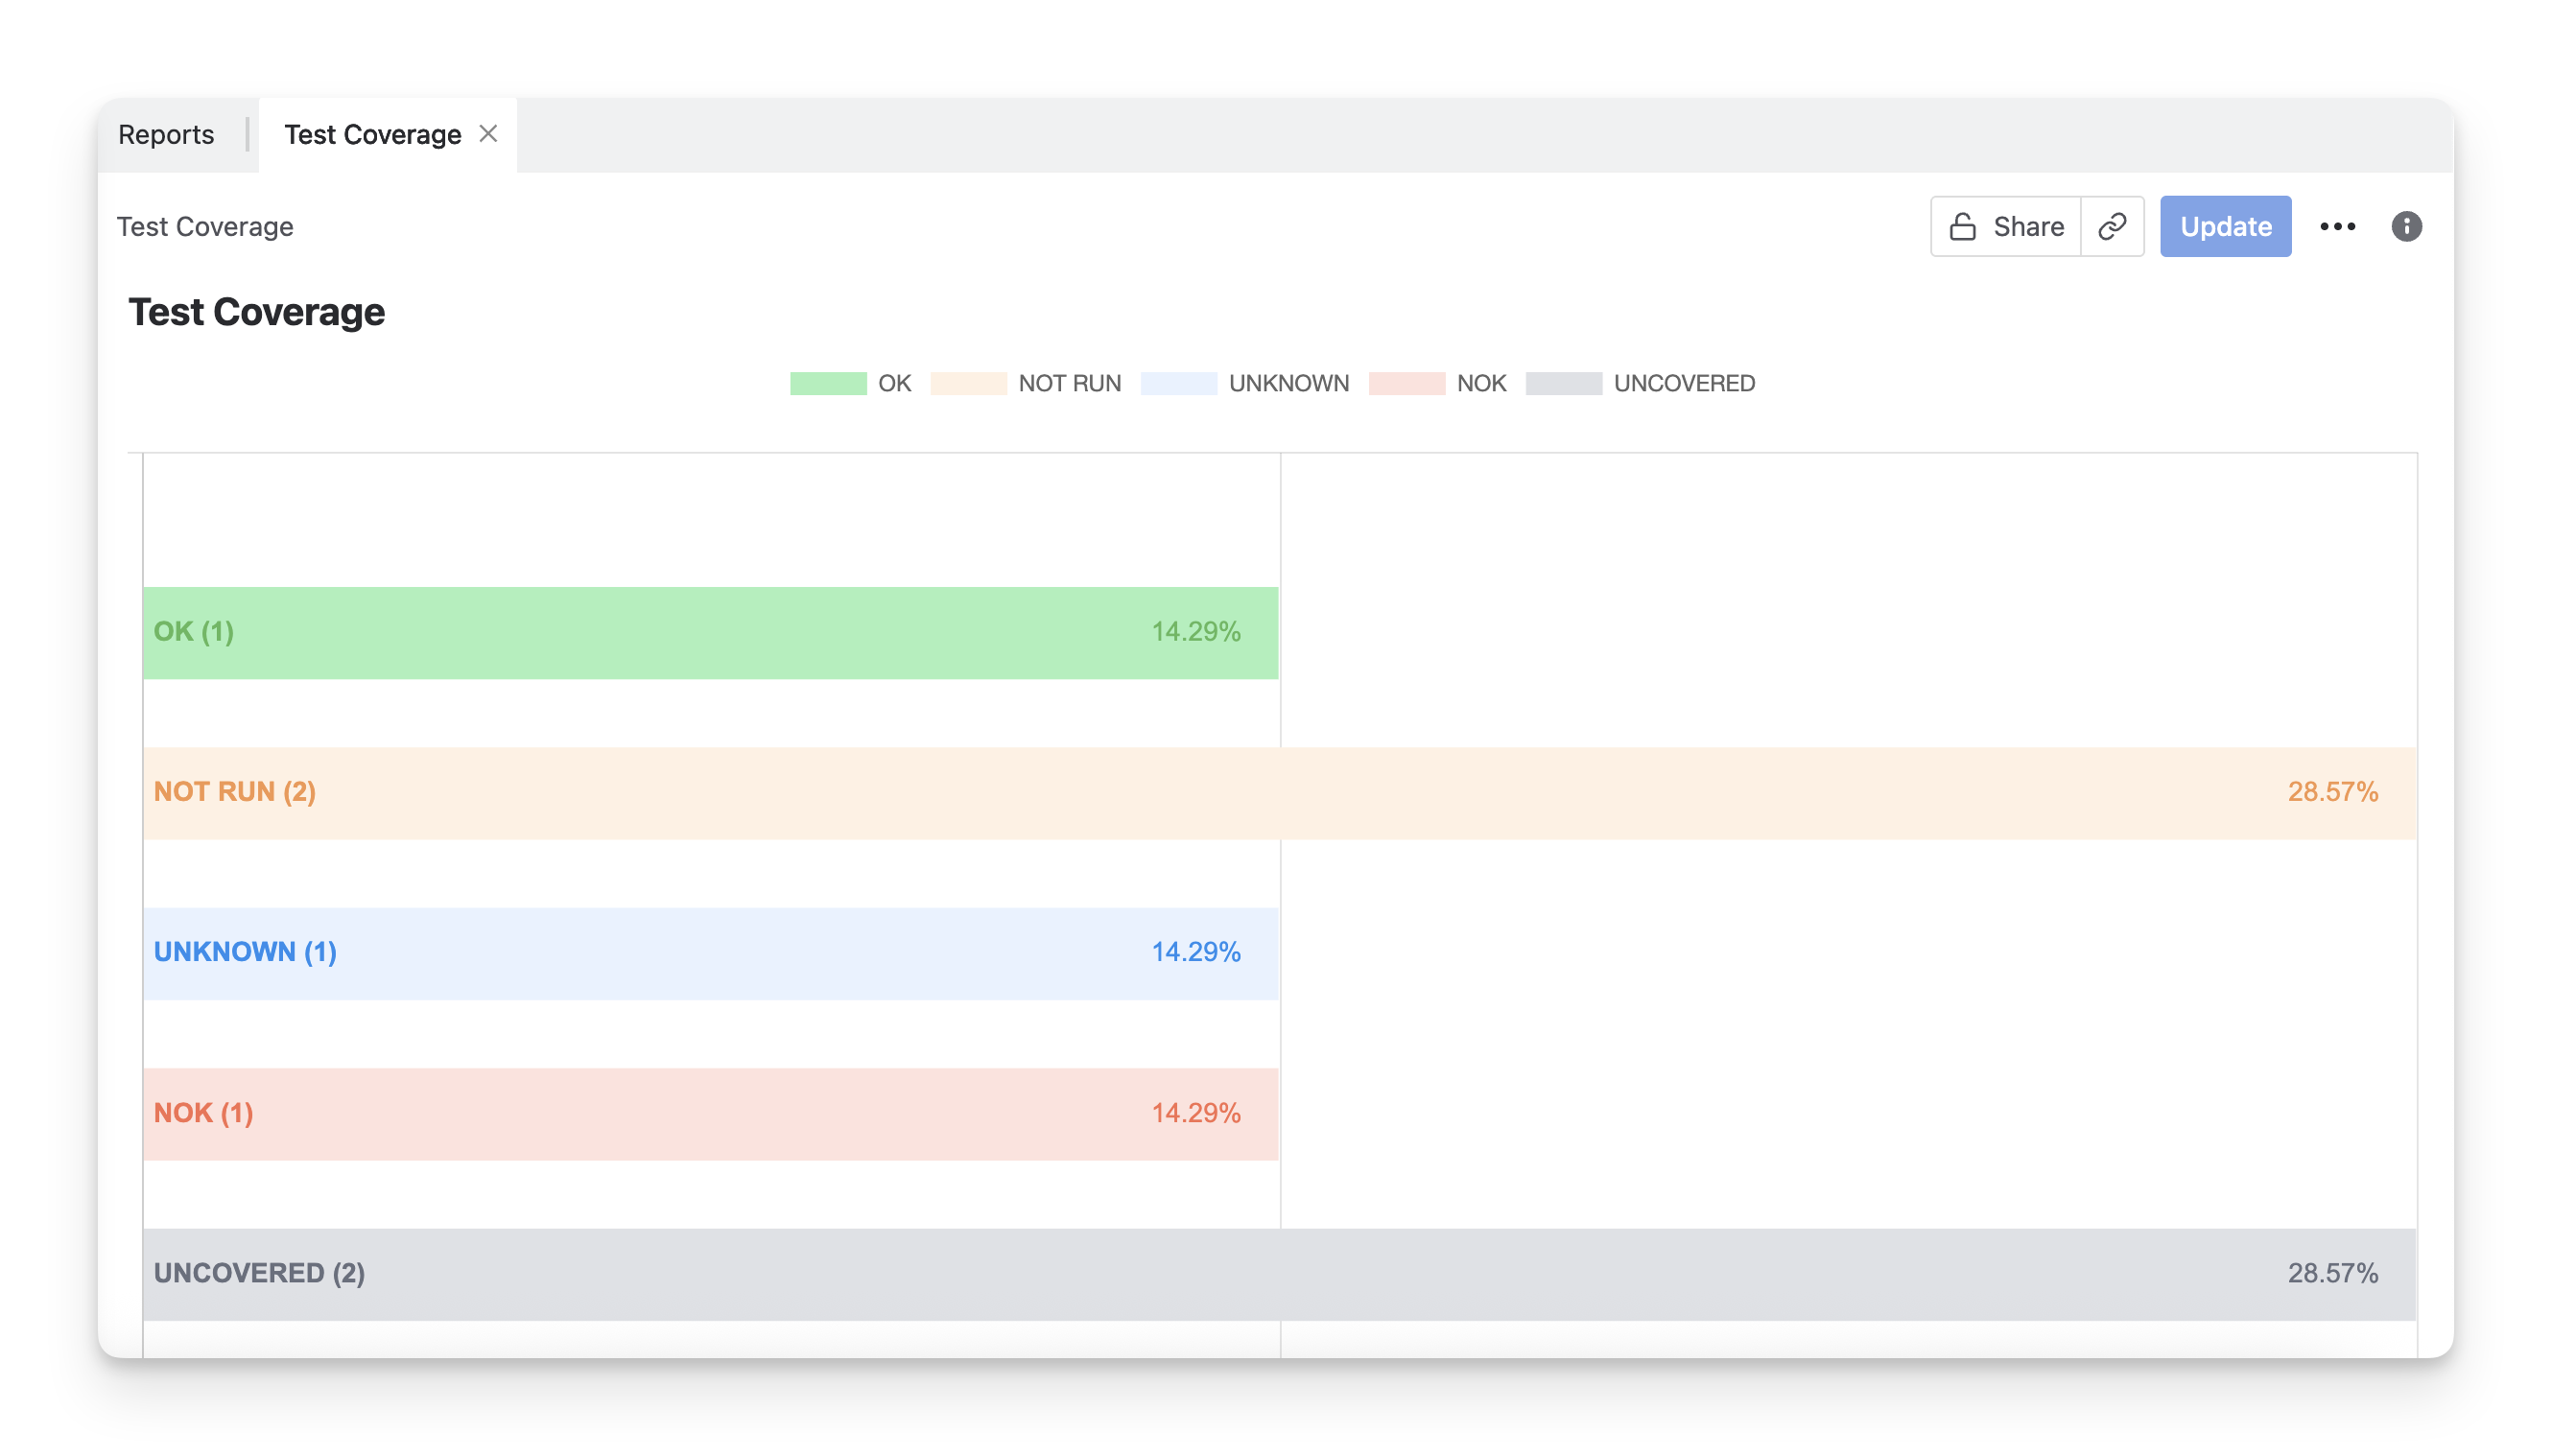
These requirement statuses include NOK ; not run ; Unknown ; ok ; Uncovered .
-
NOK : The requirement still has a/some Fail test cases.
-
not run : The requirement still has a/some todo test cases.
-
Unknown : The requirement still has a/some query / retest / Blocked test cases.
-
ok : The requirement has all pass / skipped test cases.
-
Uncovered : The requirement has no test cases.
In this section, you can:
-
Control how requirement status is calculated by selecting which test cases are included in the analysis using the Analysis & Scope dropdown
-
Refine the displayed results by applying Filters.
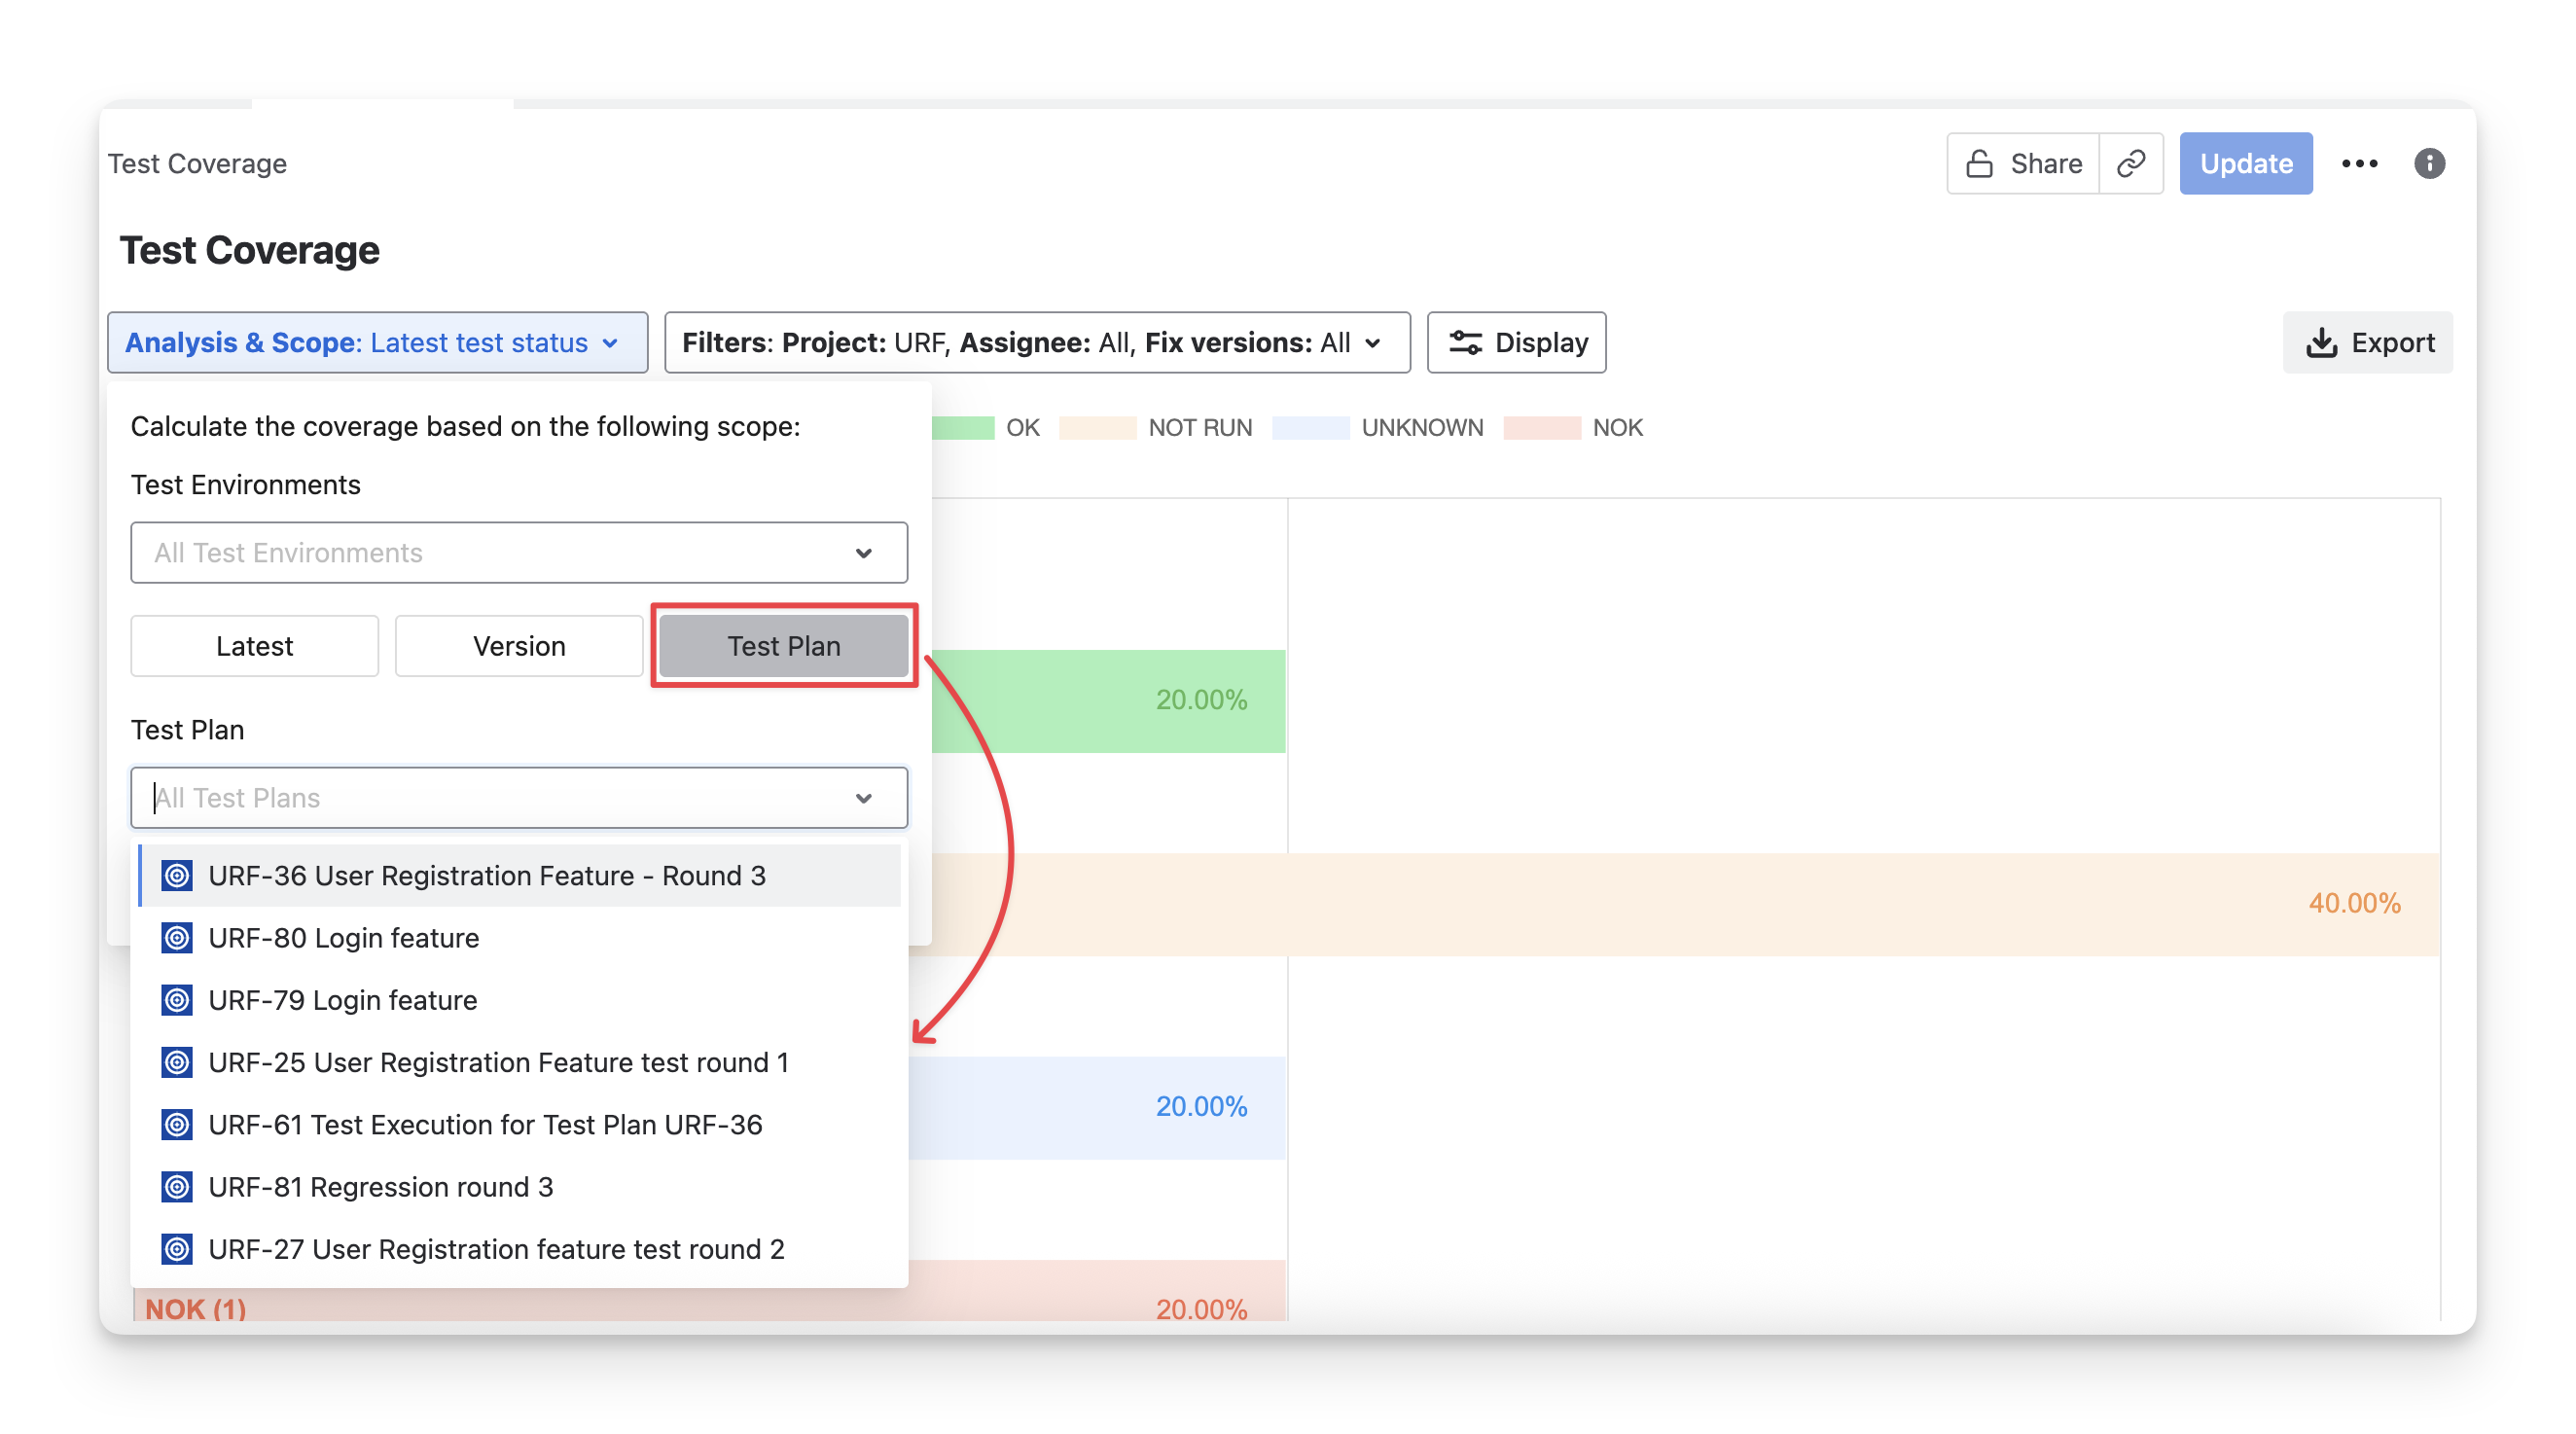
1.1 Analysis & Scope
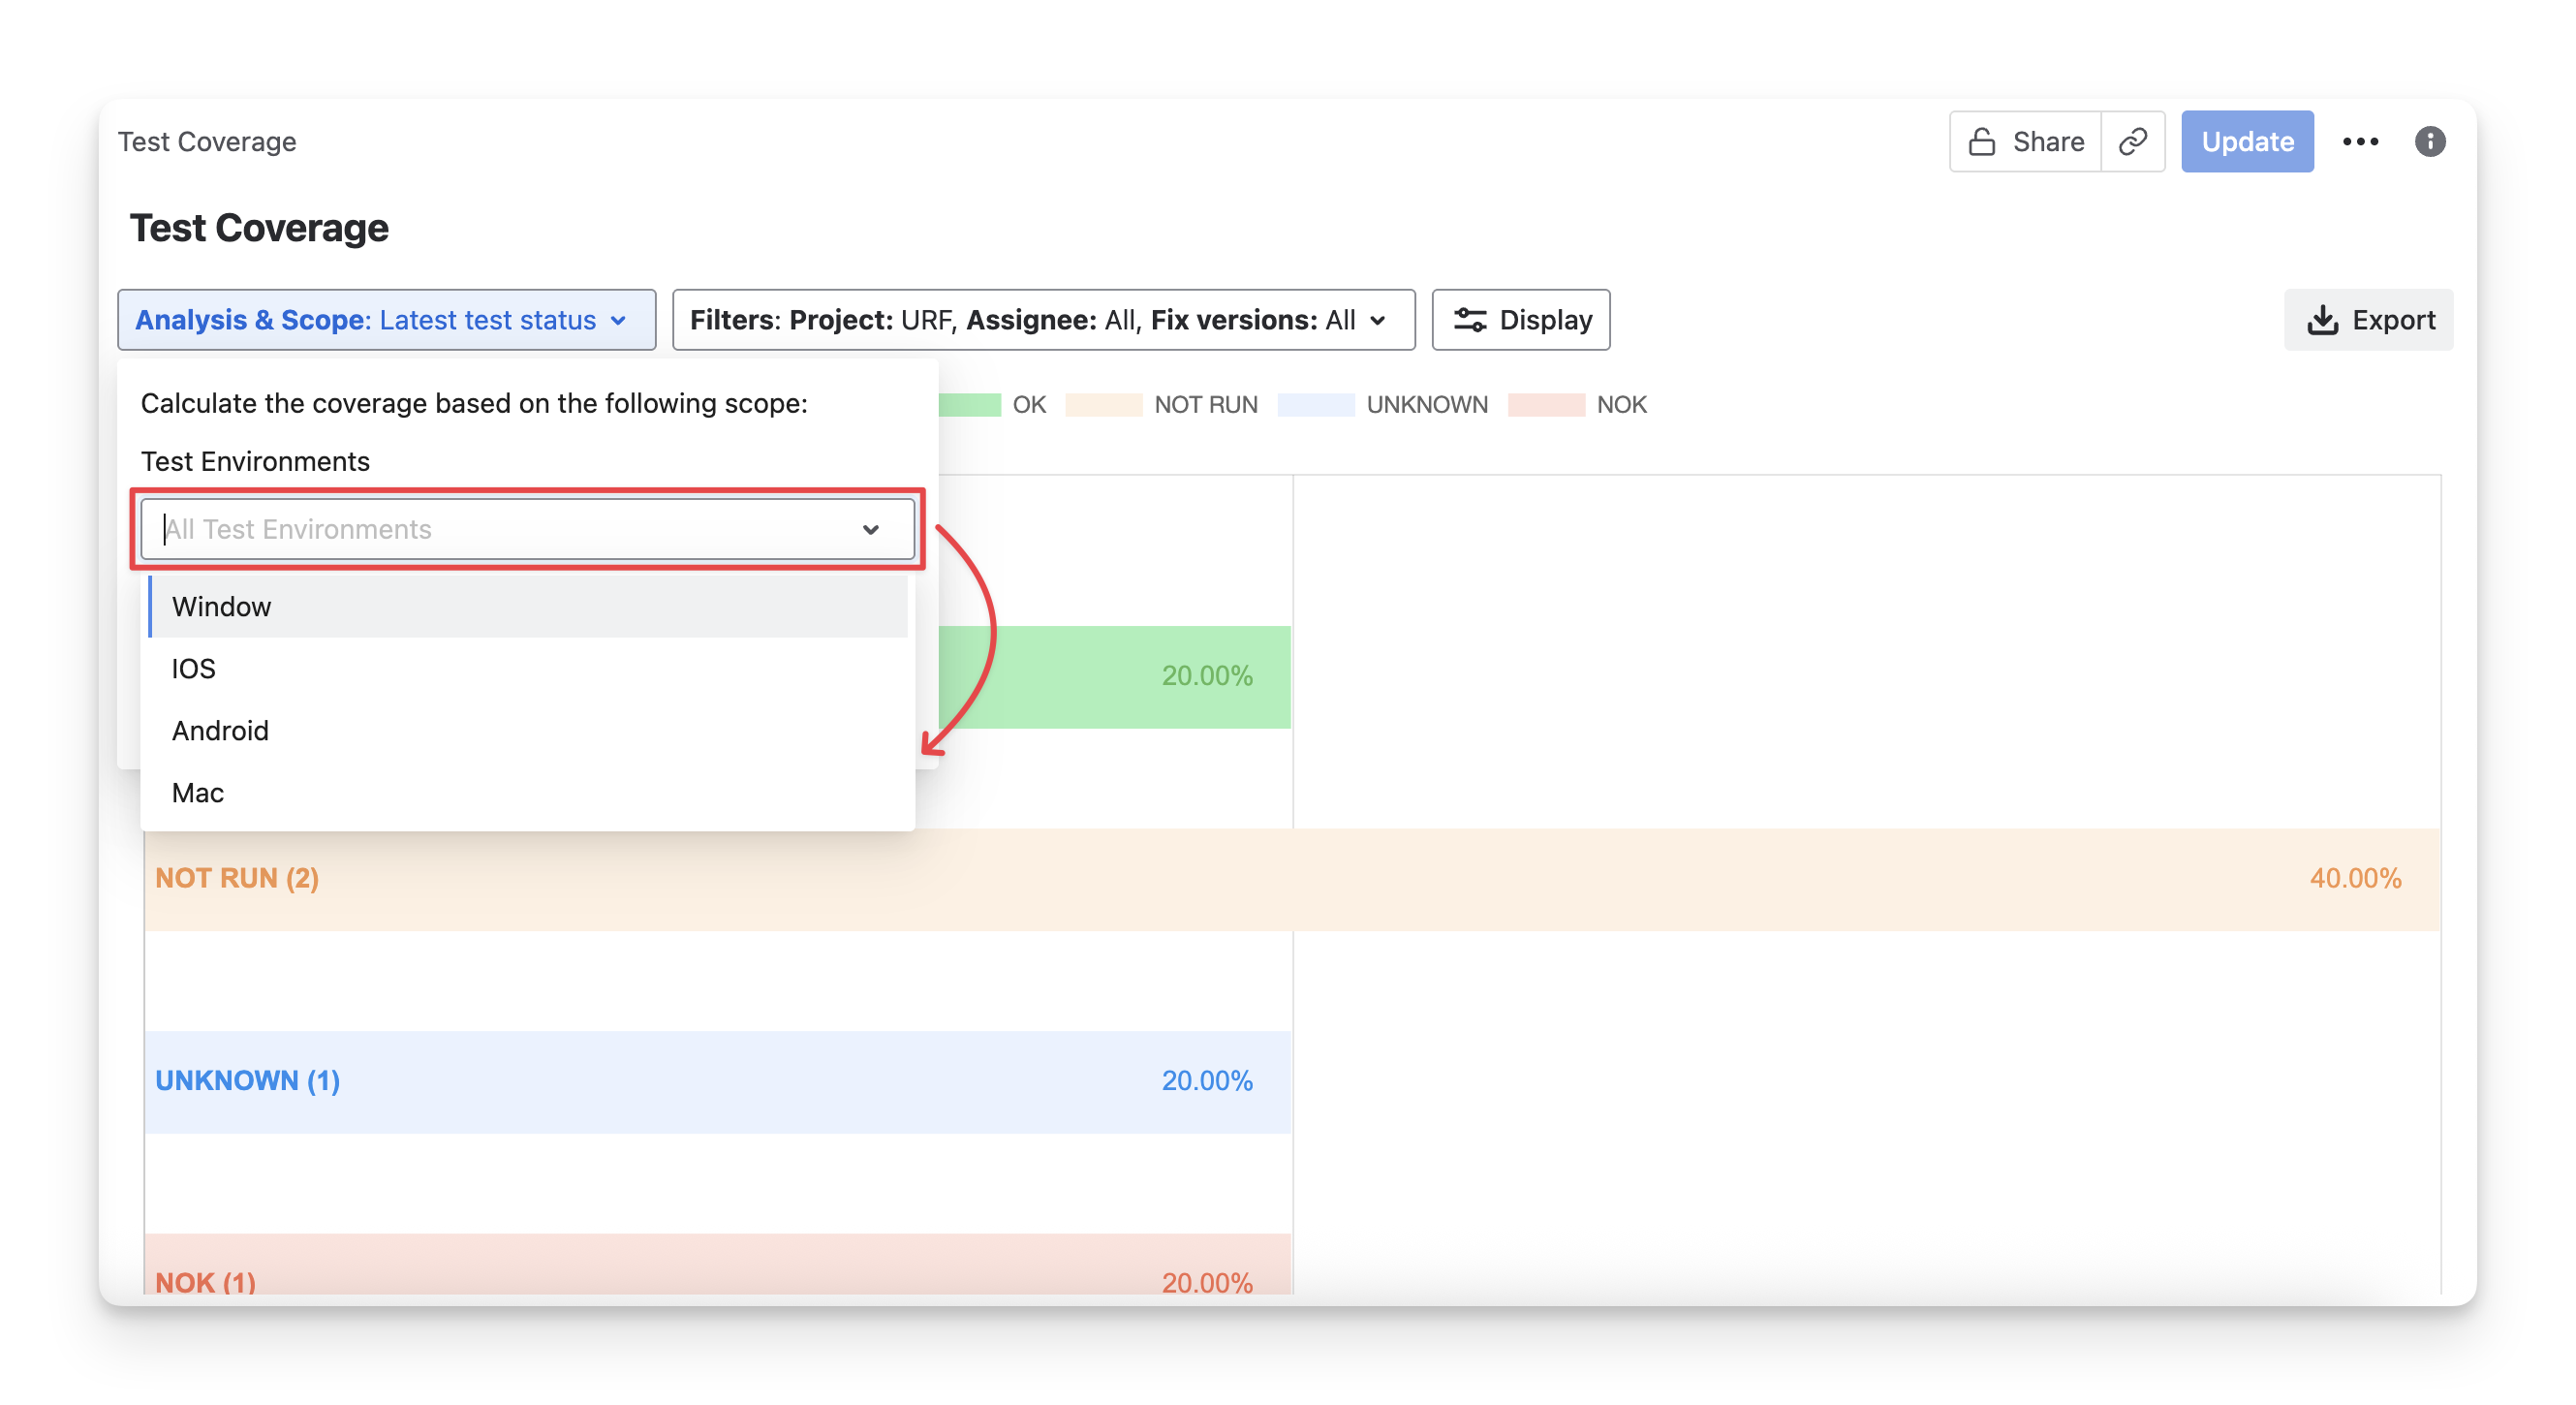
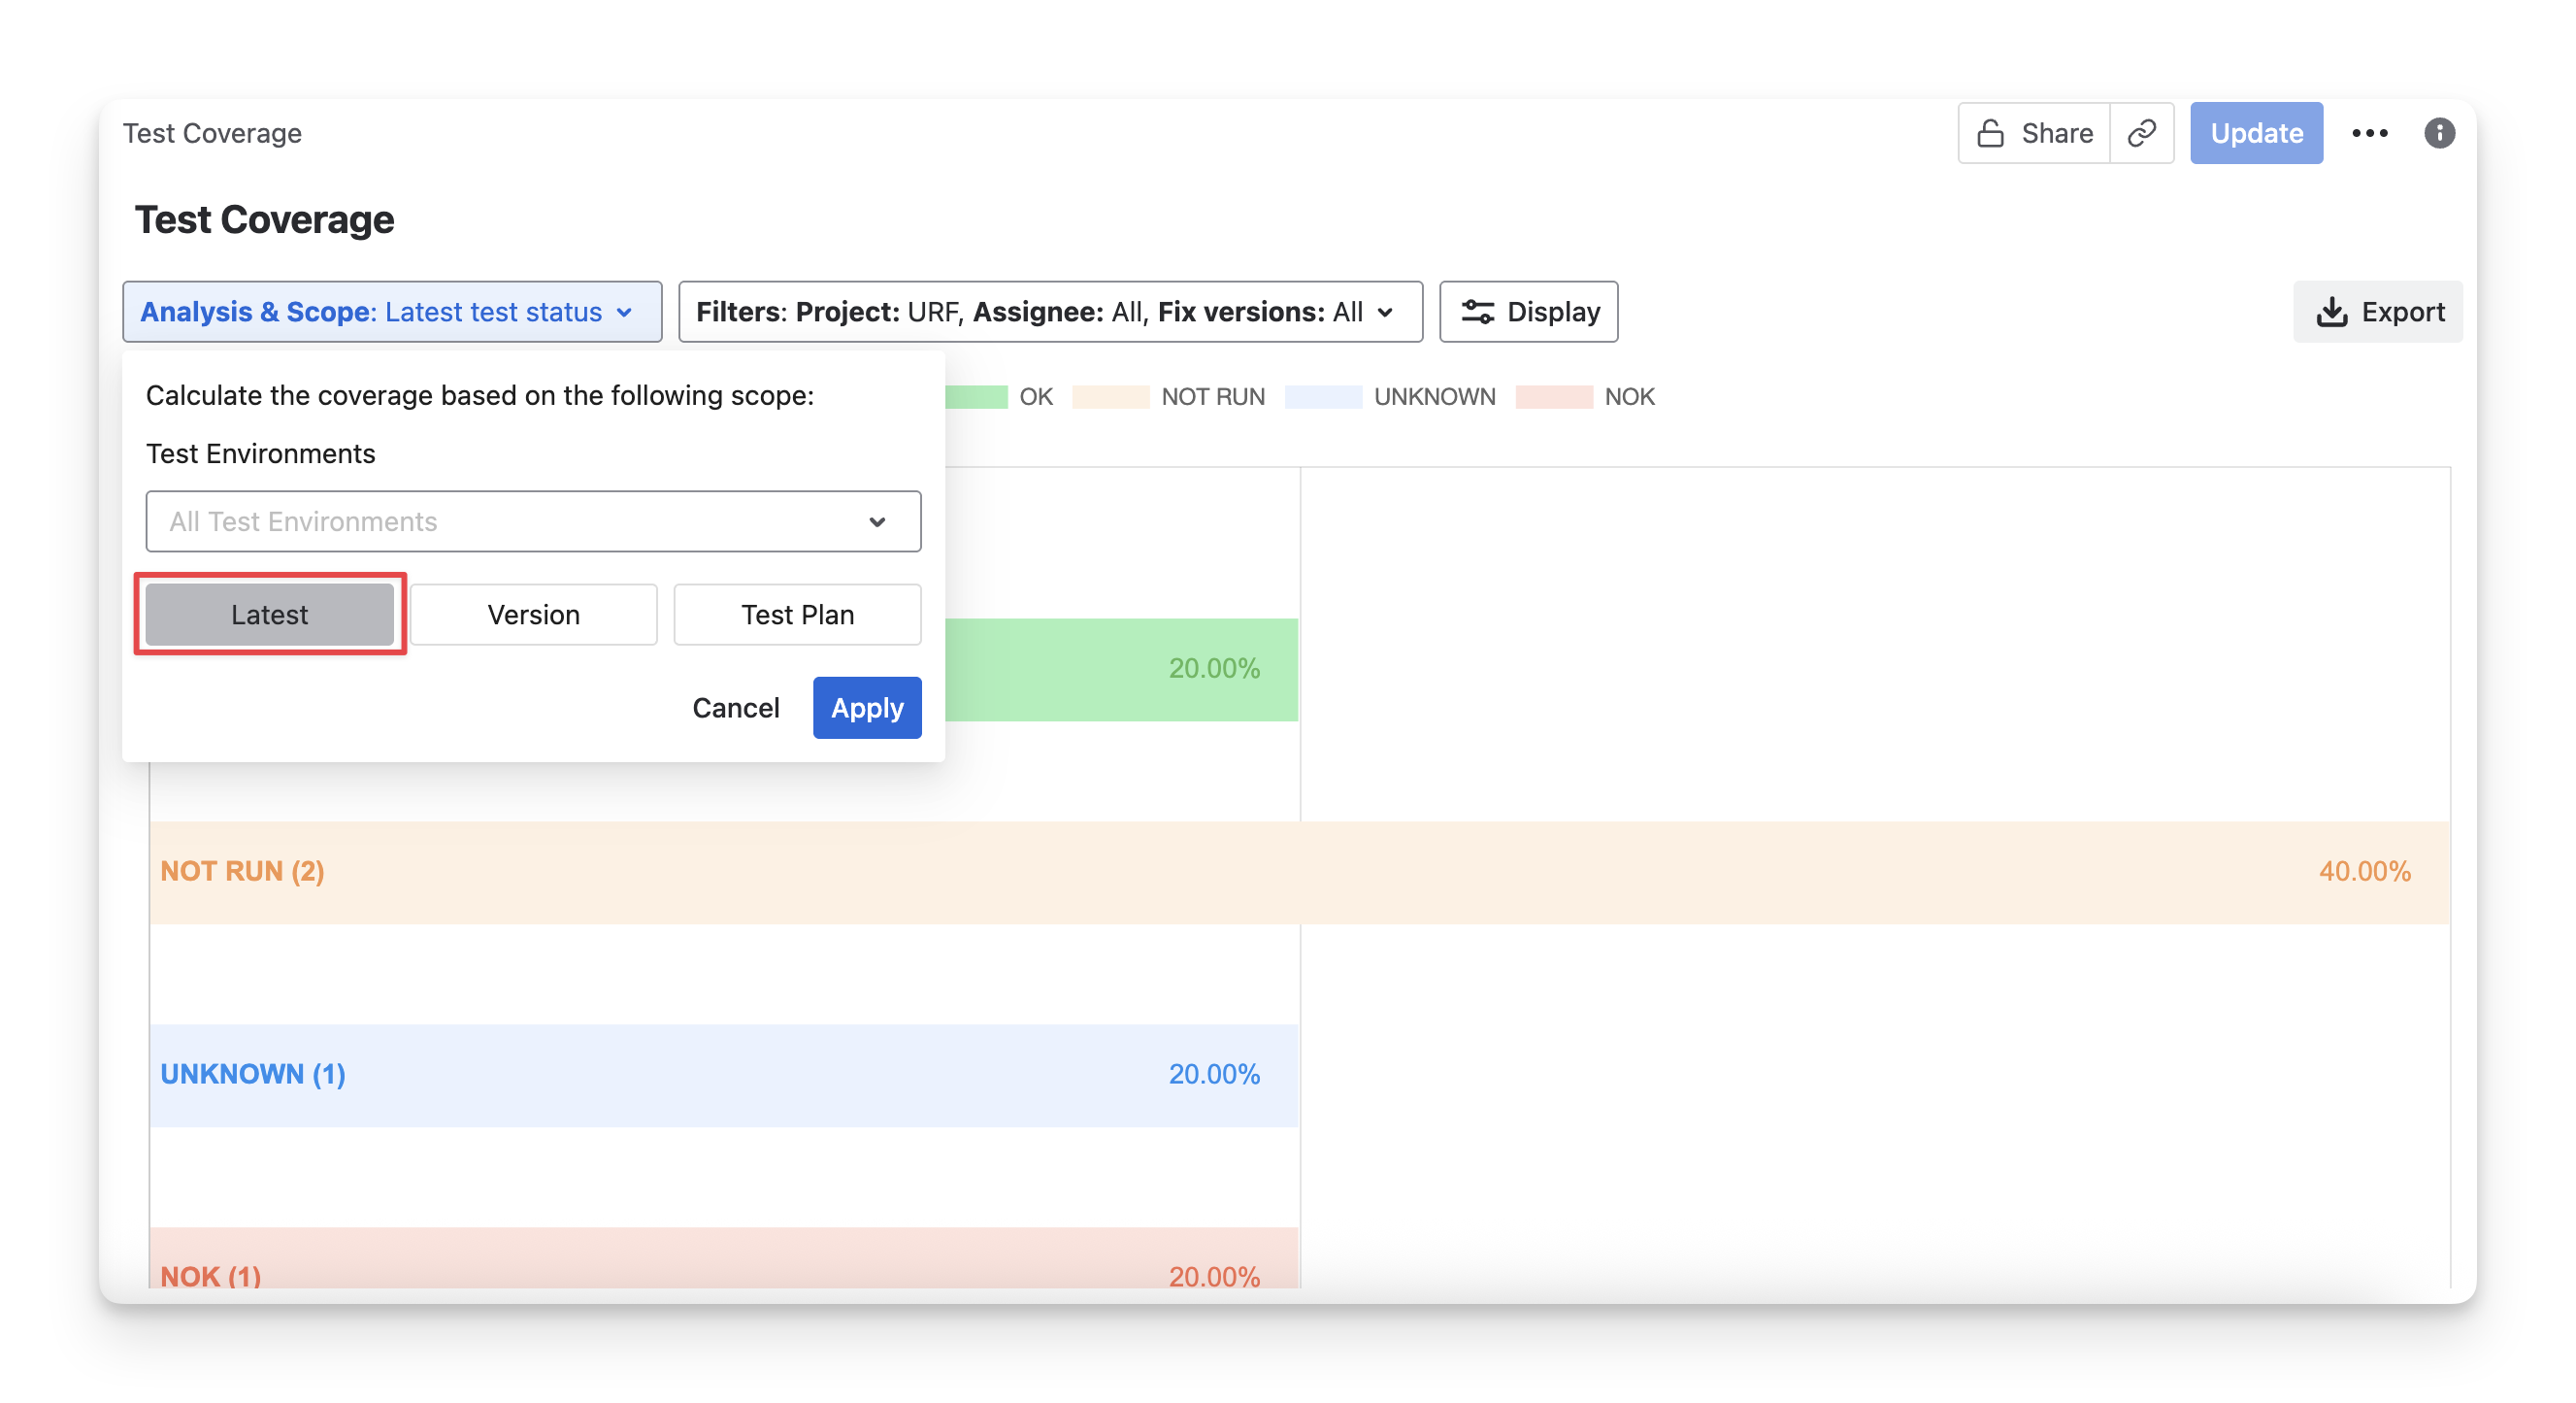
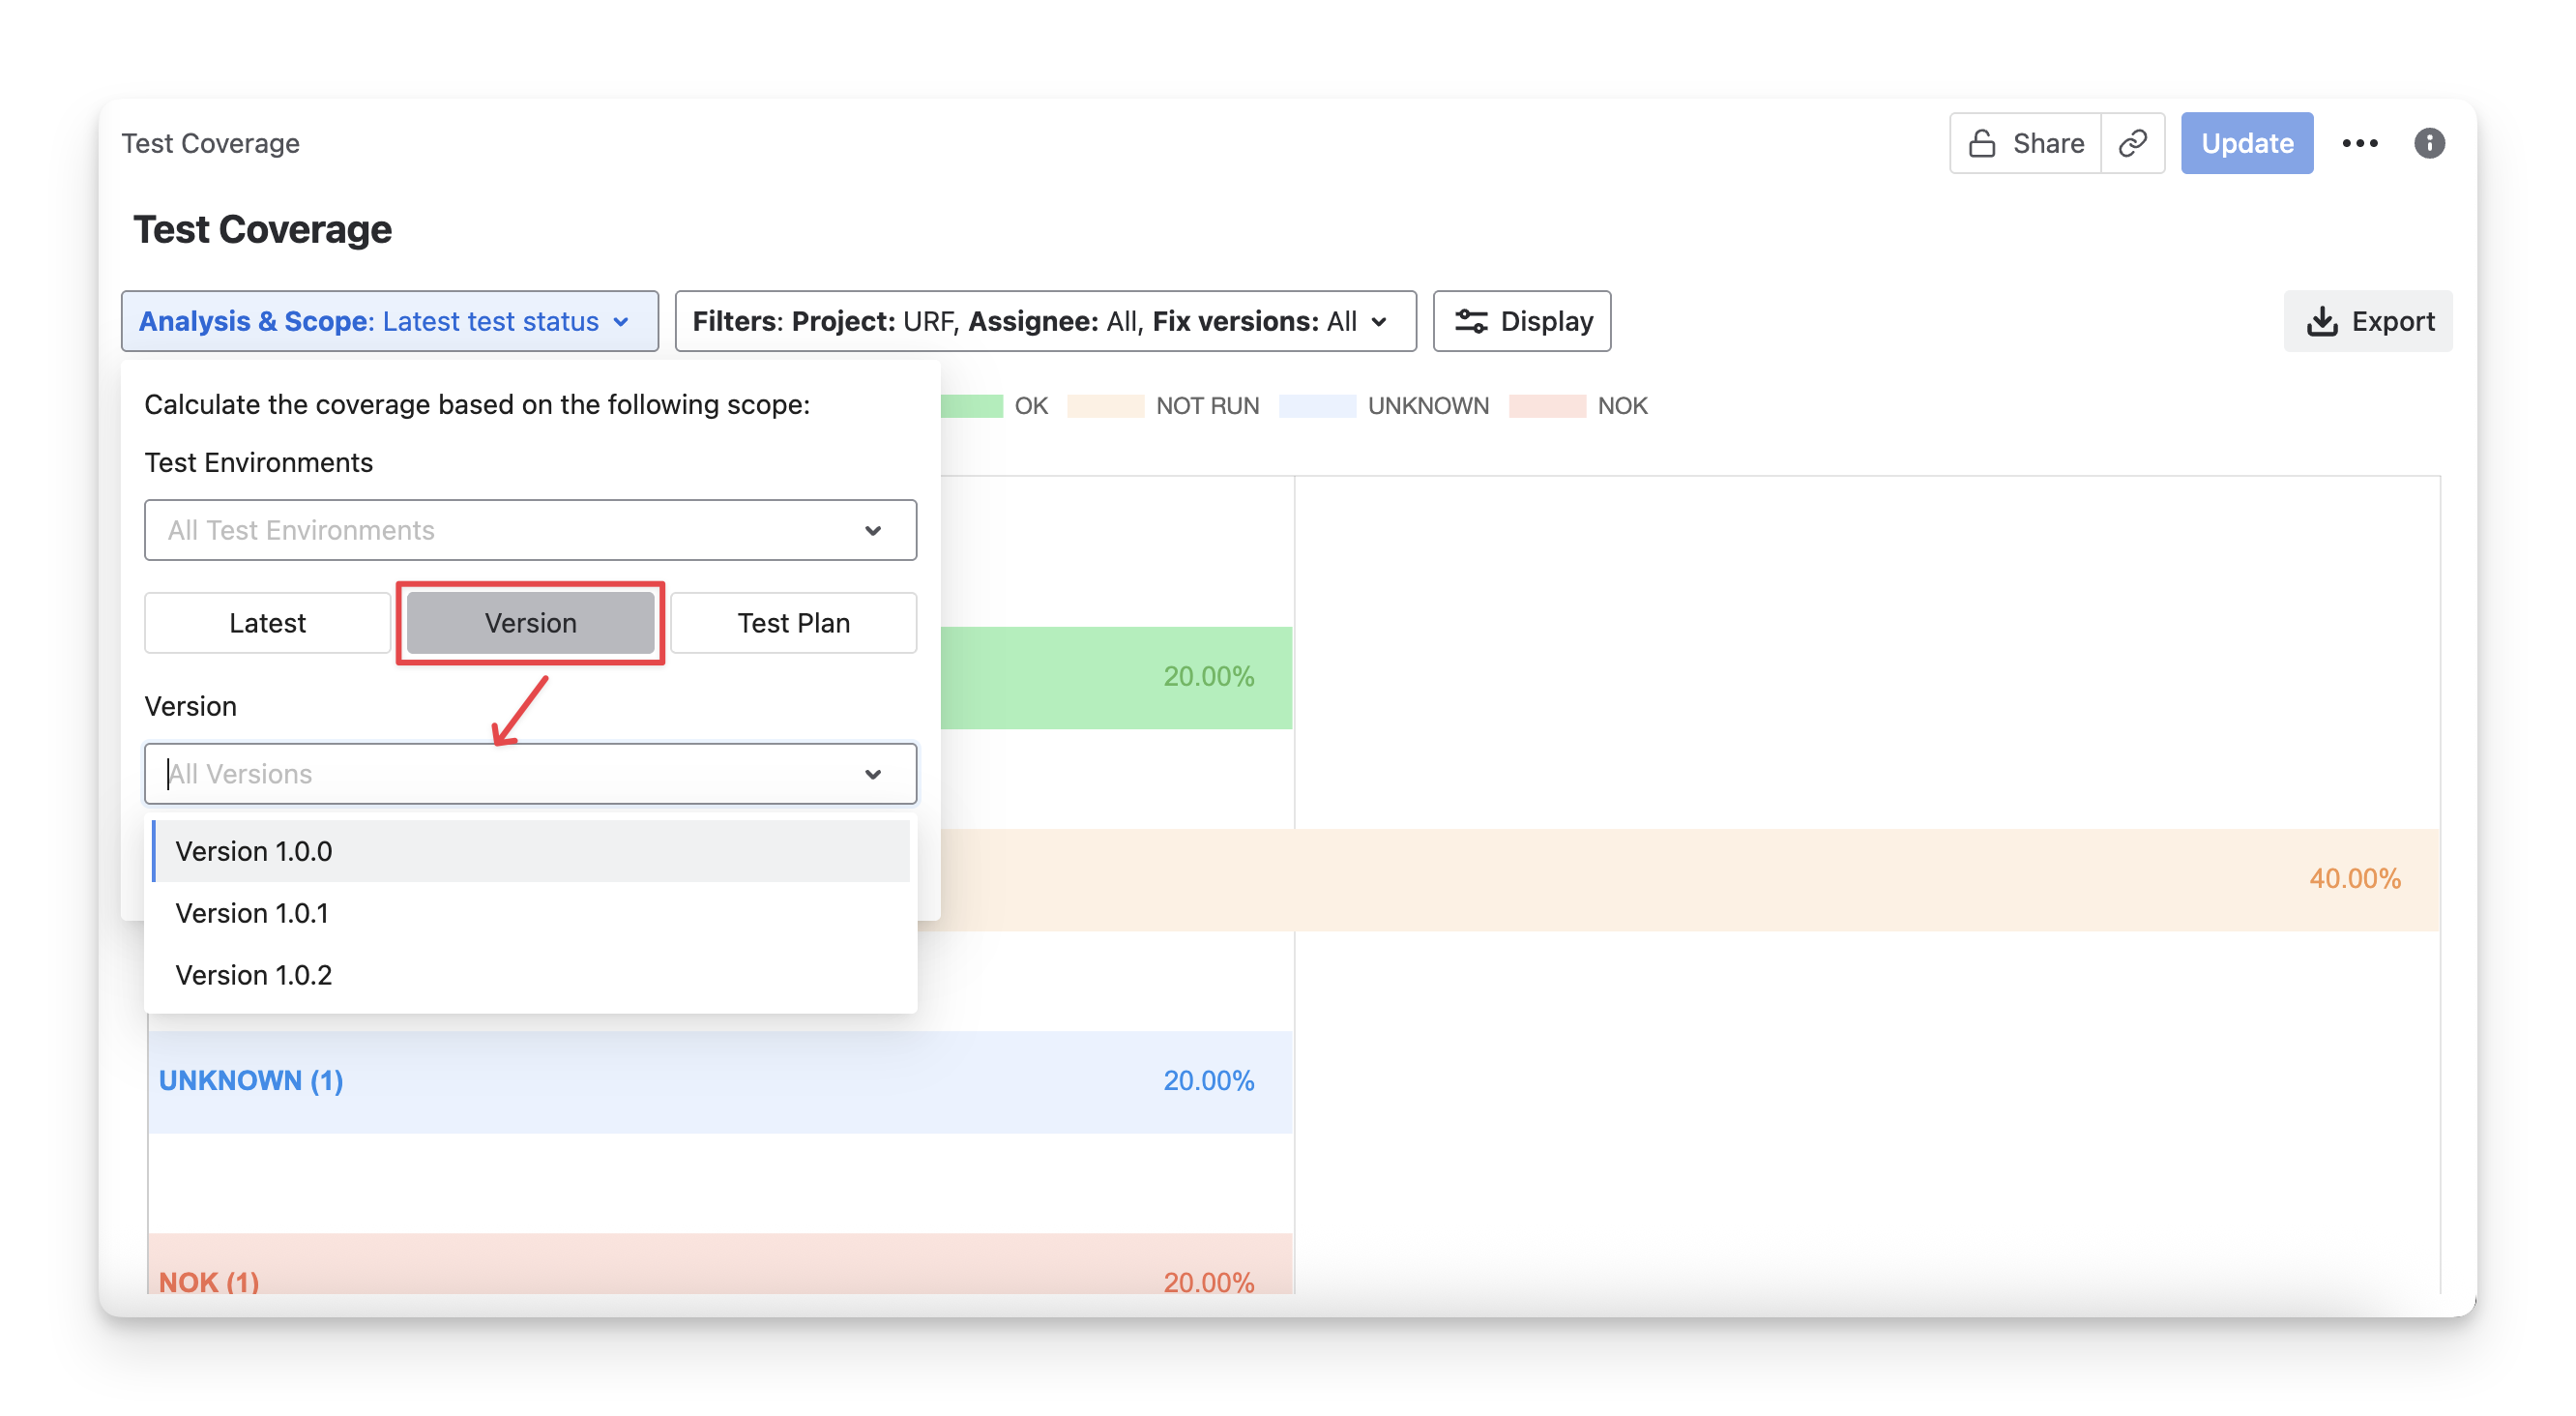
By default, AgileTest calculates the requirement status from the latest status of all linked test cases. To limit the test cases used for these requirements, click the “Analysis & Scope” dropdown.
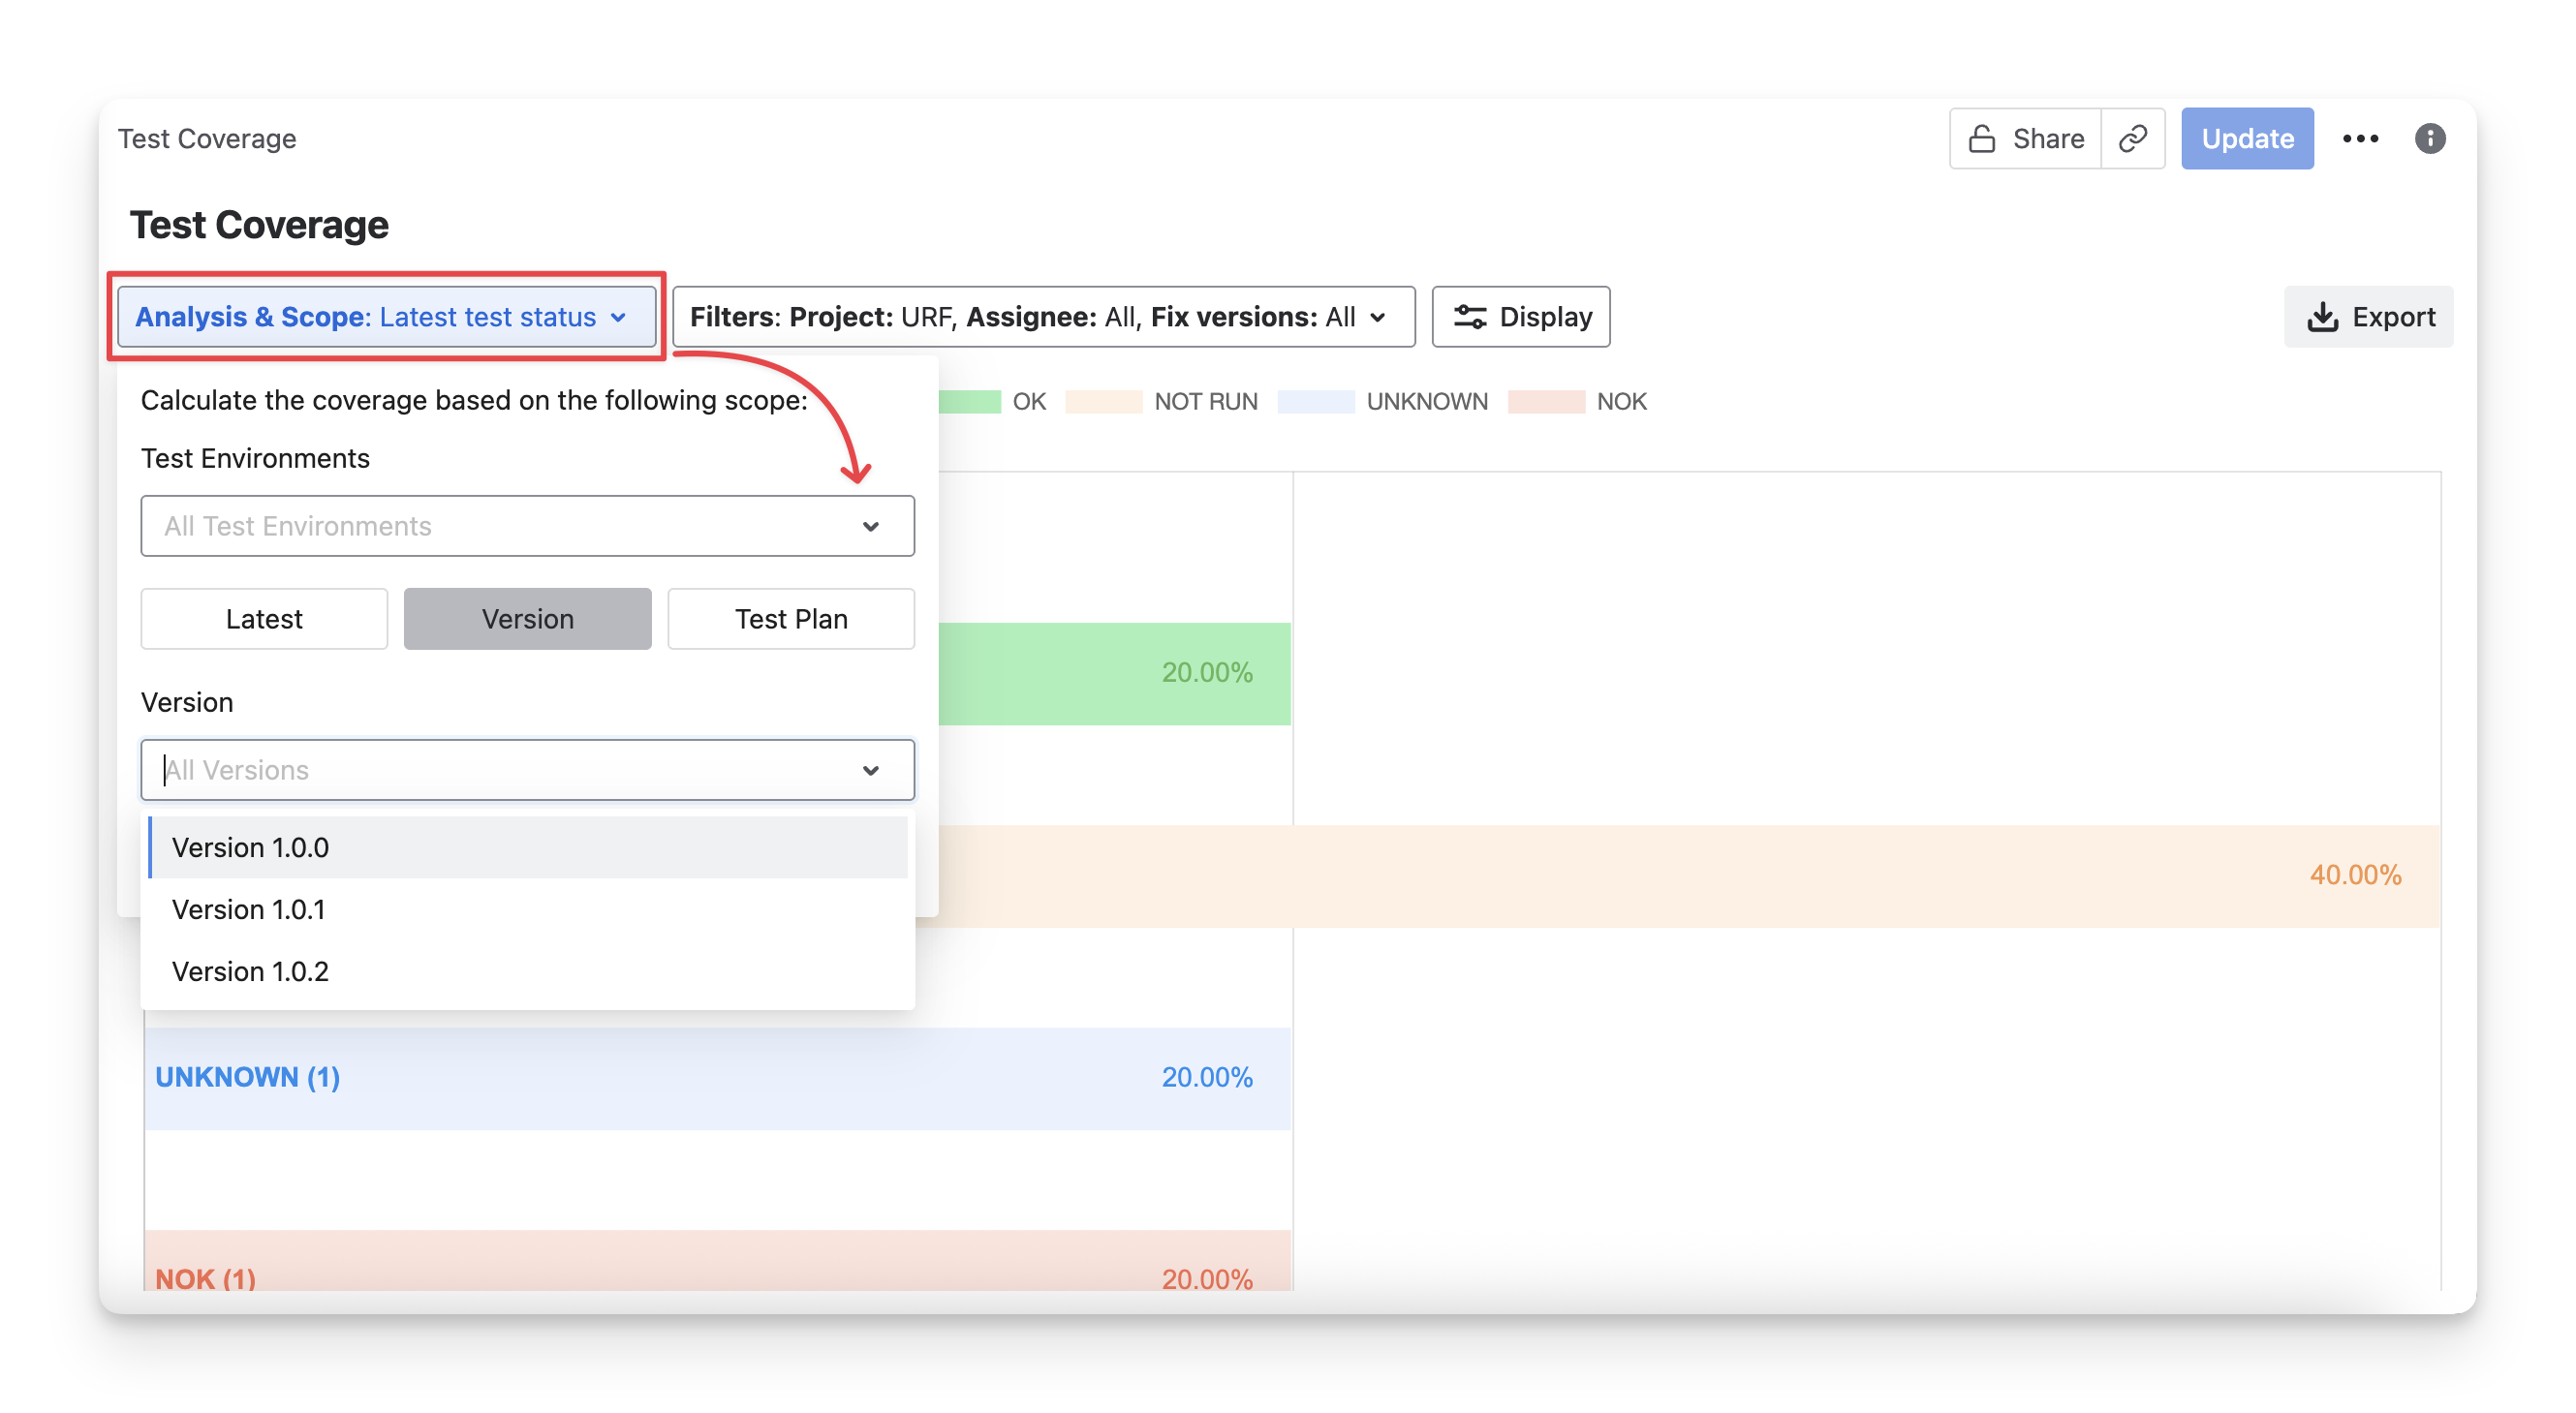
Here, you have the options to narrow down the scope by:
-
Test Environment: Only calculate the status from test cases that have been executed in a specific testing environment.
-
Last Execution Result: Default option, count the latest execution status of the test cases.
-
Version: Only calculate status from test cases associated with a specific Jira fix version.
-
Test Plan: Only calculate status from test cases that belong to a specific test plan.
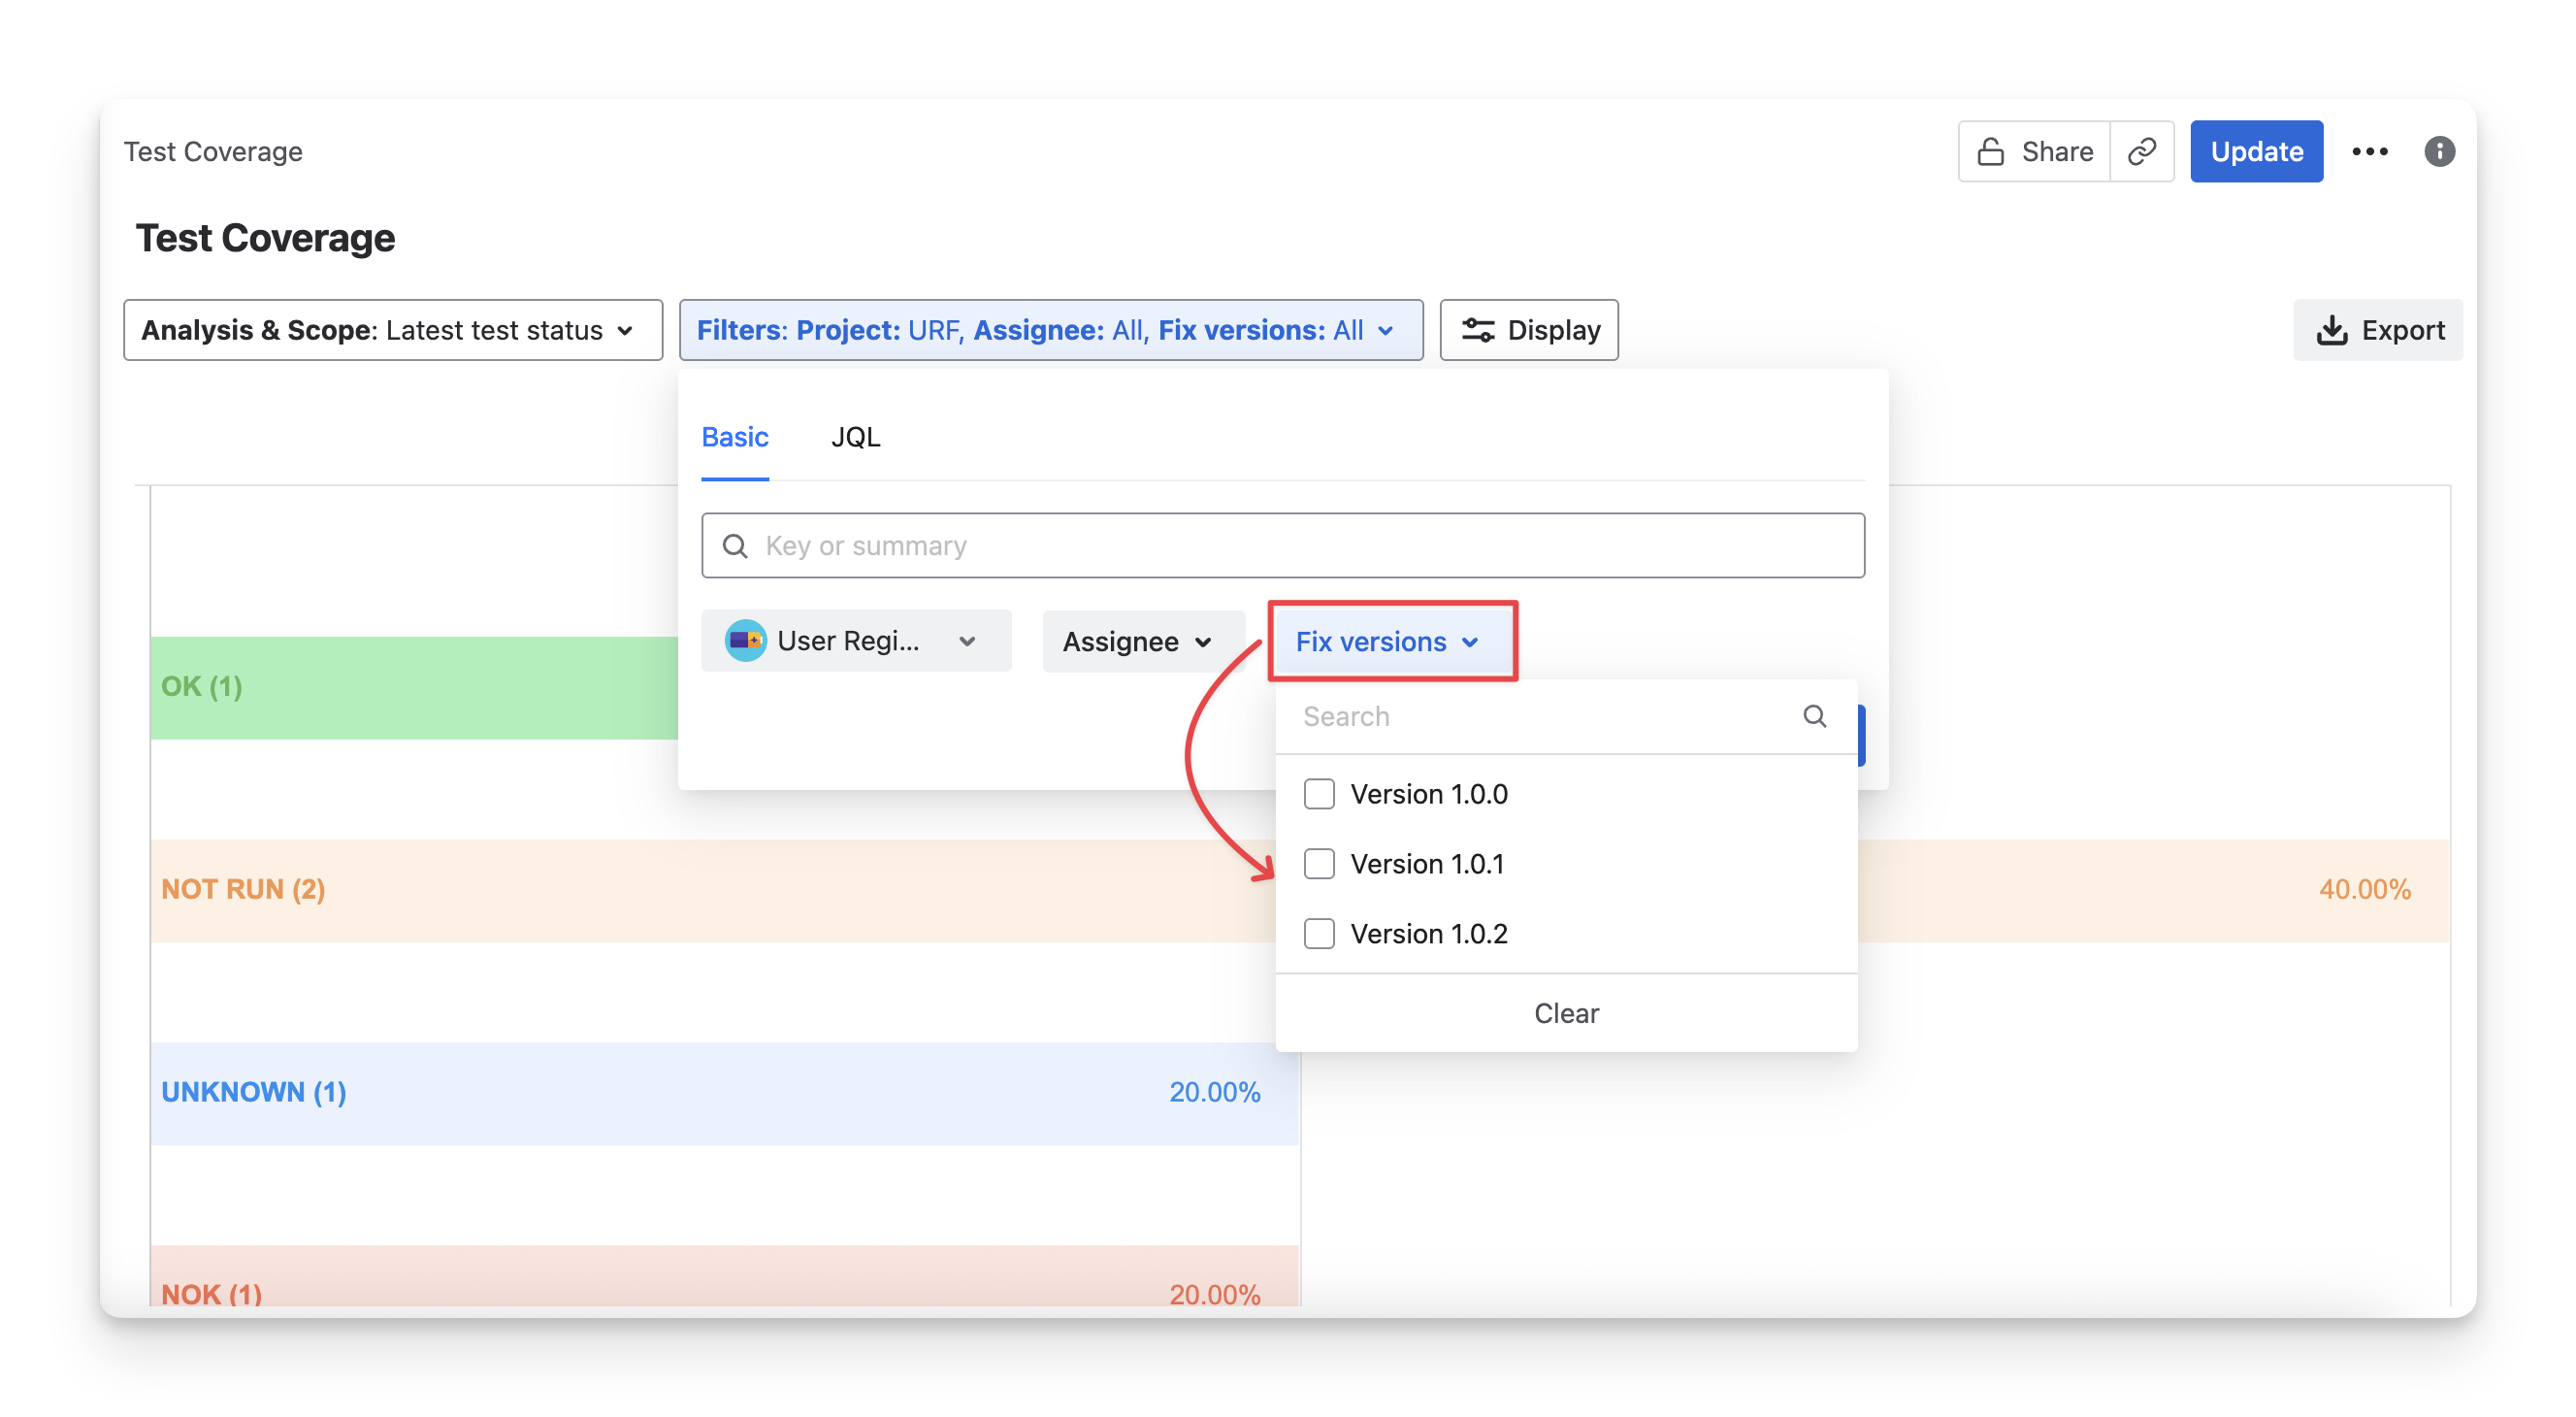
1.2 Filters
You can apply the filters to display some specific requirements that meet certain conditions.
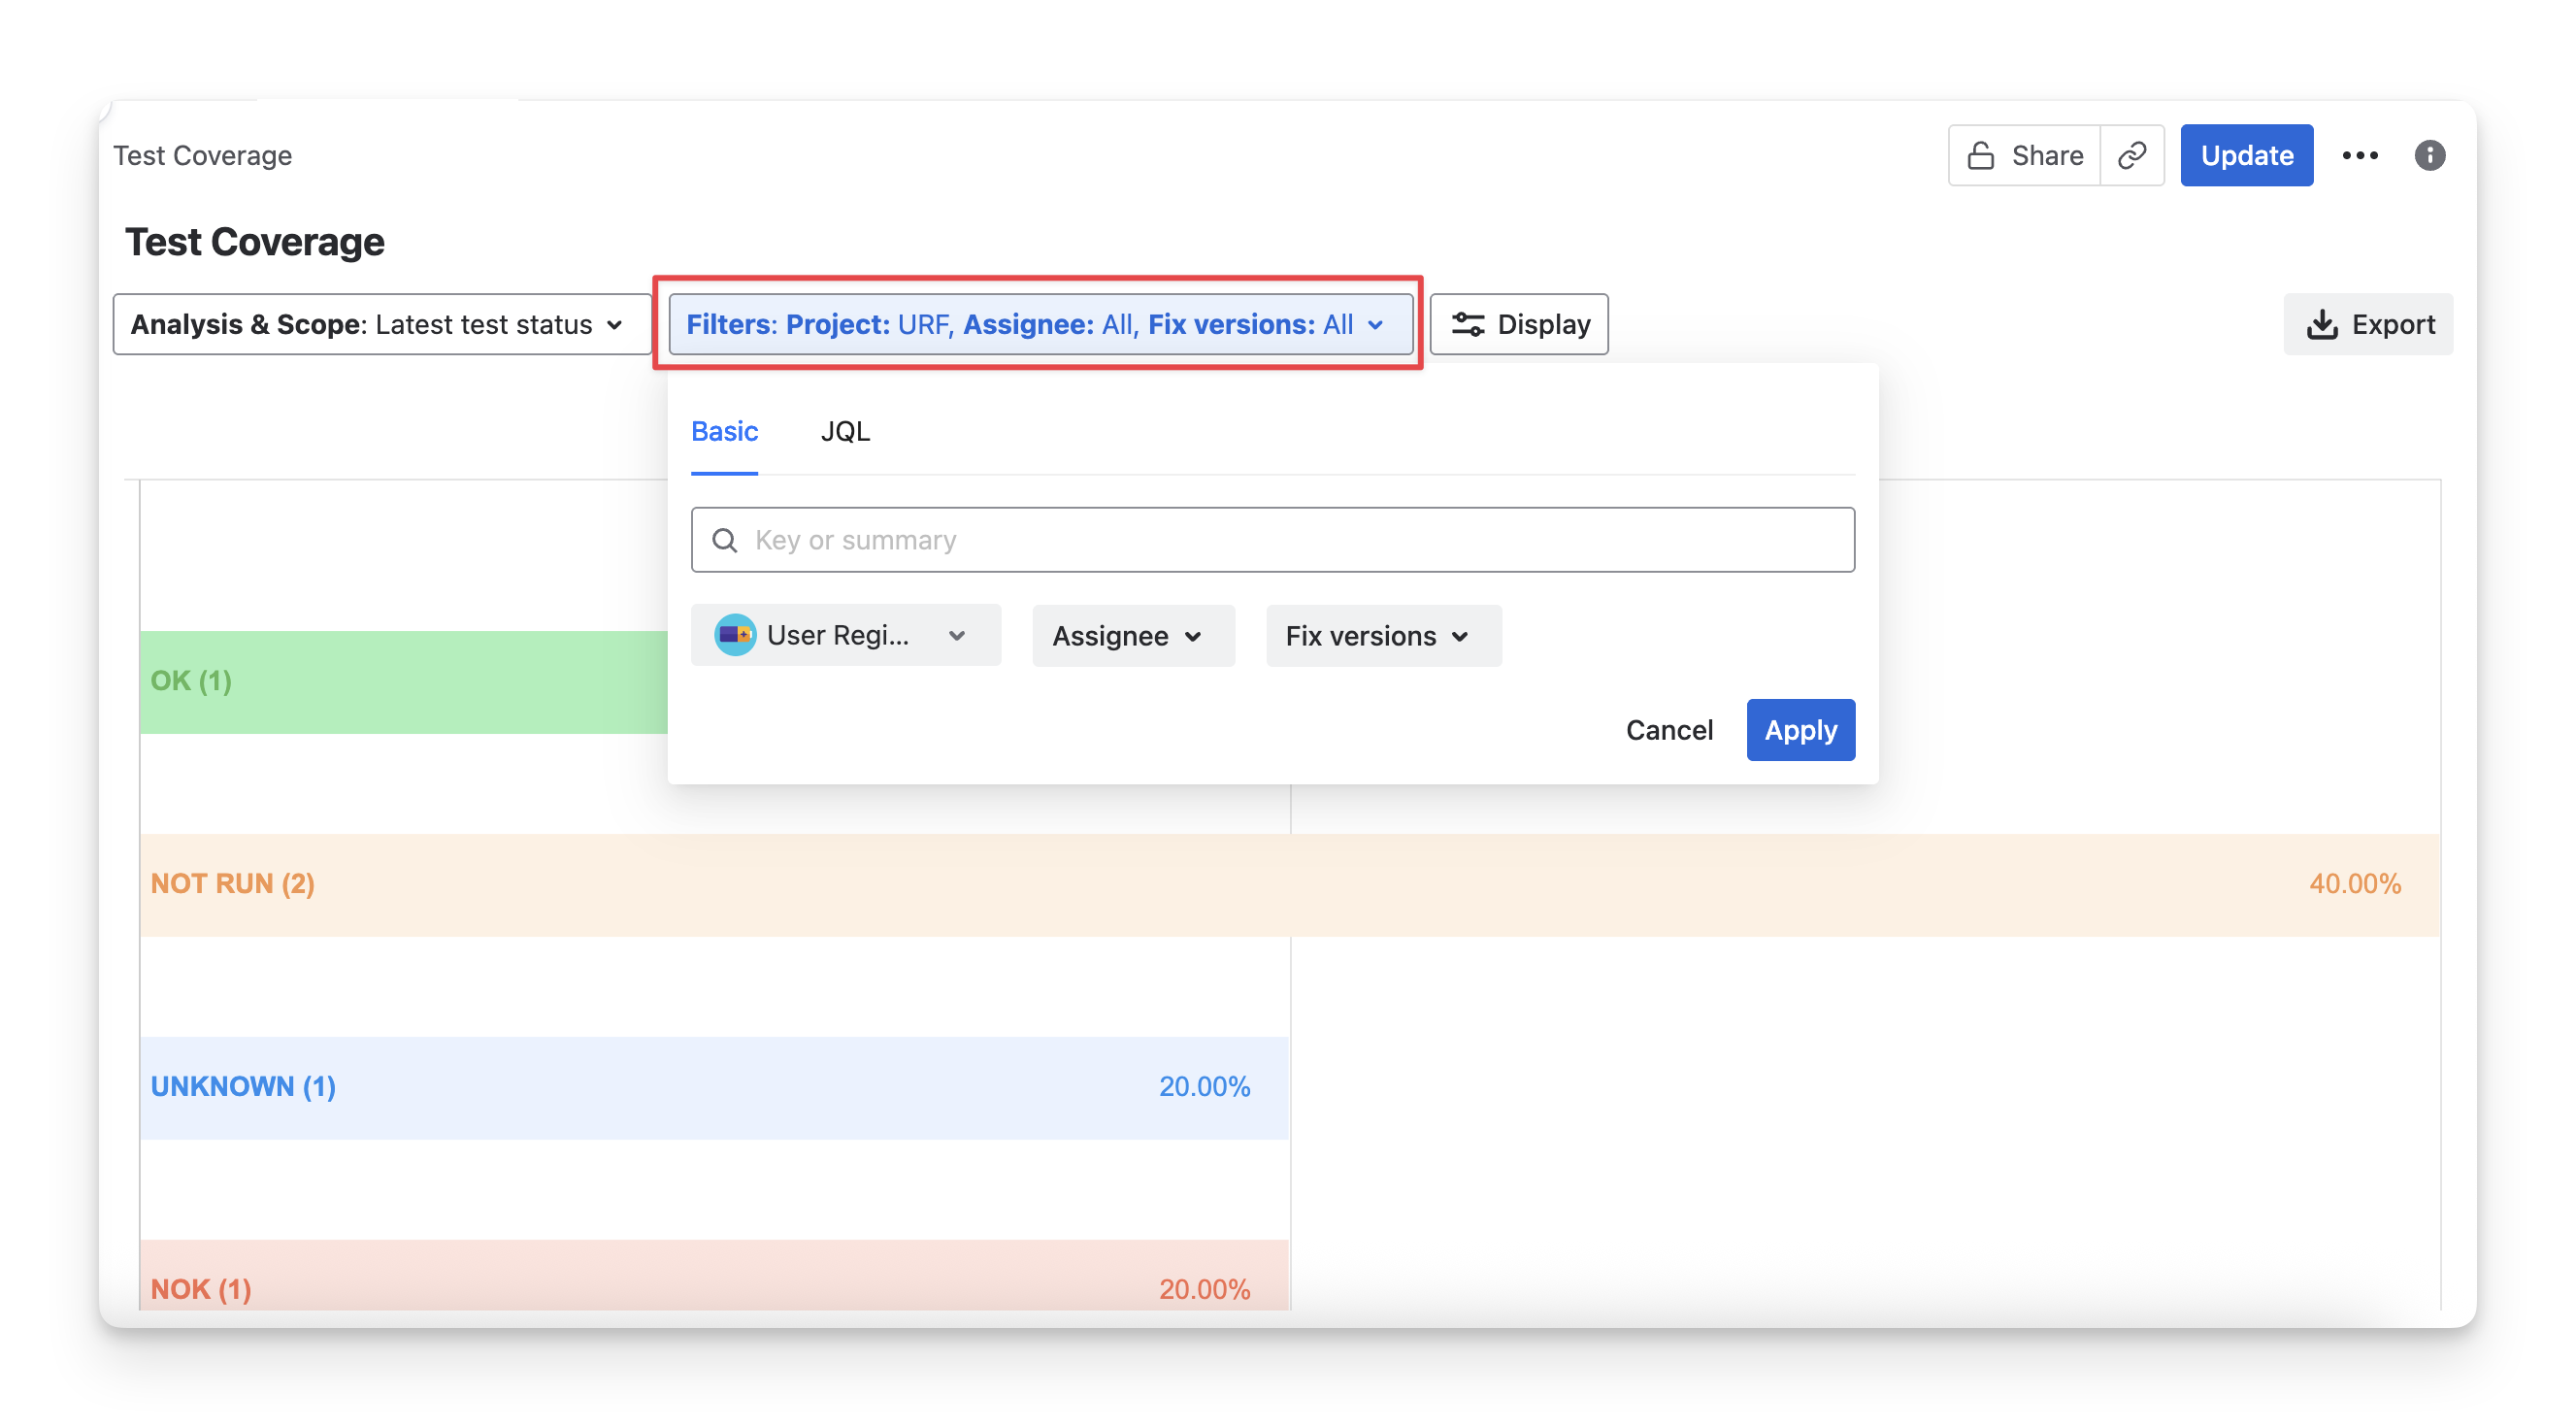
AgileTest supports you to filter by:
-
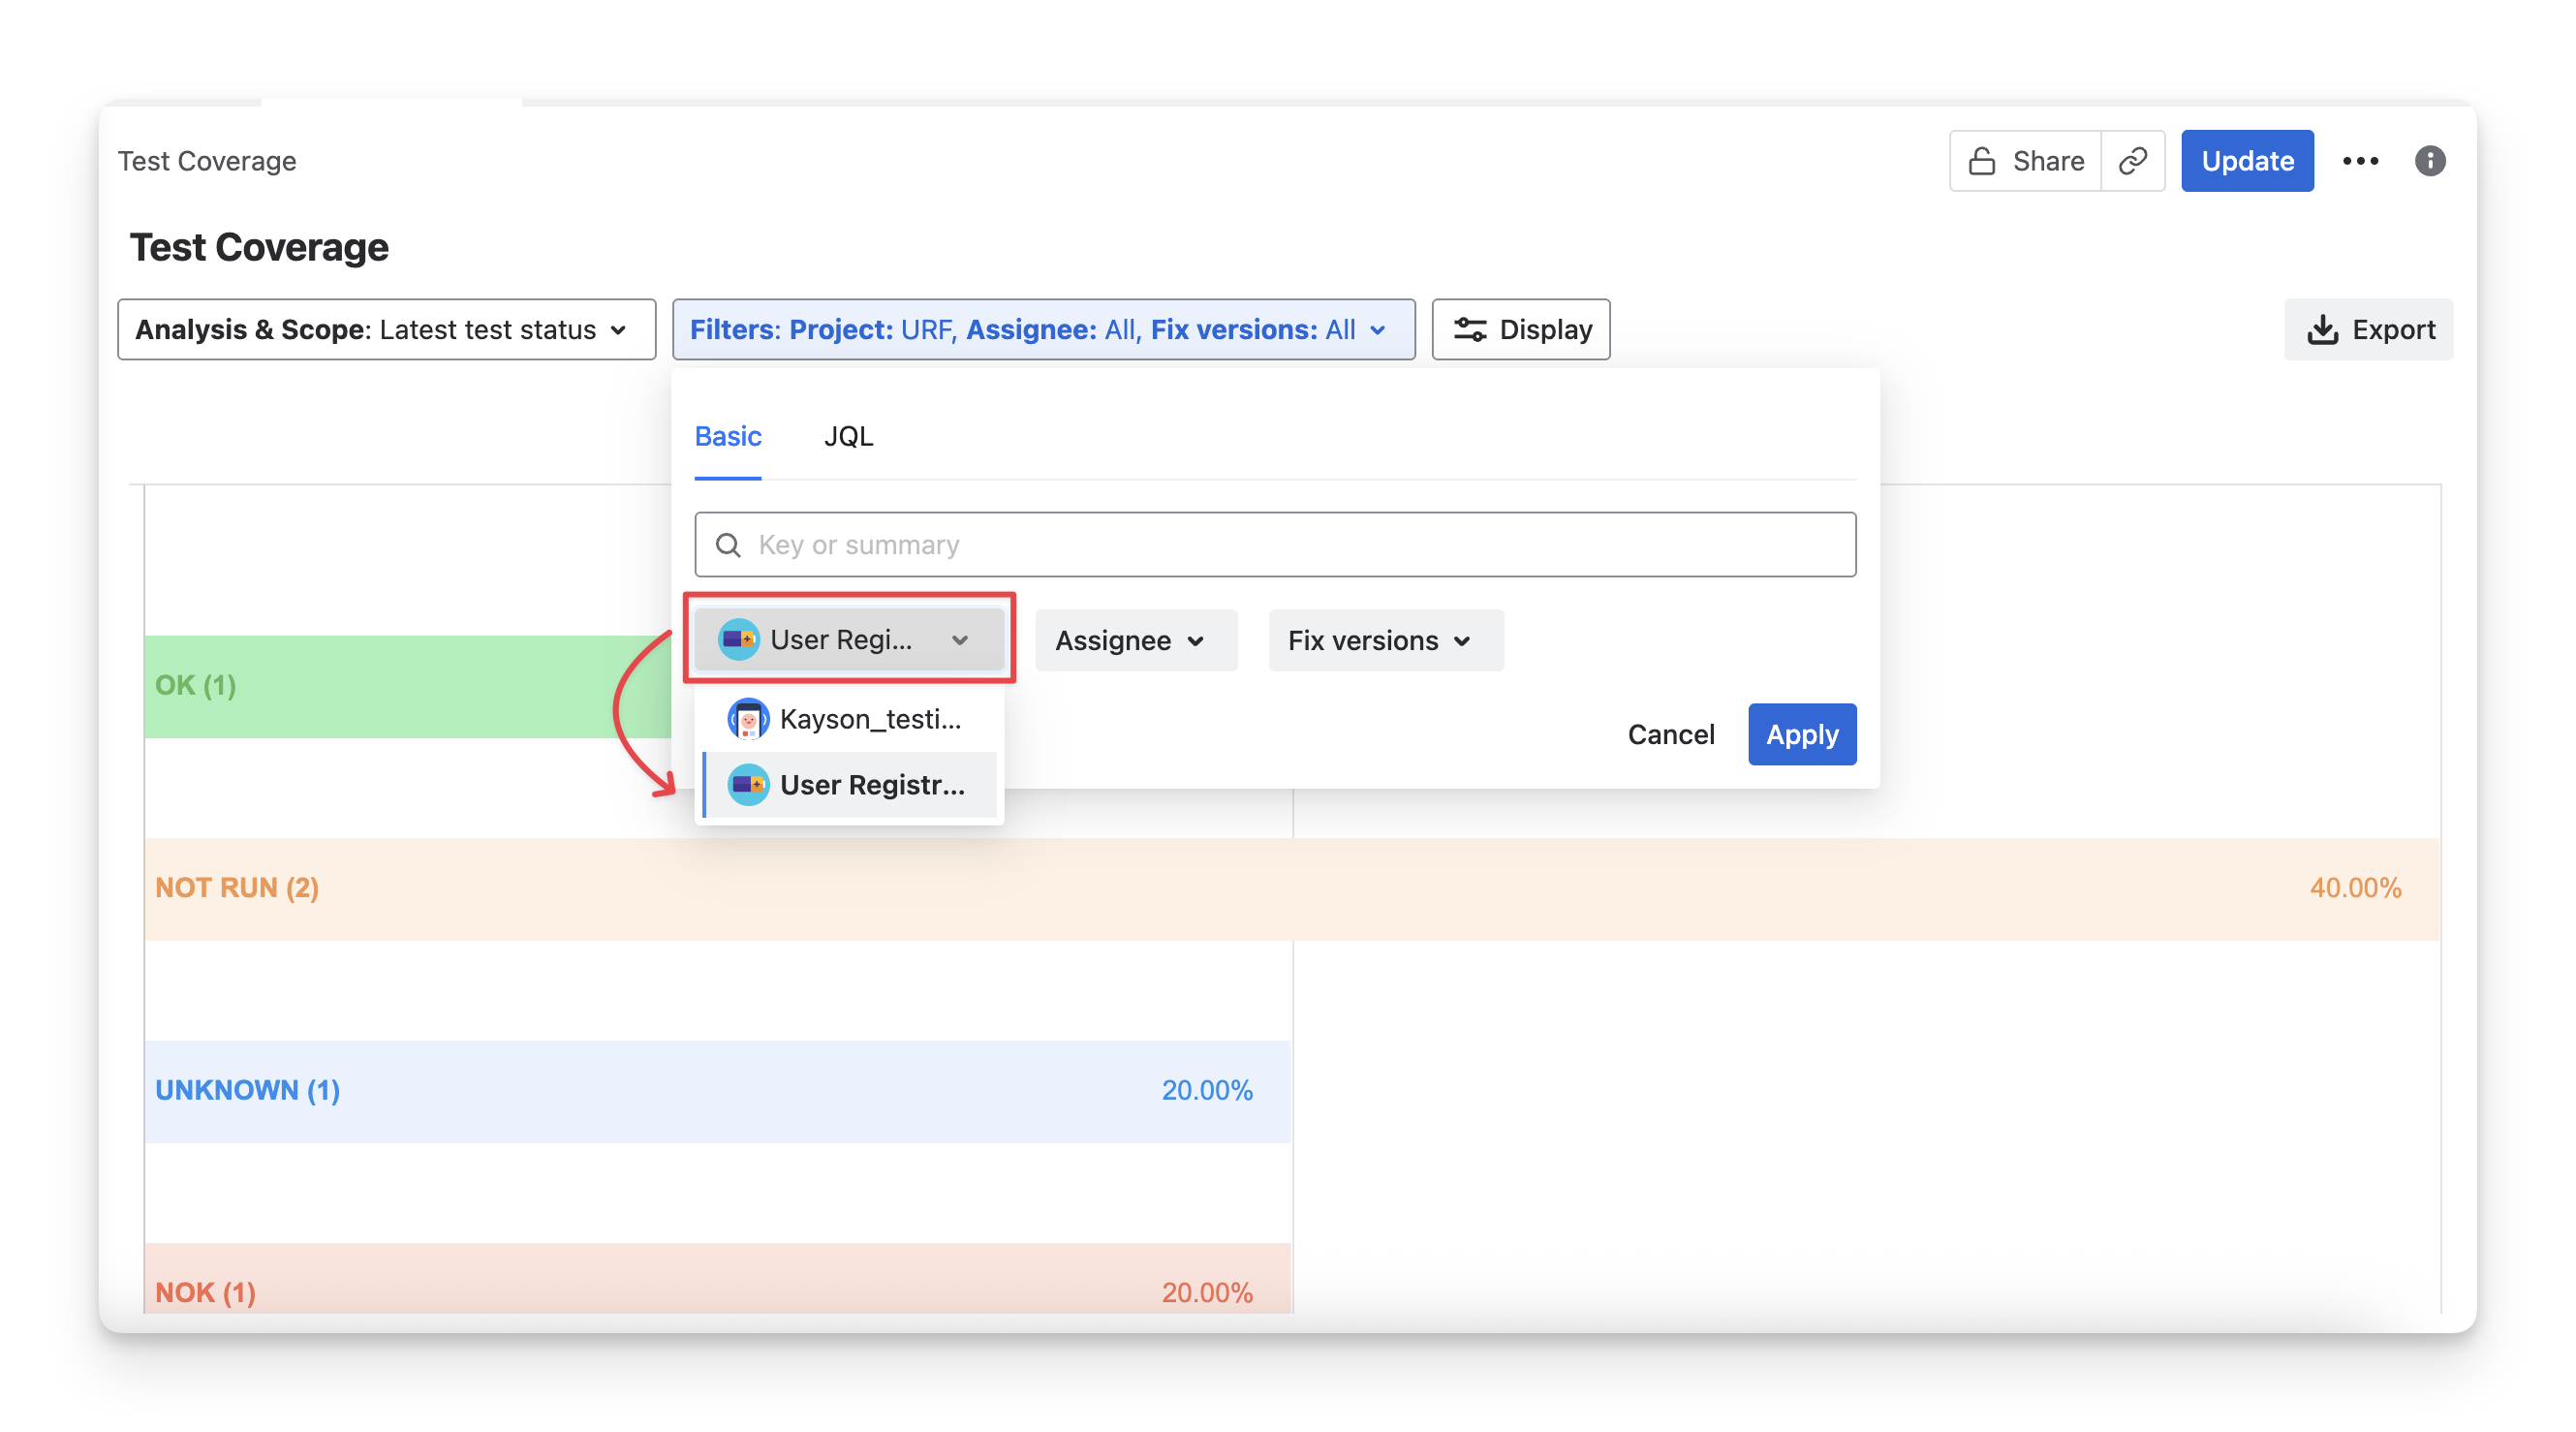
Project: Select the project whose requirements will be included in the calculation. AgileTest lets you map up to three projects per instance, allowing you to switch among them to calculate requirements.
-
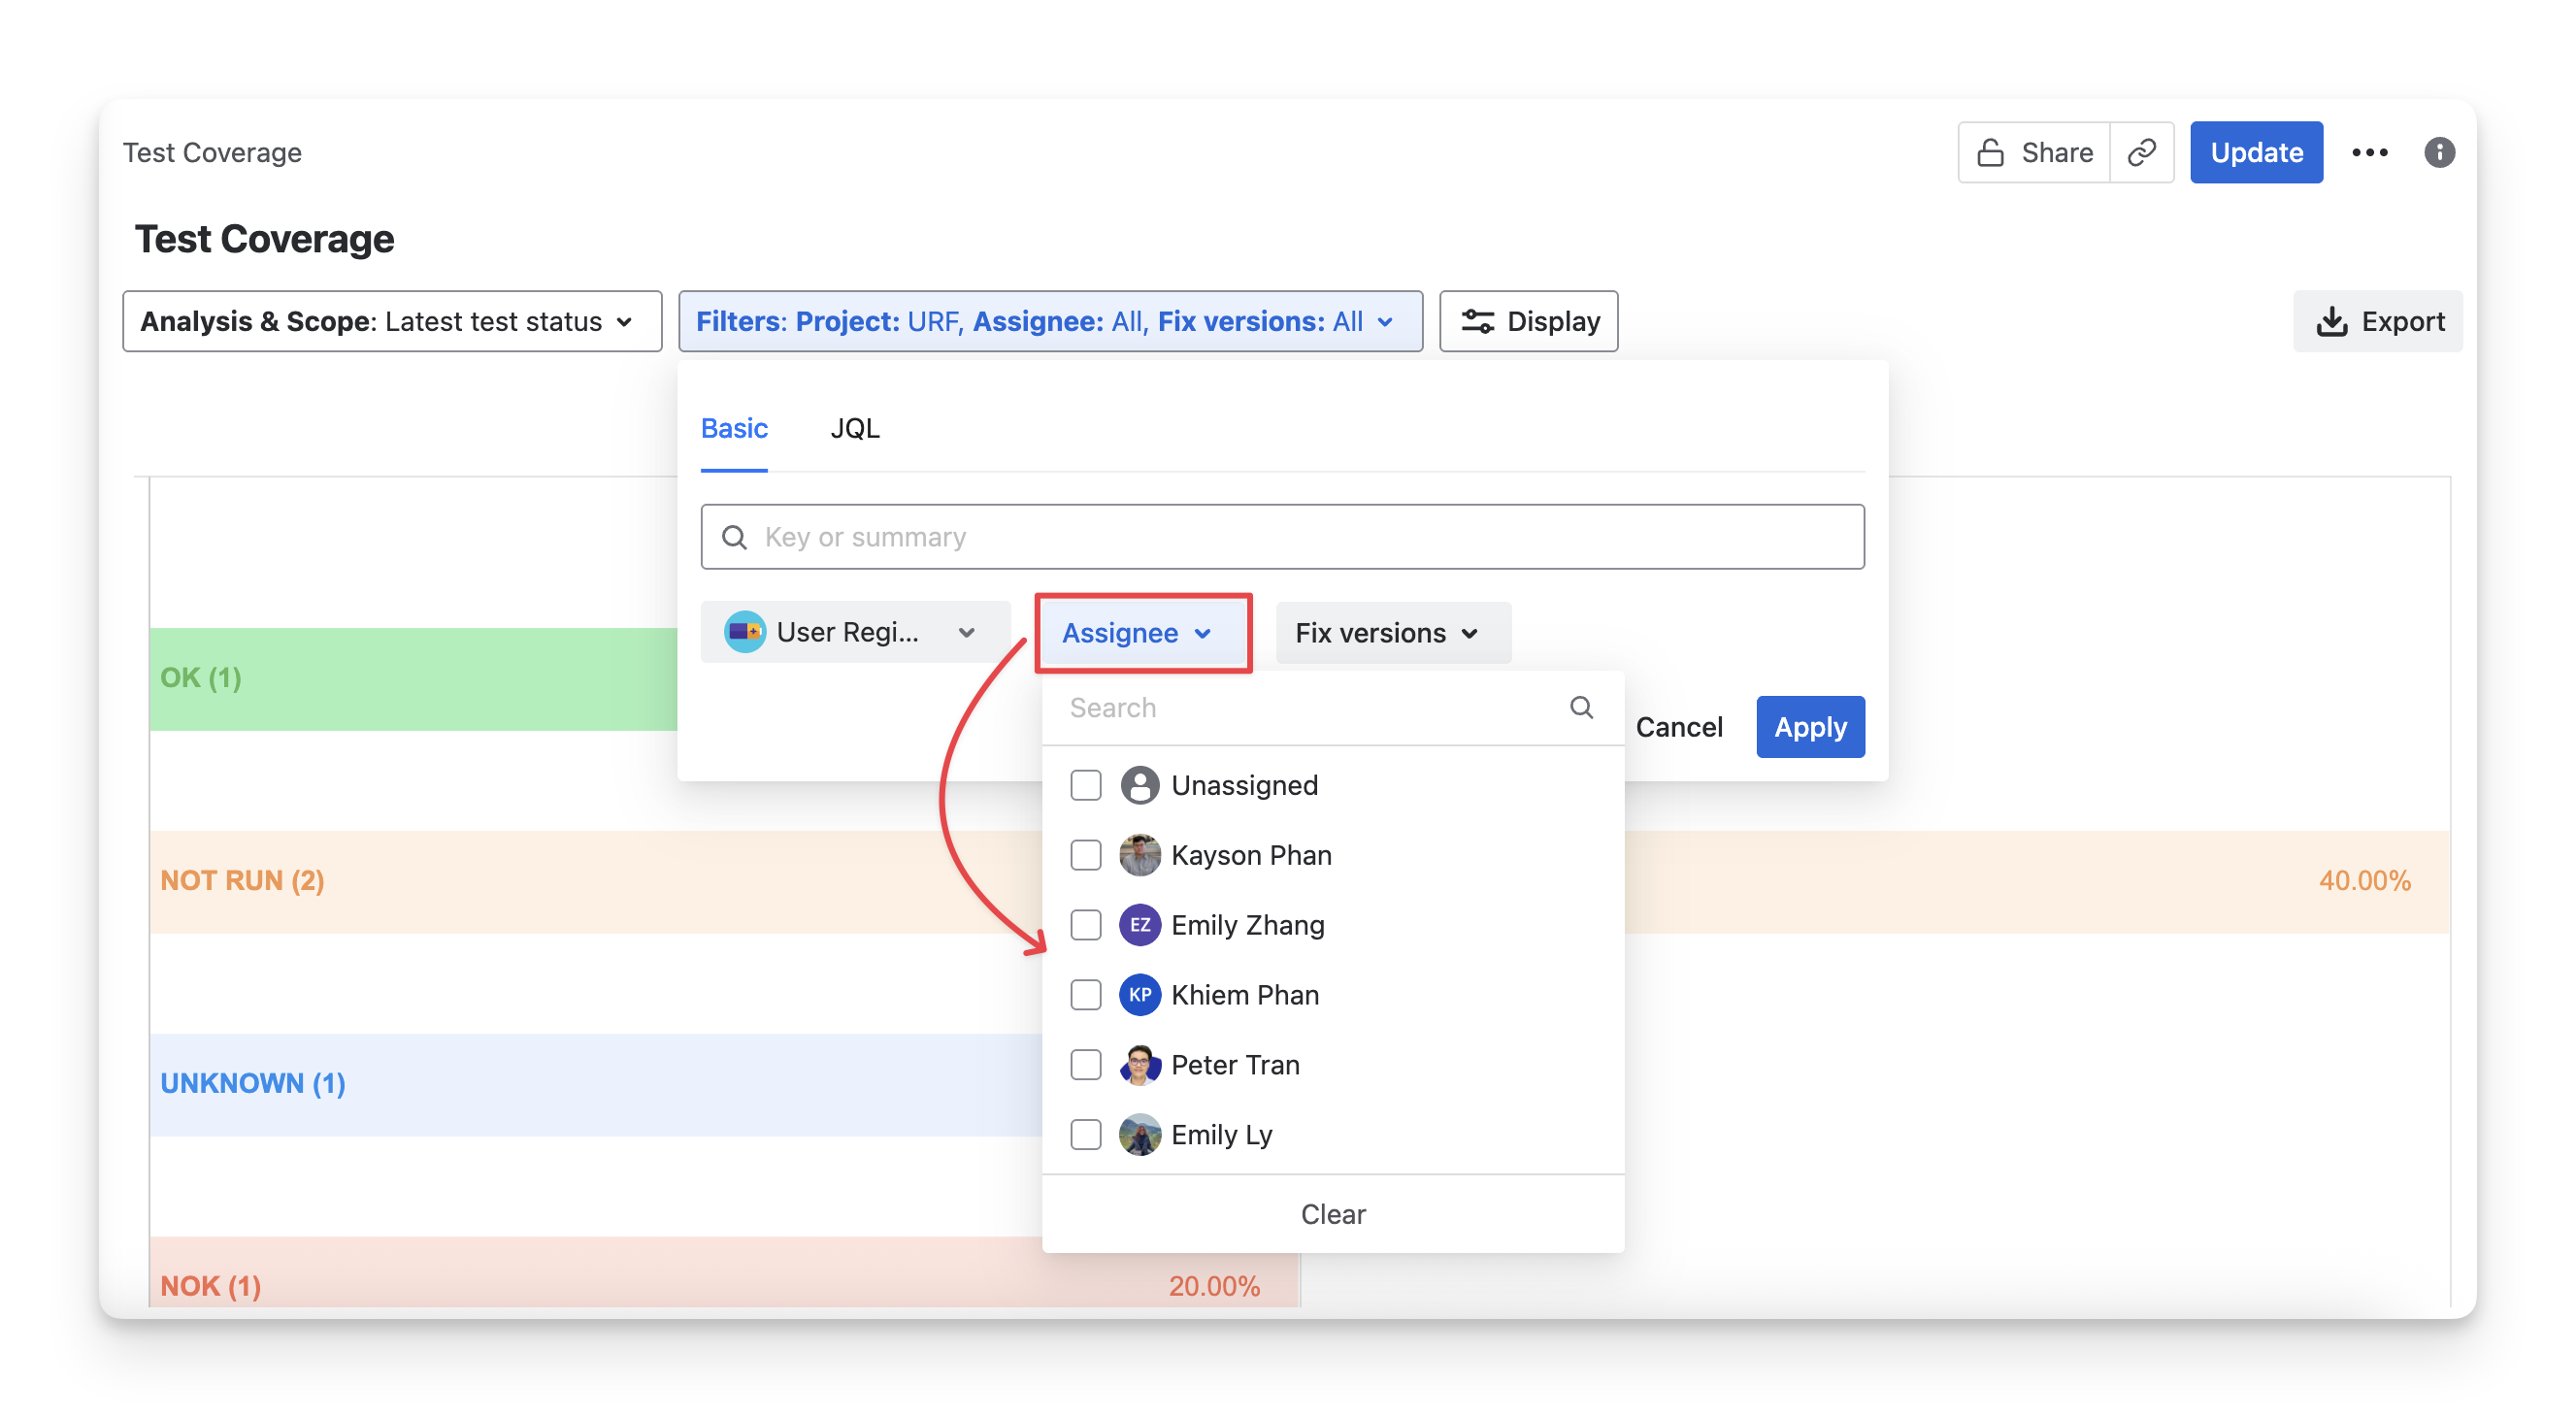
Assignee: Filter requirements based on the assignee.
-
Fix versions: Filter requirements with those associated with specific Jira fix versions.
-
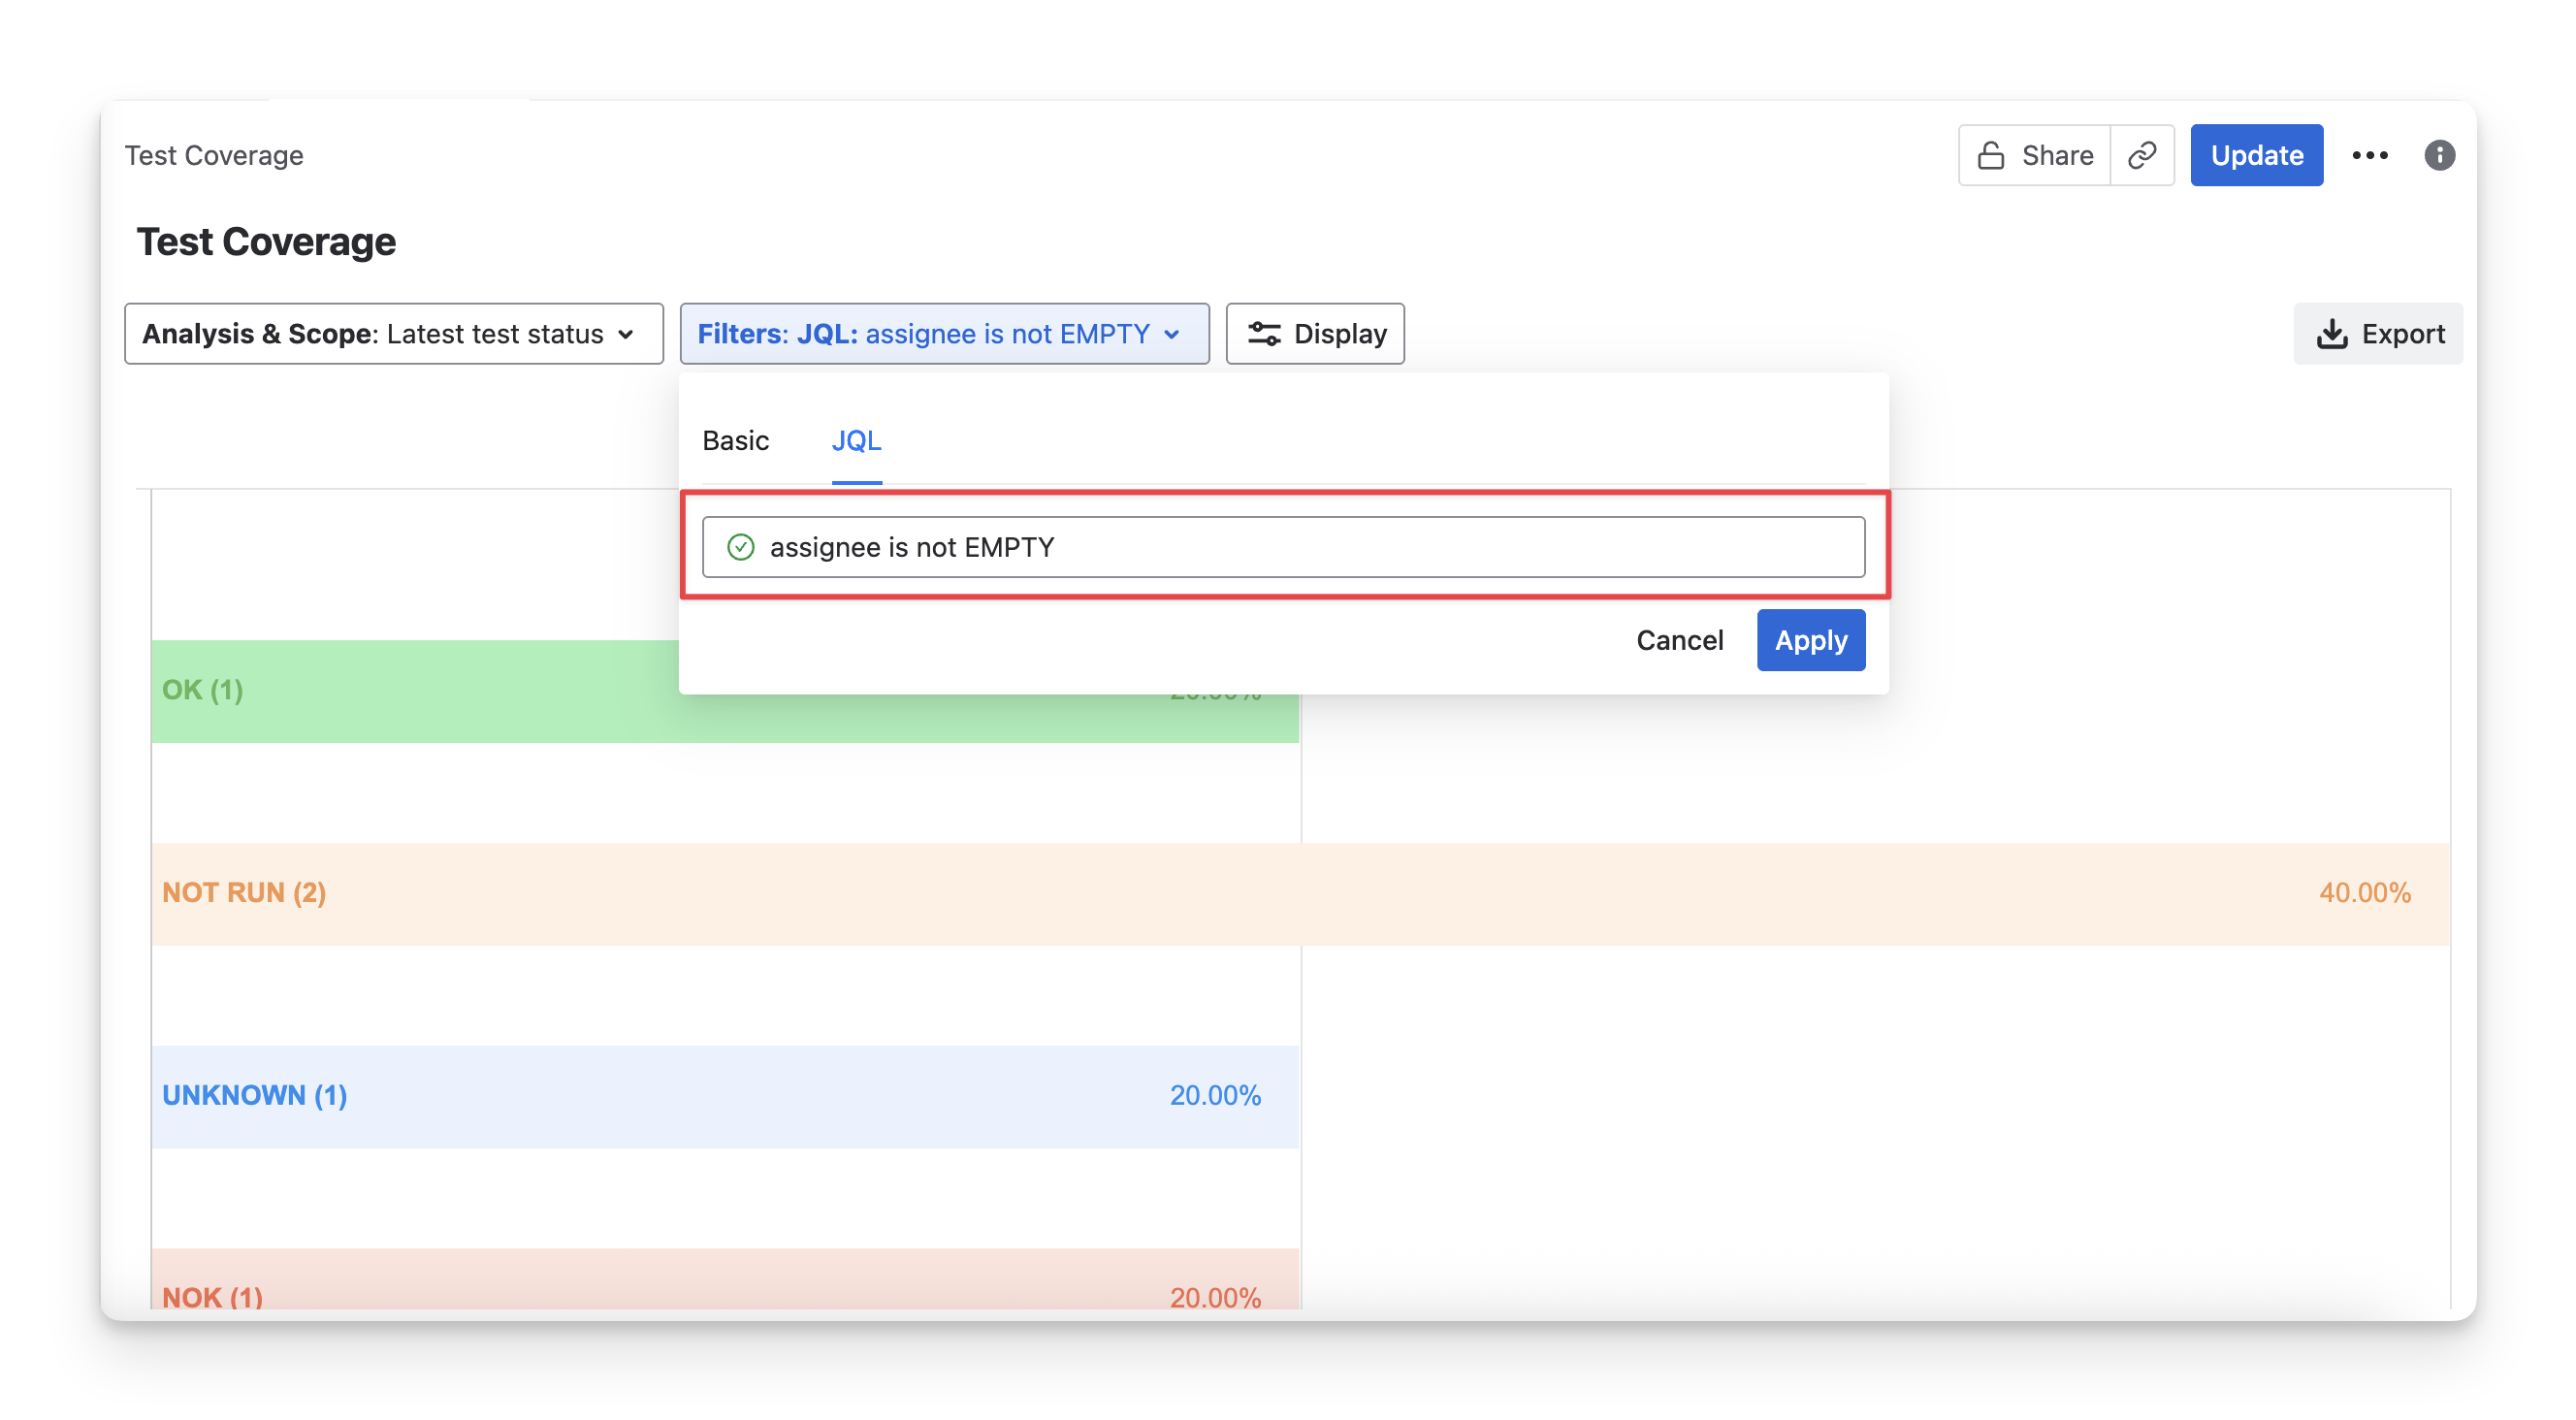
Or switch to JQL and enter your custom search.
2. Test Coverage Table
The Test Coverage Table provides a detailed, requirement-level view of test coverage and execution status. Each row represents a requirement and shows how it is validated by its linked test cases.

In the Test Coverage table, you can see a list of requirements with key data:
|
Information |
Description |
|
Key |
The Jira unique identifier for each requirement. This helps you quickly locate, reference, and track a specific issue. |
|
Summary |
A brief title describing the purpose or scenario of the requirement. |
|
Requirement Status |
The calculated status of the requirement based on its link with Test Cases ( NOK ; not run ; Unknown ; ok ; Uncovered ) |
|
Test Cases |
The test cases are linked to the requirement. |
|
Project |
The project that the requirement belongs to. |
|
Priority |
The requirement's importance helps you prioritise what needs attention first. |
|
Assignee |
The member who is responsible for working on the requirement. |
|
Reporter |
The member who created the requirement. |
|
Created at |
The date and time when the requirement was first created in the system. |
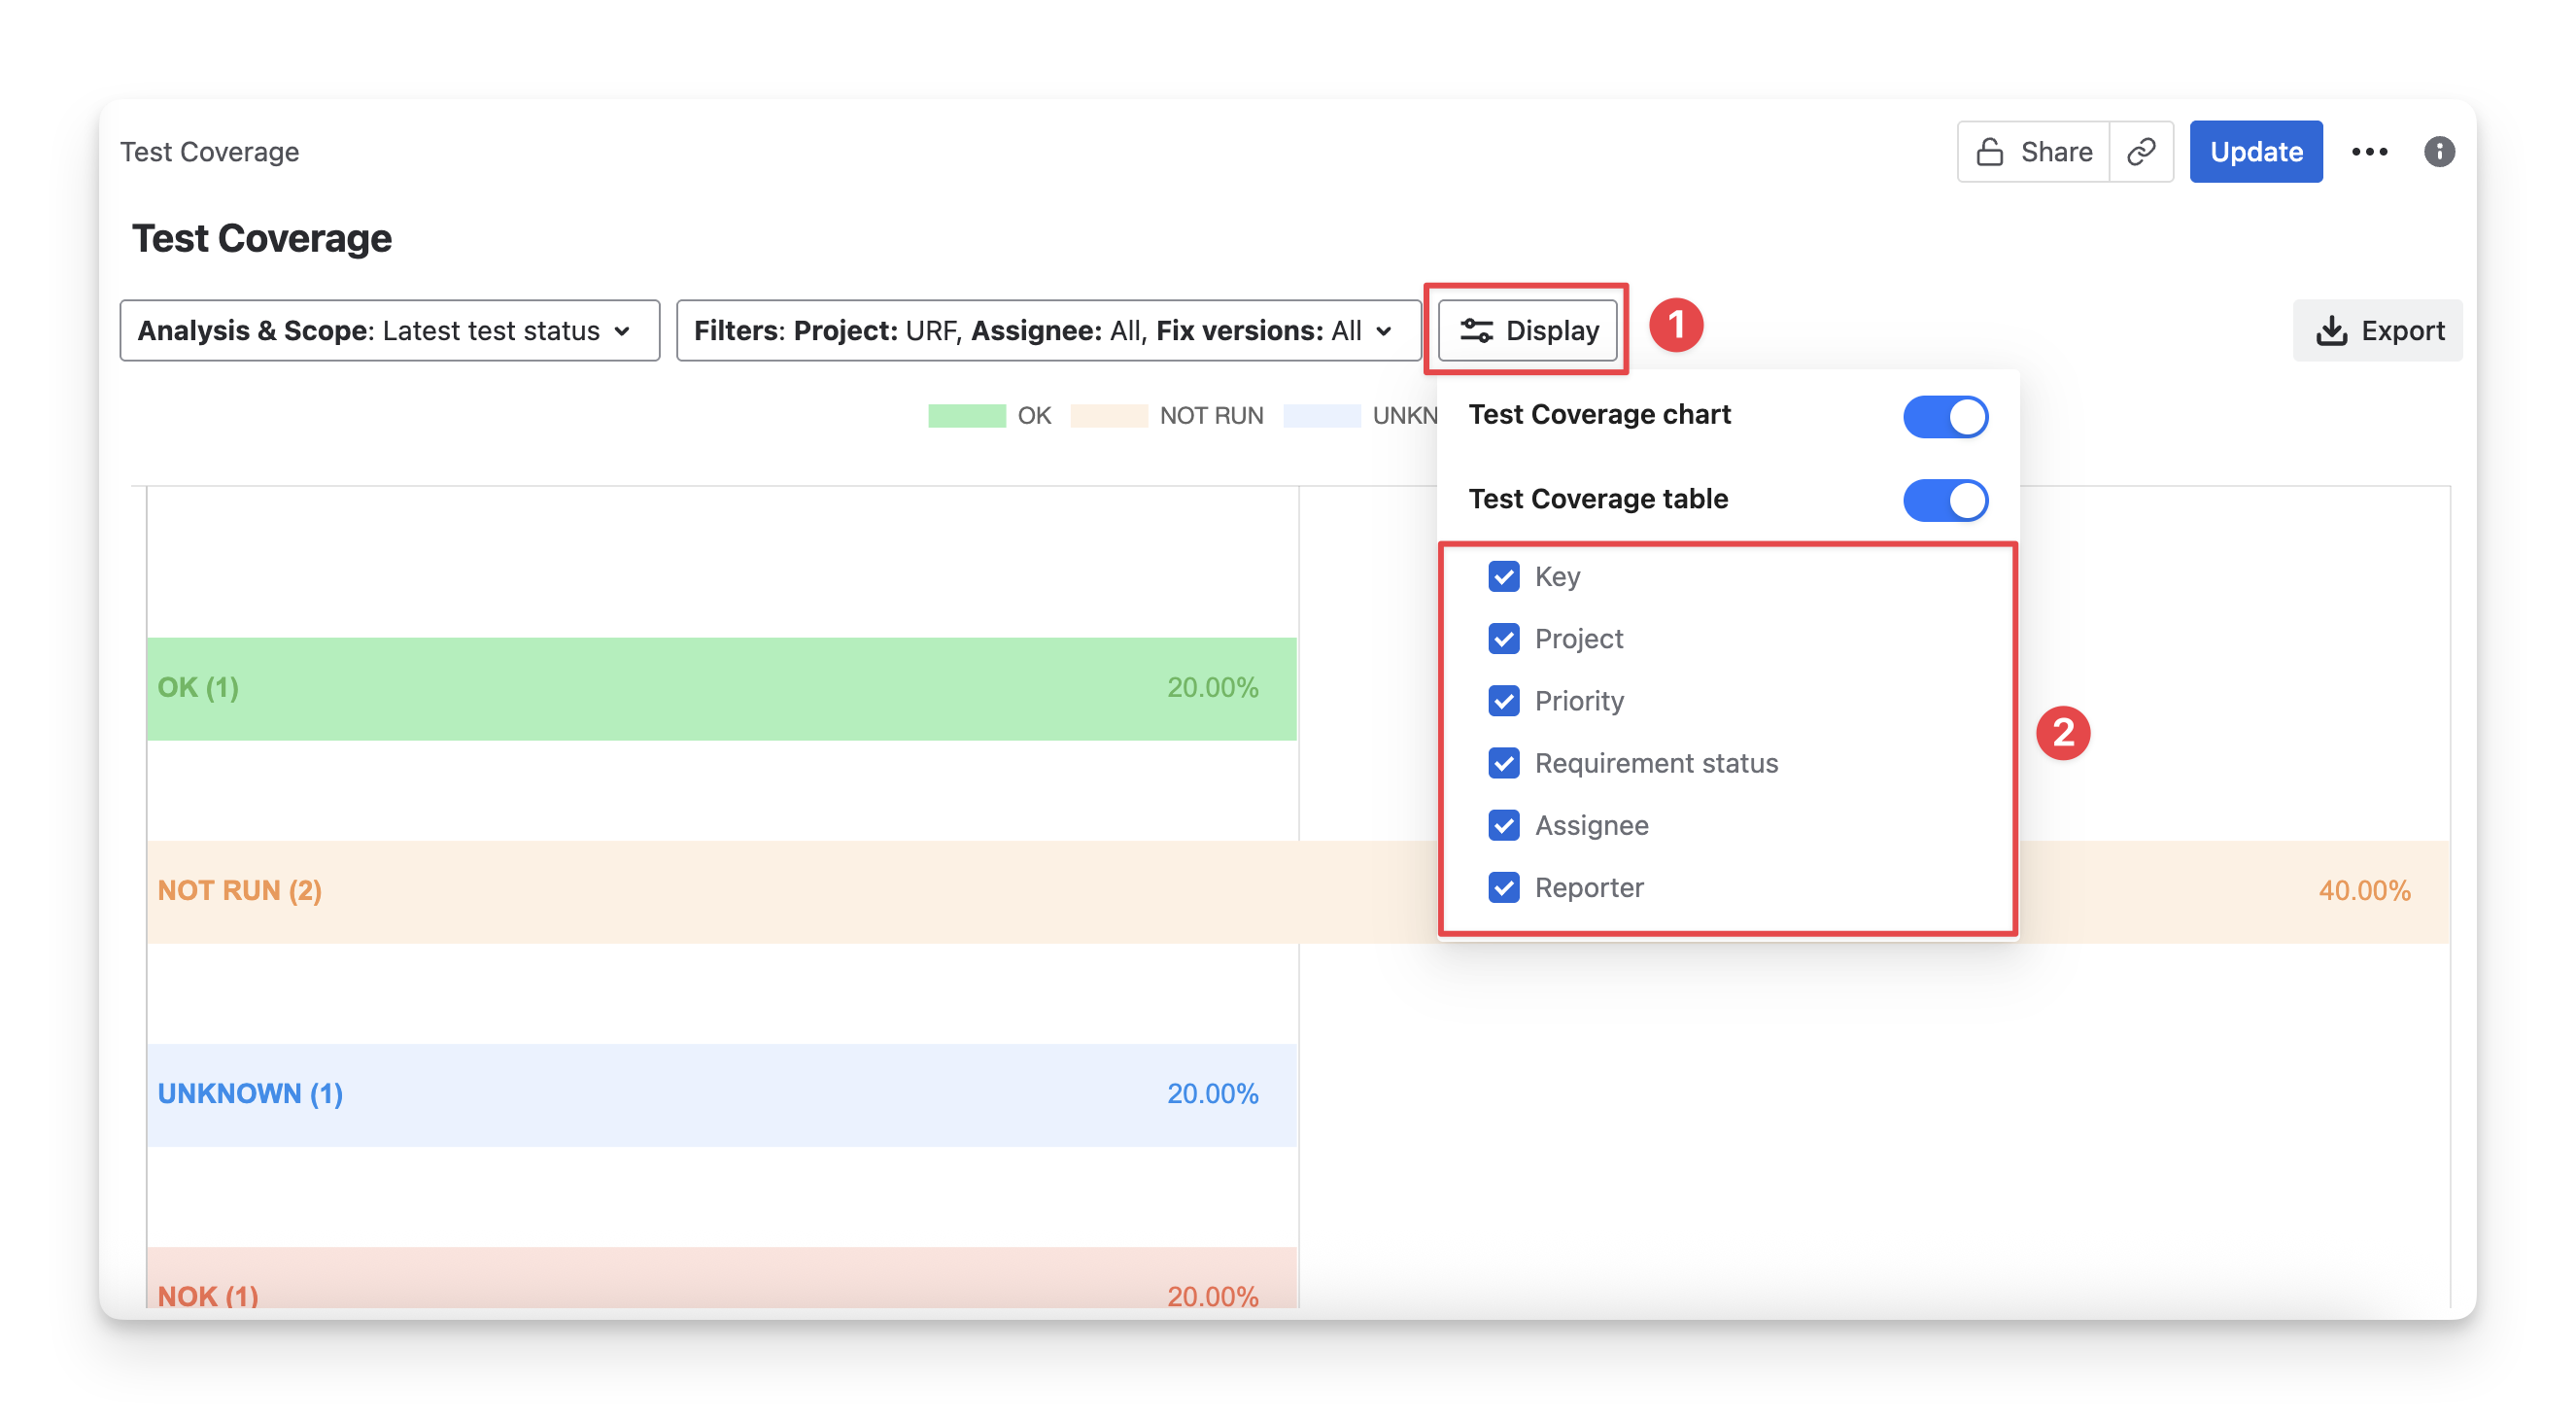
2.1 Display Test Coverage Table Information
You can Show/Hide the column in the report table by
-
Click on the Display button.
-
Select/deselect on any options to show/hide these columns in the Test Coverage Table.
2.2 Rearrange Test Coverage Table Orders
To change the display order of columns, drag and drop each column to your preferred position.
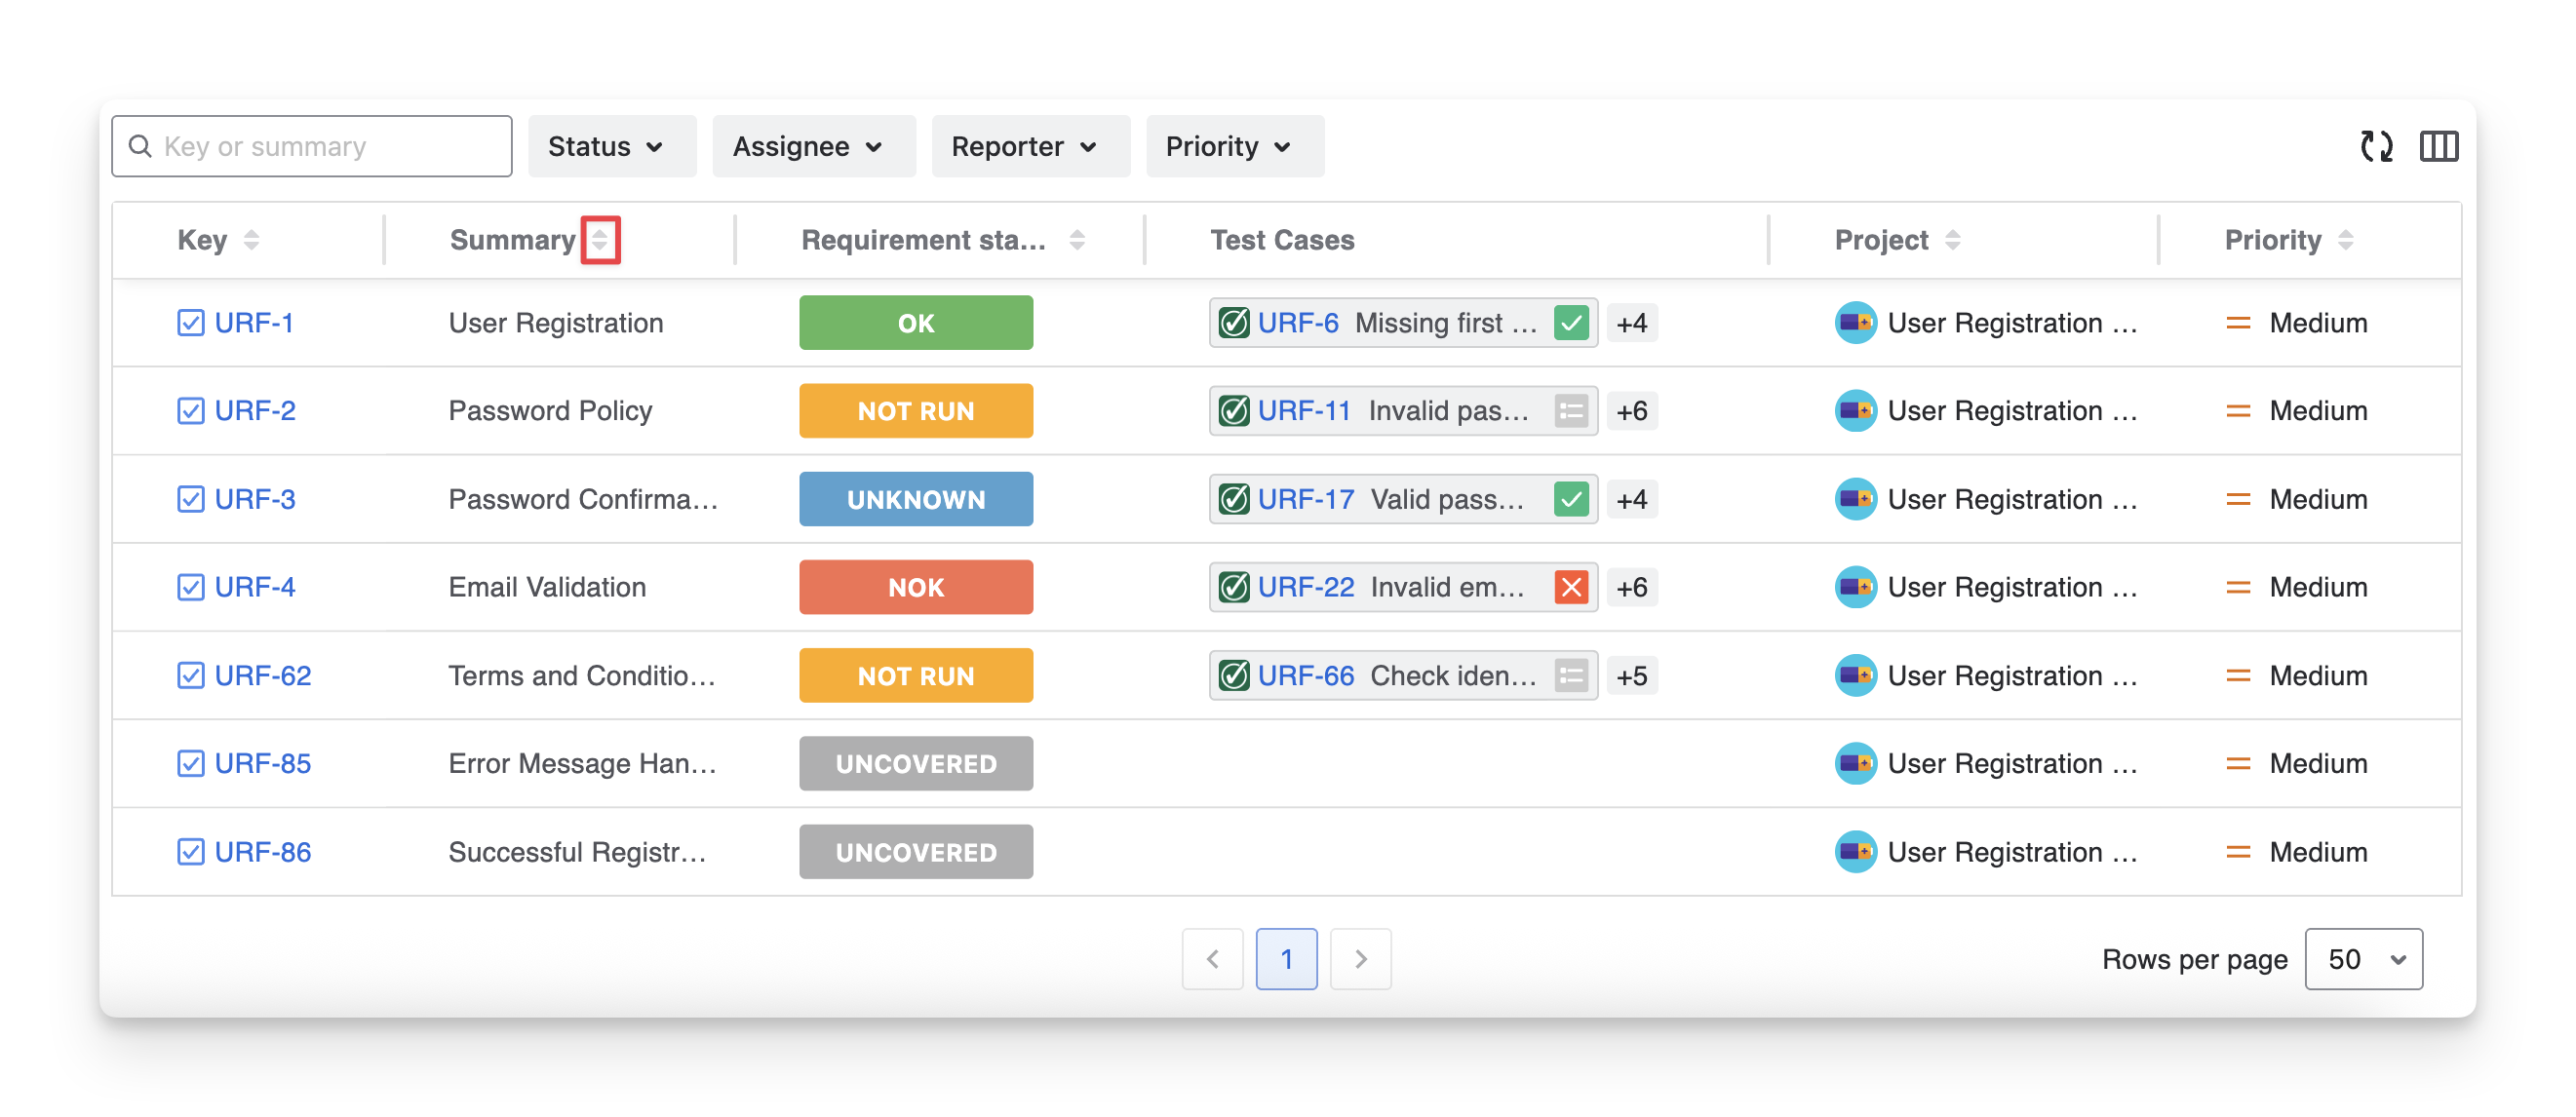
2.3 Sort Test Coverage Table
To sort any column and view the data in ascending or descending order, you can:
-
Choose the 🔼 to sort ascending.
-
Choose the 🔽 to sort descending.
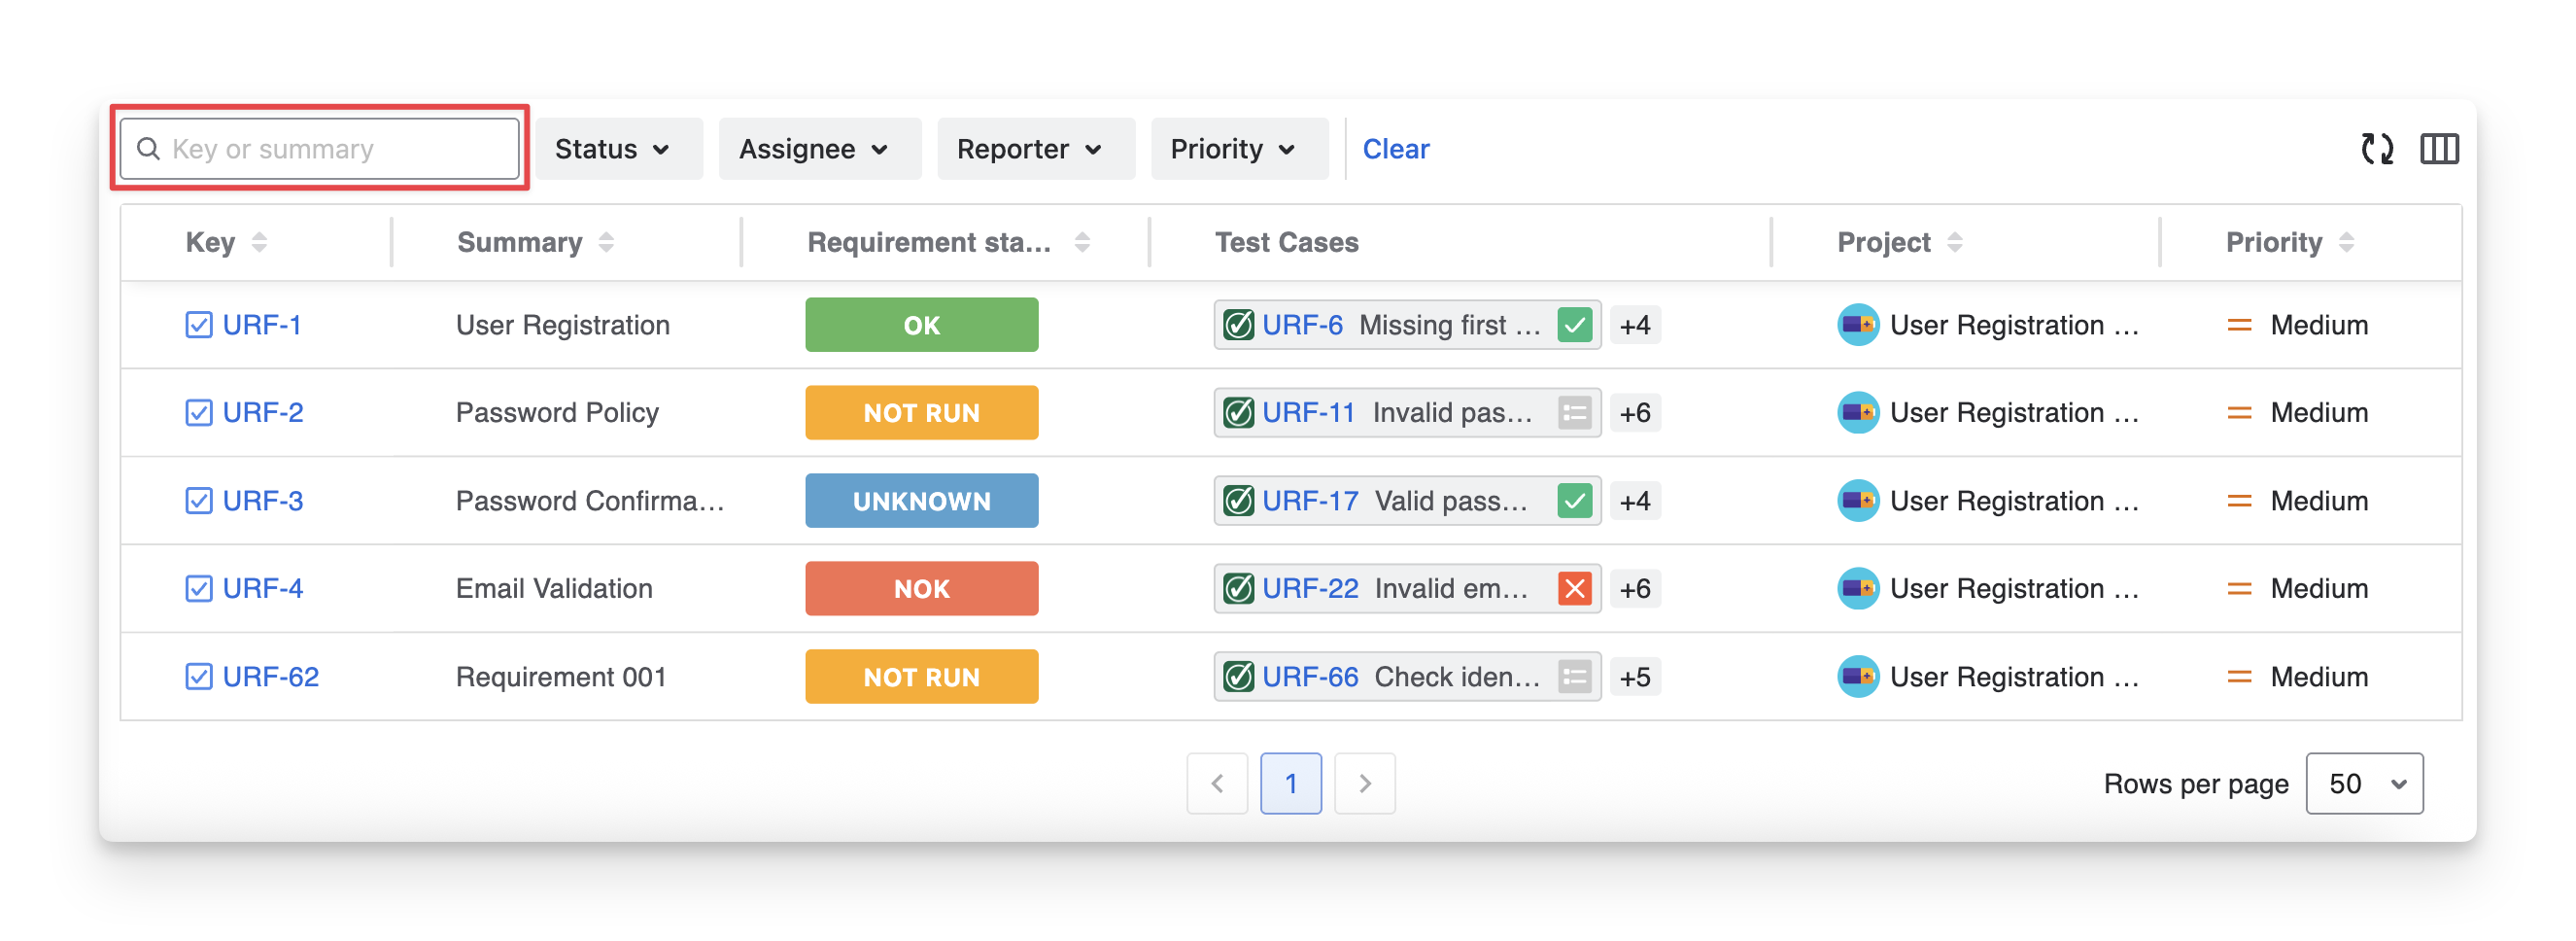
2.4 Filter Test Coverage Table
To quickly identify a specific requirement in the list, you can:
-
Provide the Requirement Key or Summary to find the exact requirement.
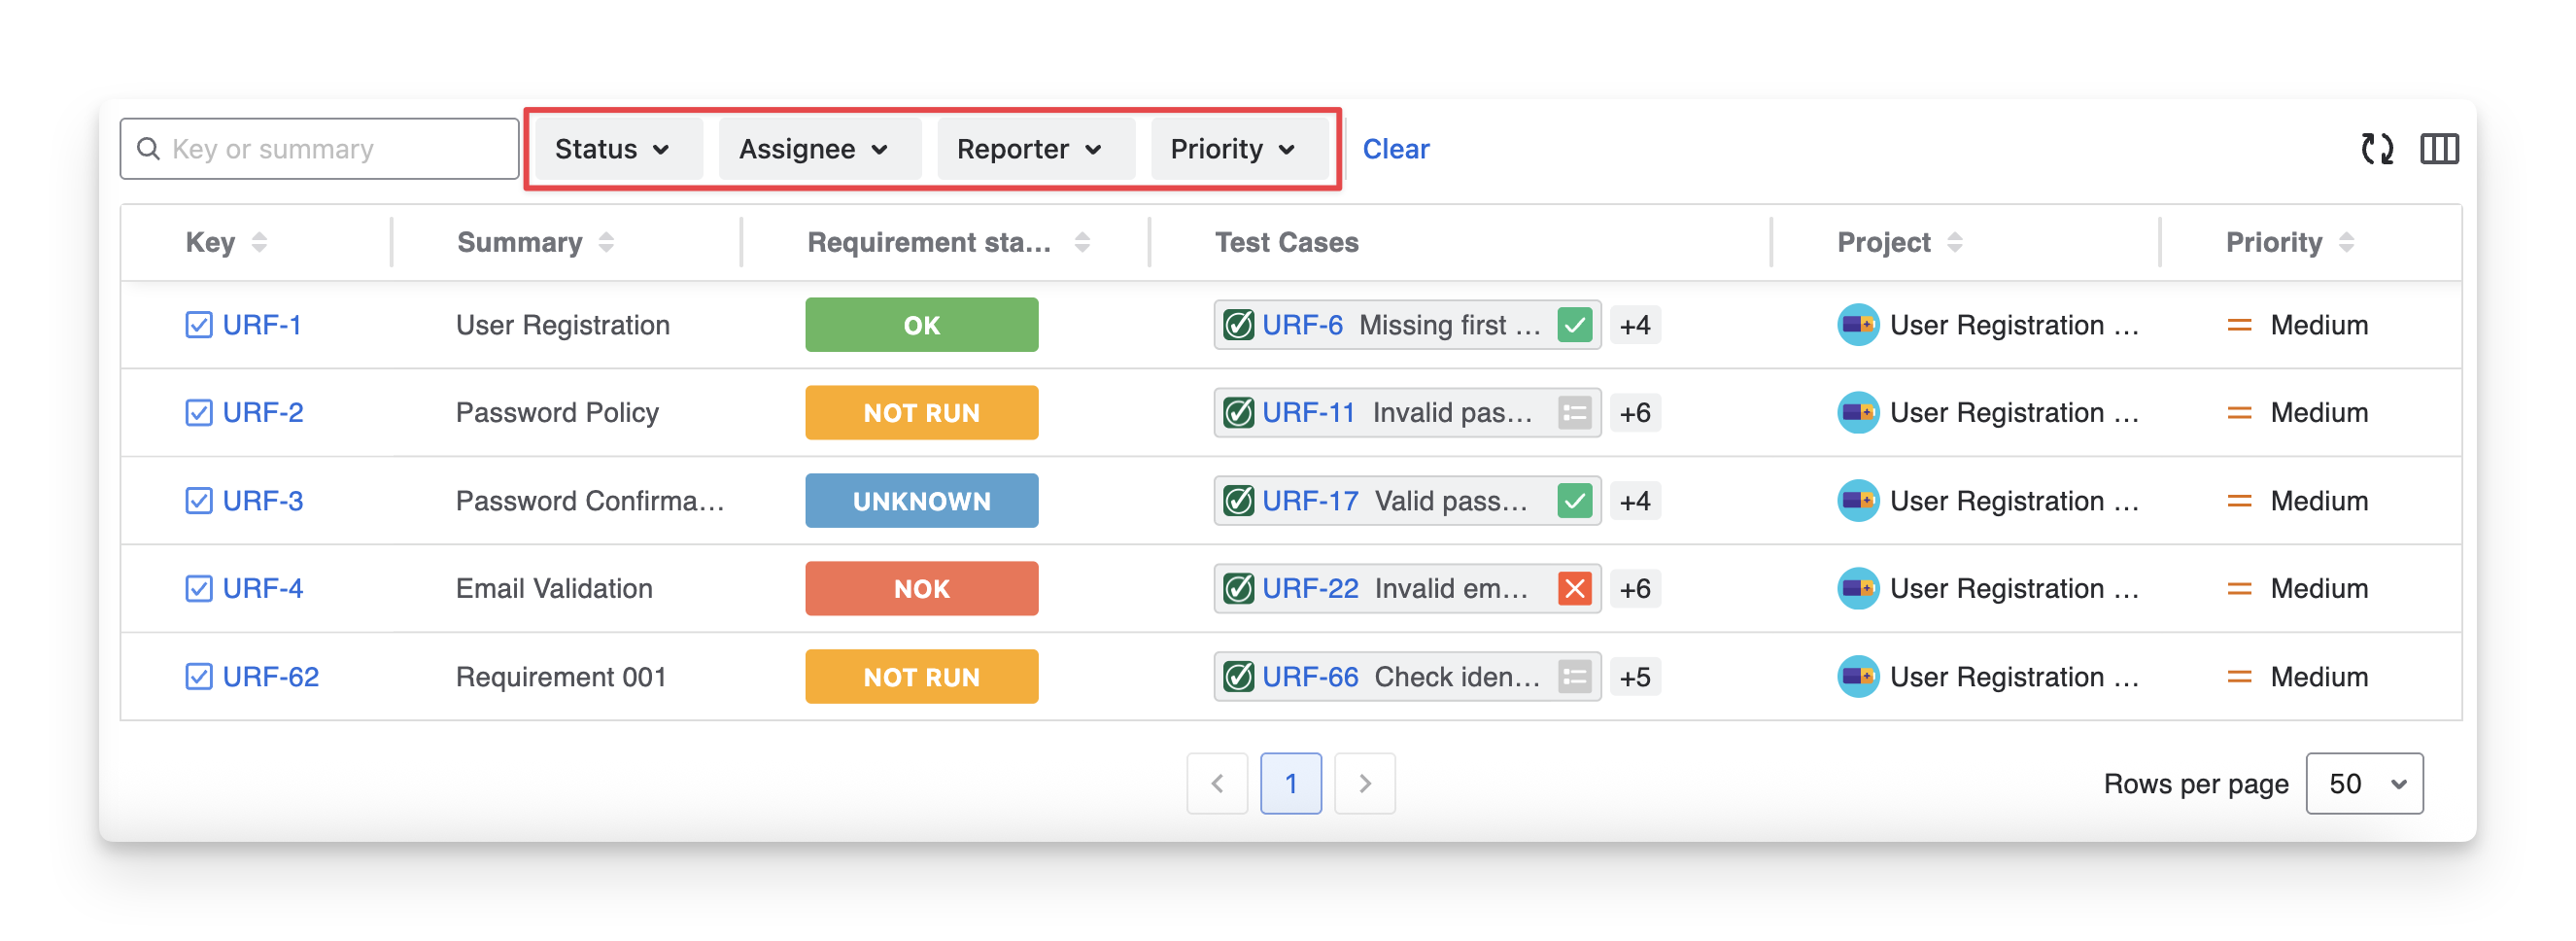
-
Apply Filters to narrow down the list. You can filter reports by:
-
Status: Filter requirements based on their calculated coverage status ( NOK ; not run ; Unknown ; ok ; Uncovered )
-
Assignee: Filter requirements by assignee members
-
Reporter: Filter requirements by the one who created
-
Priority: Filter requirements with selected priority levels
-
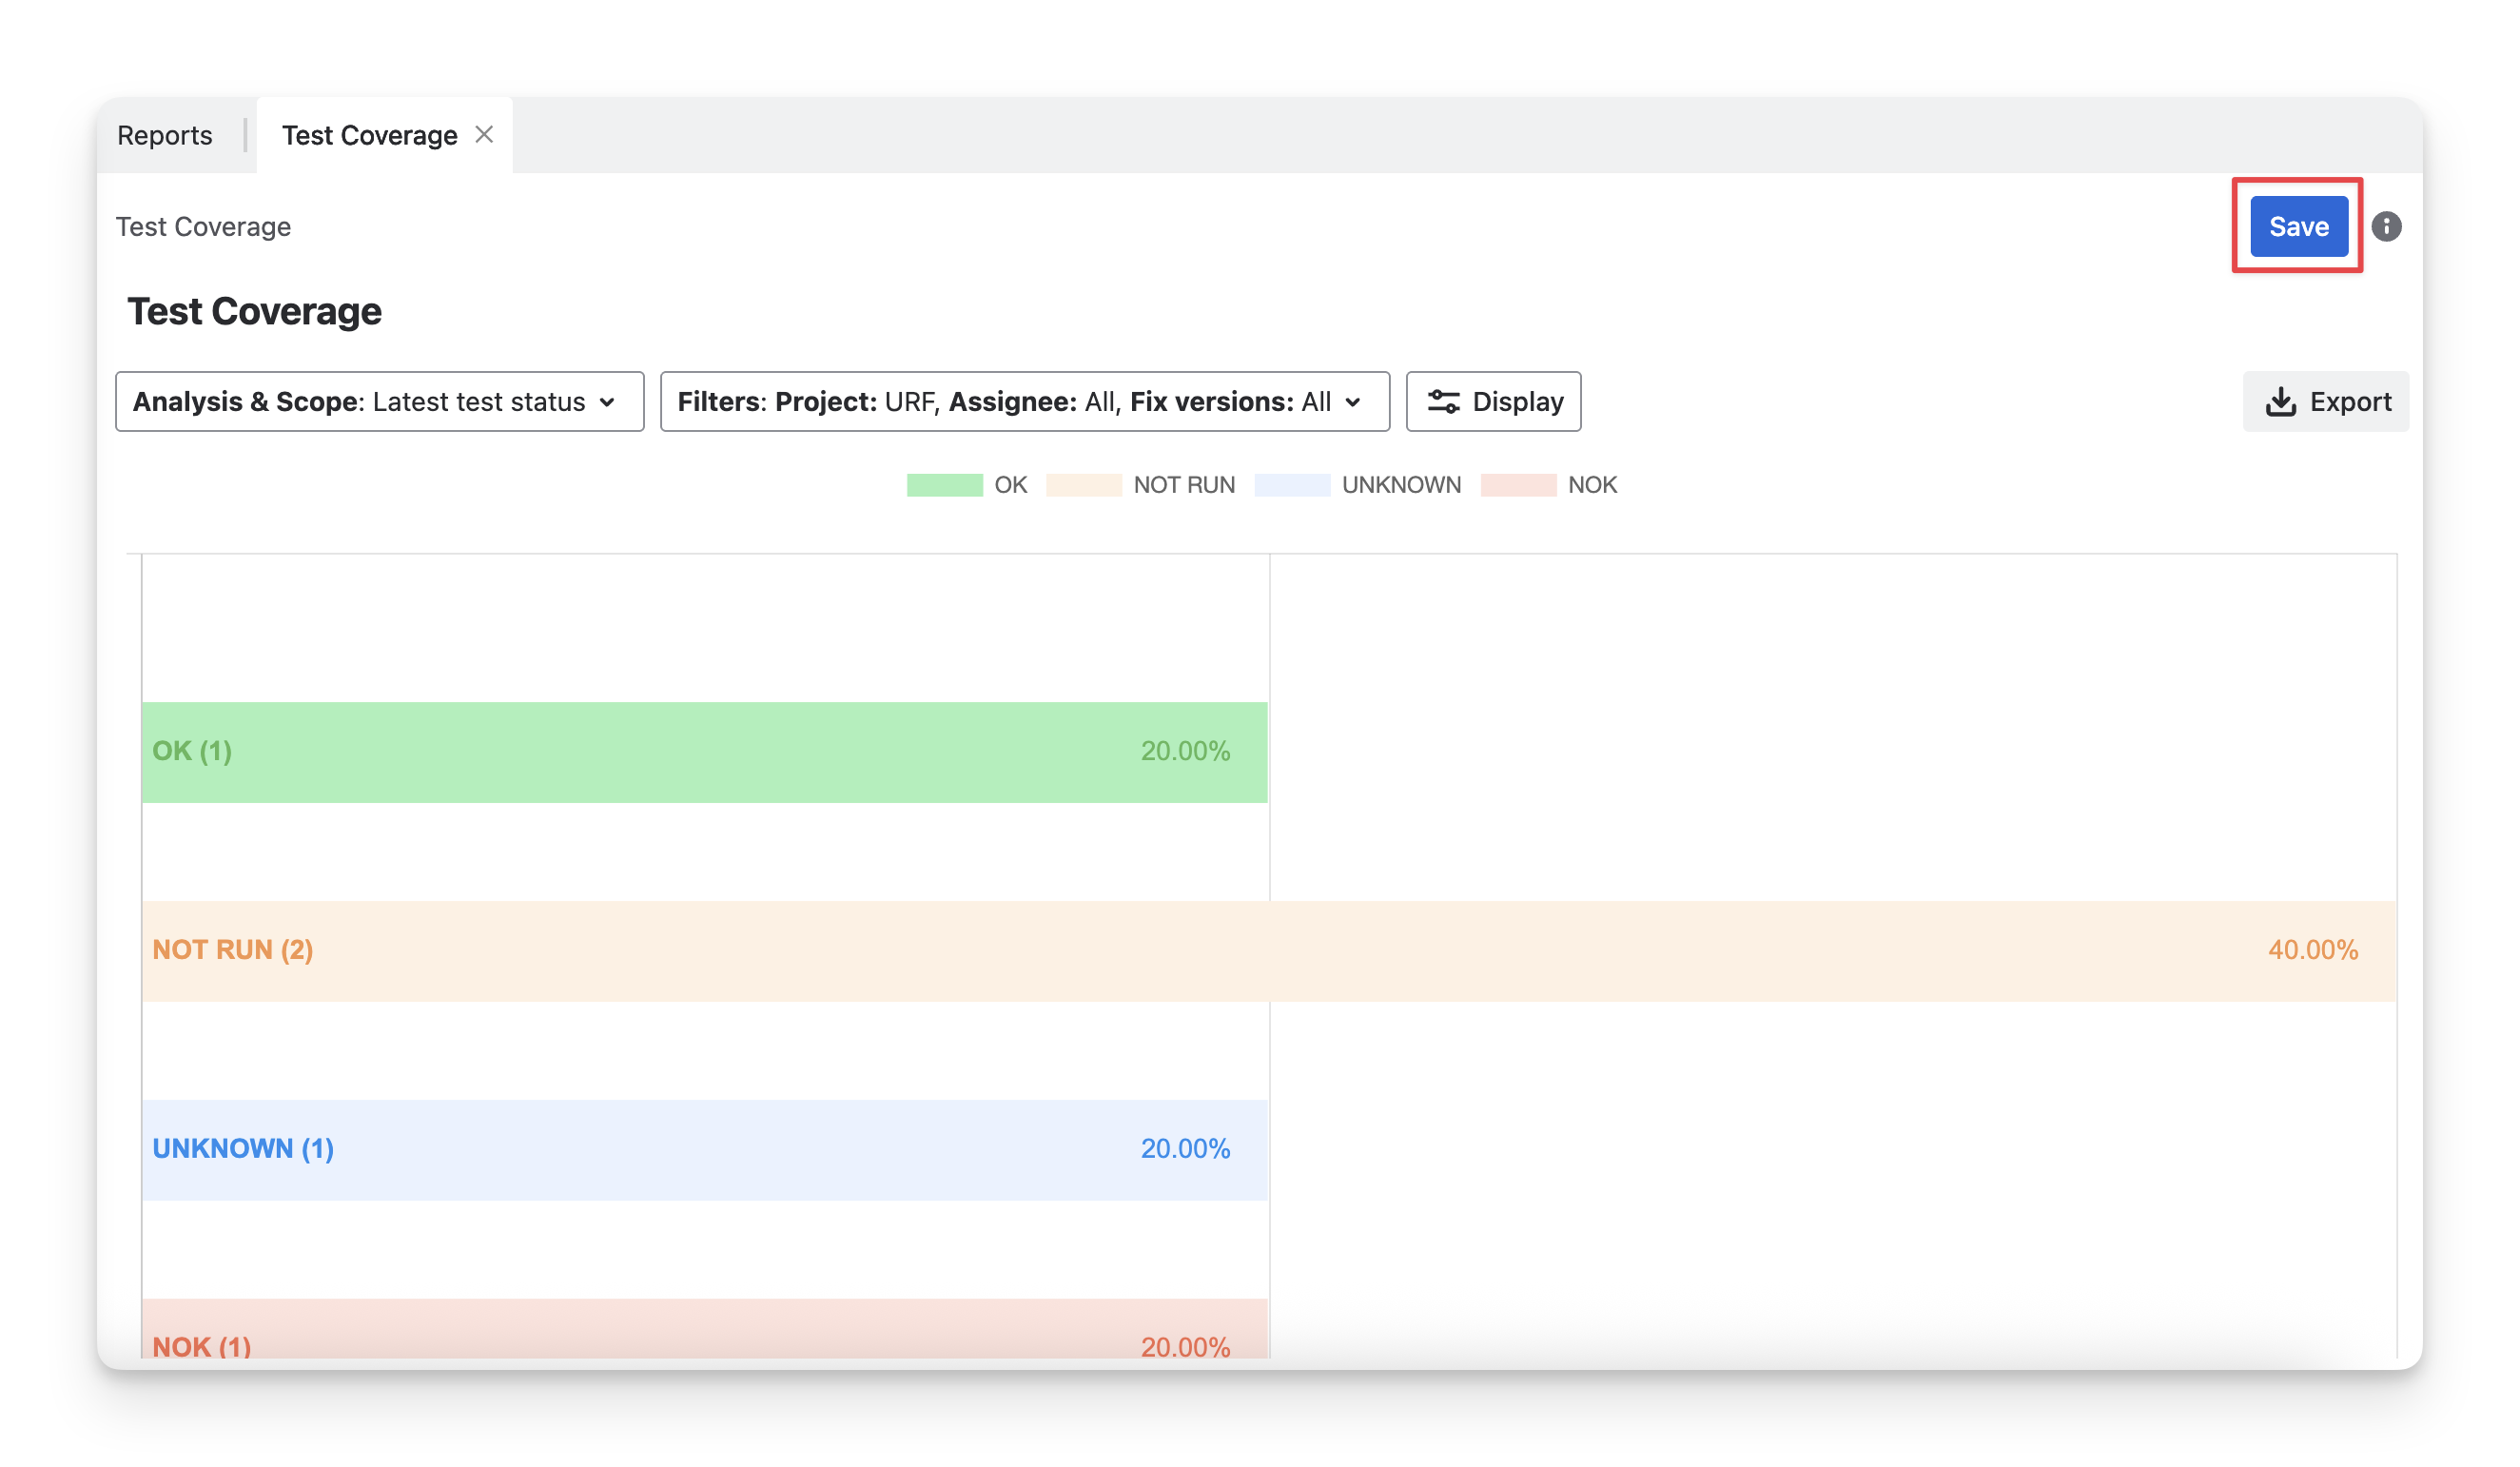
3. Save, Share & Export Report
After modifying the Test Coverage Report, click the Save button. When you reopen the report, your settings will restore automatically, so you won’t need to configure it again.
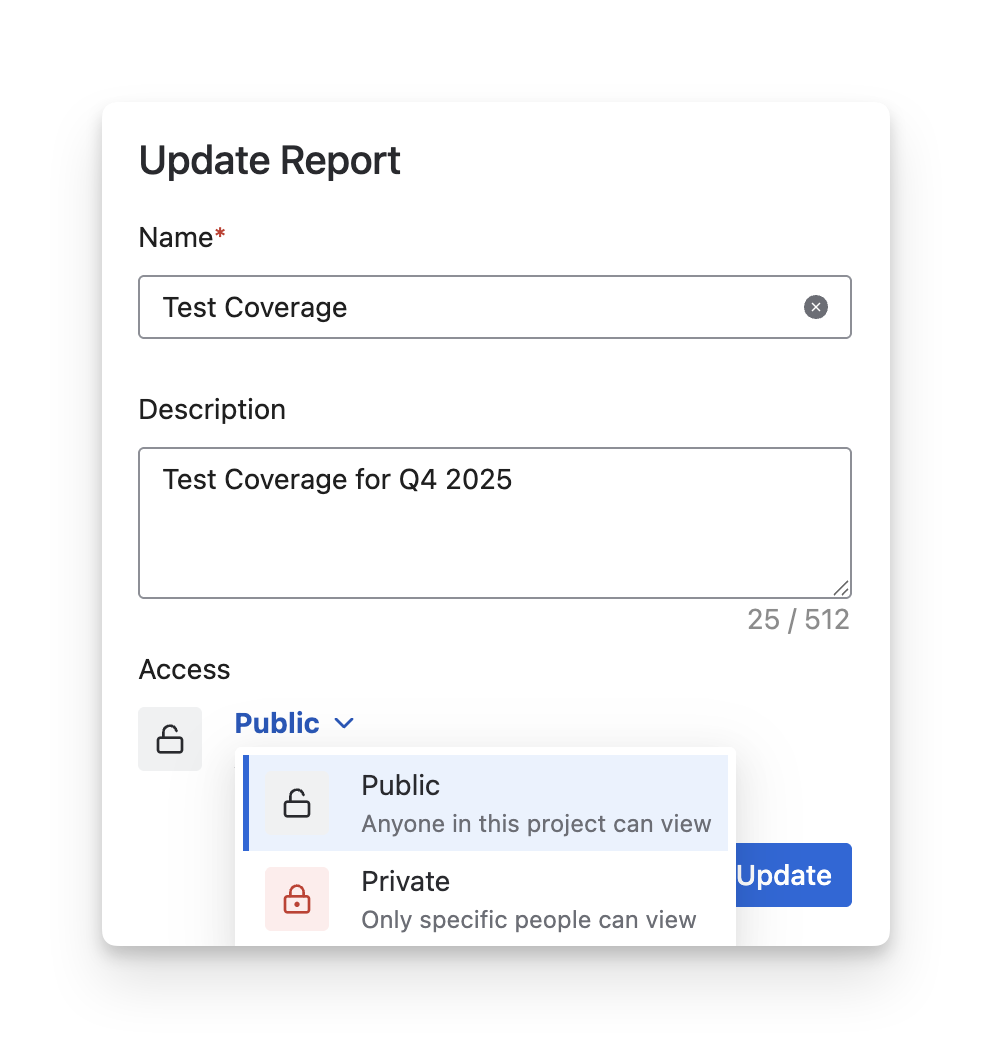
Set the report's accessibility:
-
Choose Private to restrict viewing to some members.
-
Choose Public to allow all members to view the result.
To download the Test Coverage report, click the Export button. AgileTest lets you export this report as PDF or Excel files, including all content from the pie charts and detailed table sections.
Should you need any assistance or further AgileTest inquiries, contact our 24/7 Support Desk.