.png)
GanttTable’s Excel-like tables empower you to browse, edit, and track Jira issues across multiple projects with ease. Leverage built-in Jira hierarchies or create custom structures to organize tasks and sprints, tailoring workflows to you or your team’s needs.
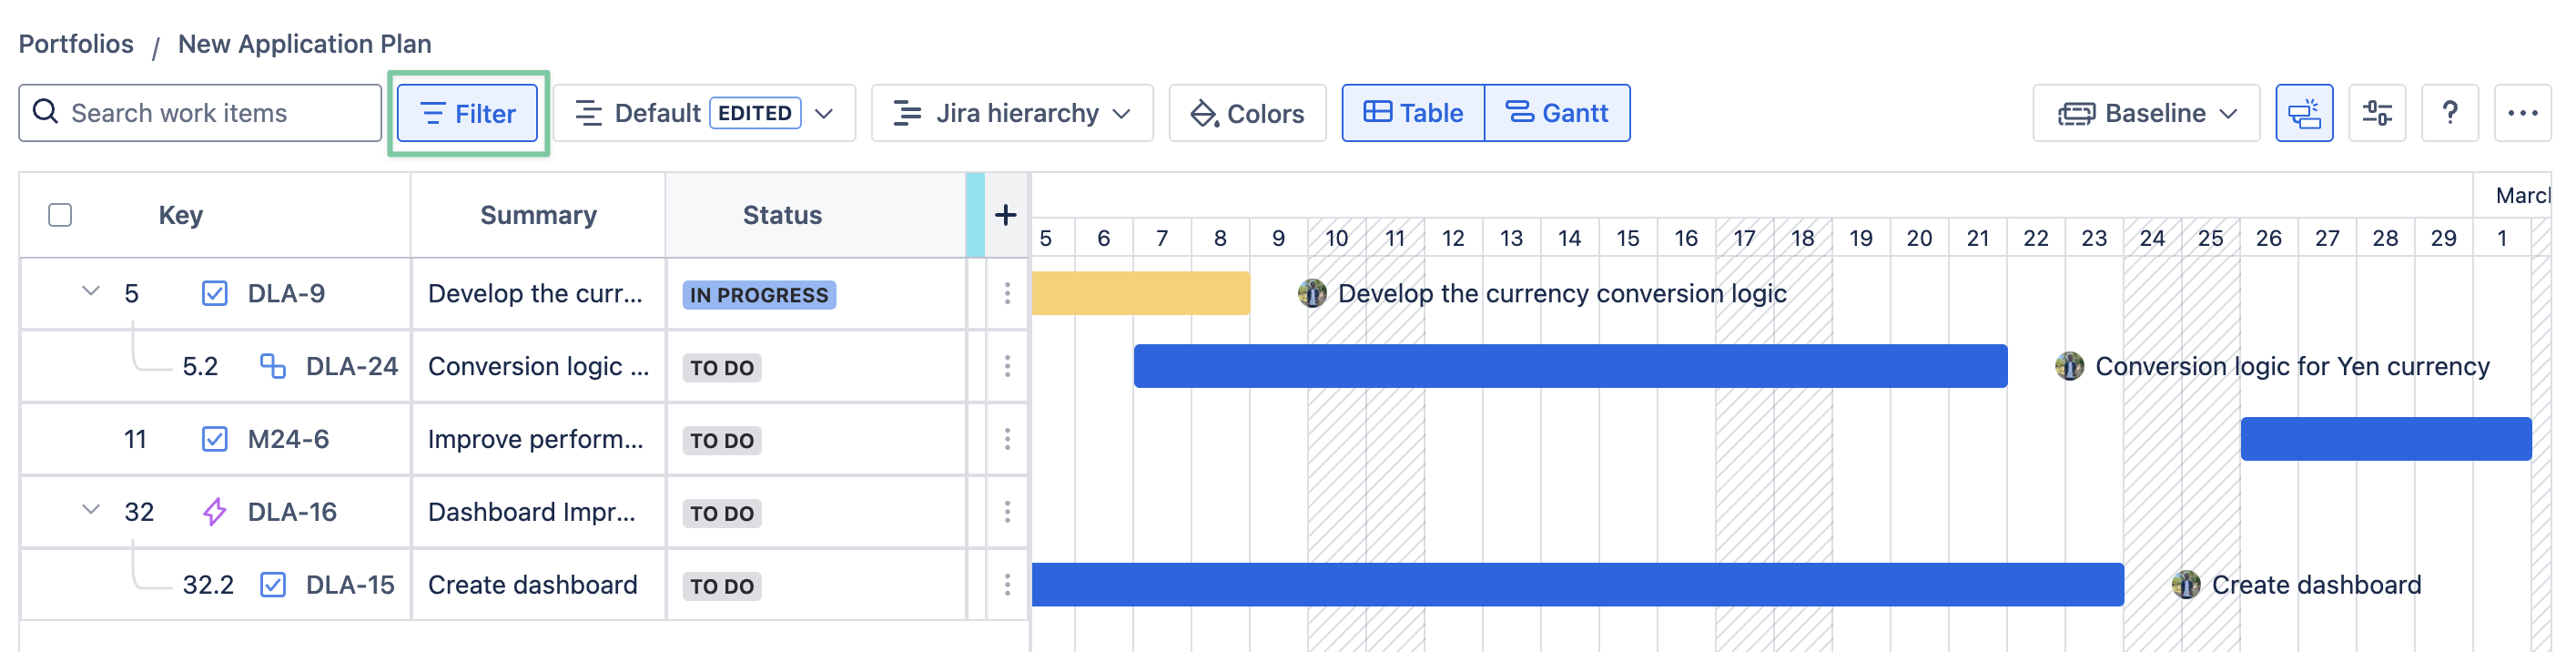
Filter
GanttTable supports Filter to refine and narrow down data fields and quickly locate relevant Jira issues.
Check the list to see supported fields in GanttTable.
Currently, the Filter feature uses either Basic or JQL. For example, you can fill in the JQL filter box with assignee=… AND priority=… to filter Jira issues from a specific member with a certain level of priority.
Keep in Mind
JQL filters require valid syntax to avoid errors. For more details, please visit Atlassian’s JQL fields and JQL keywords to use this function properly.
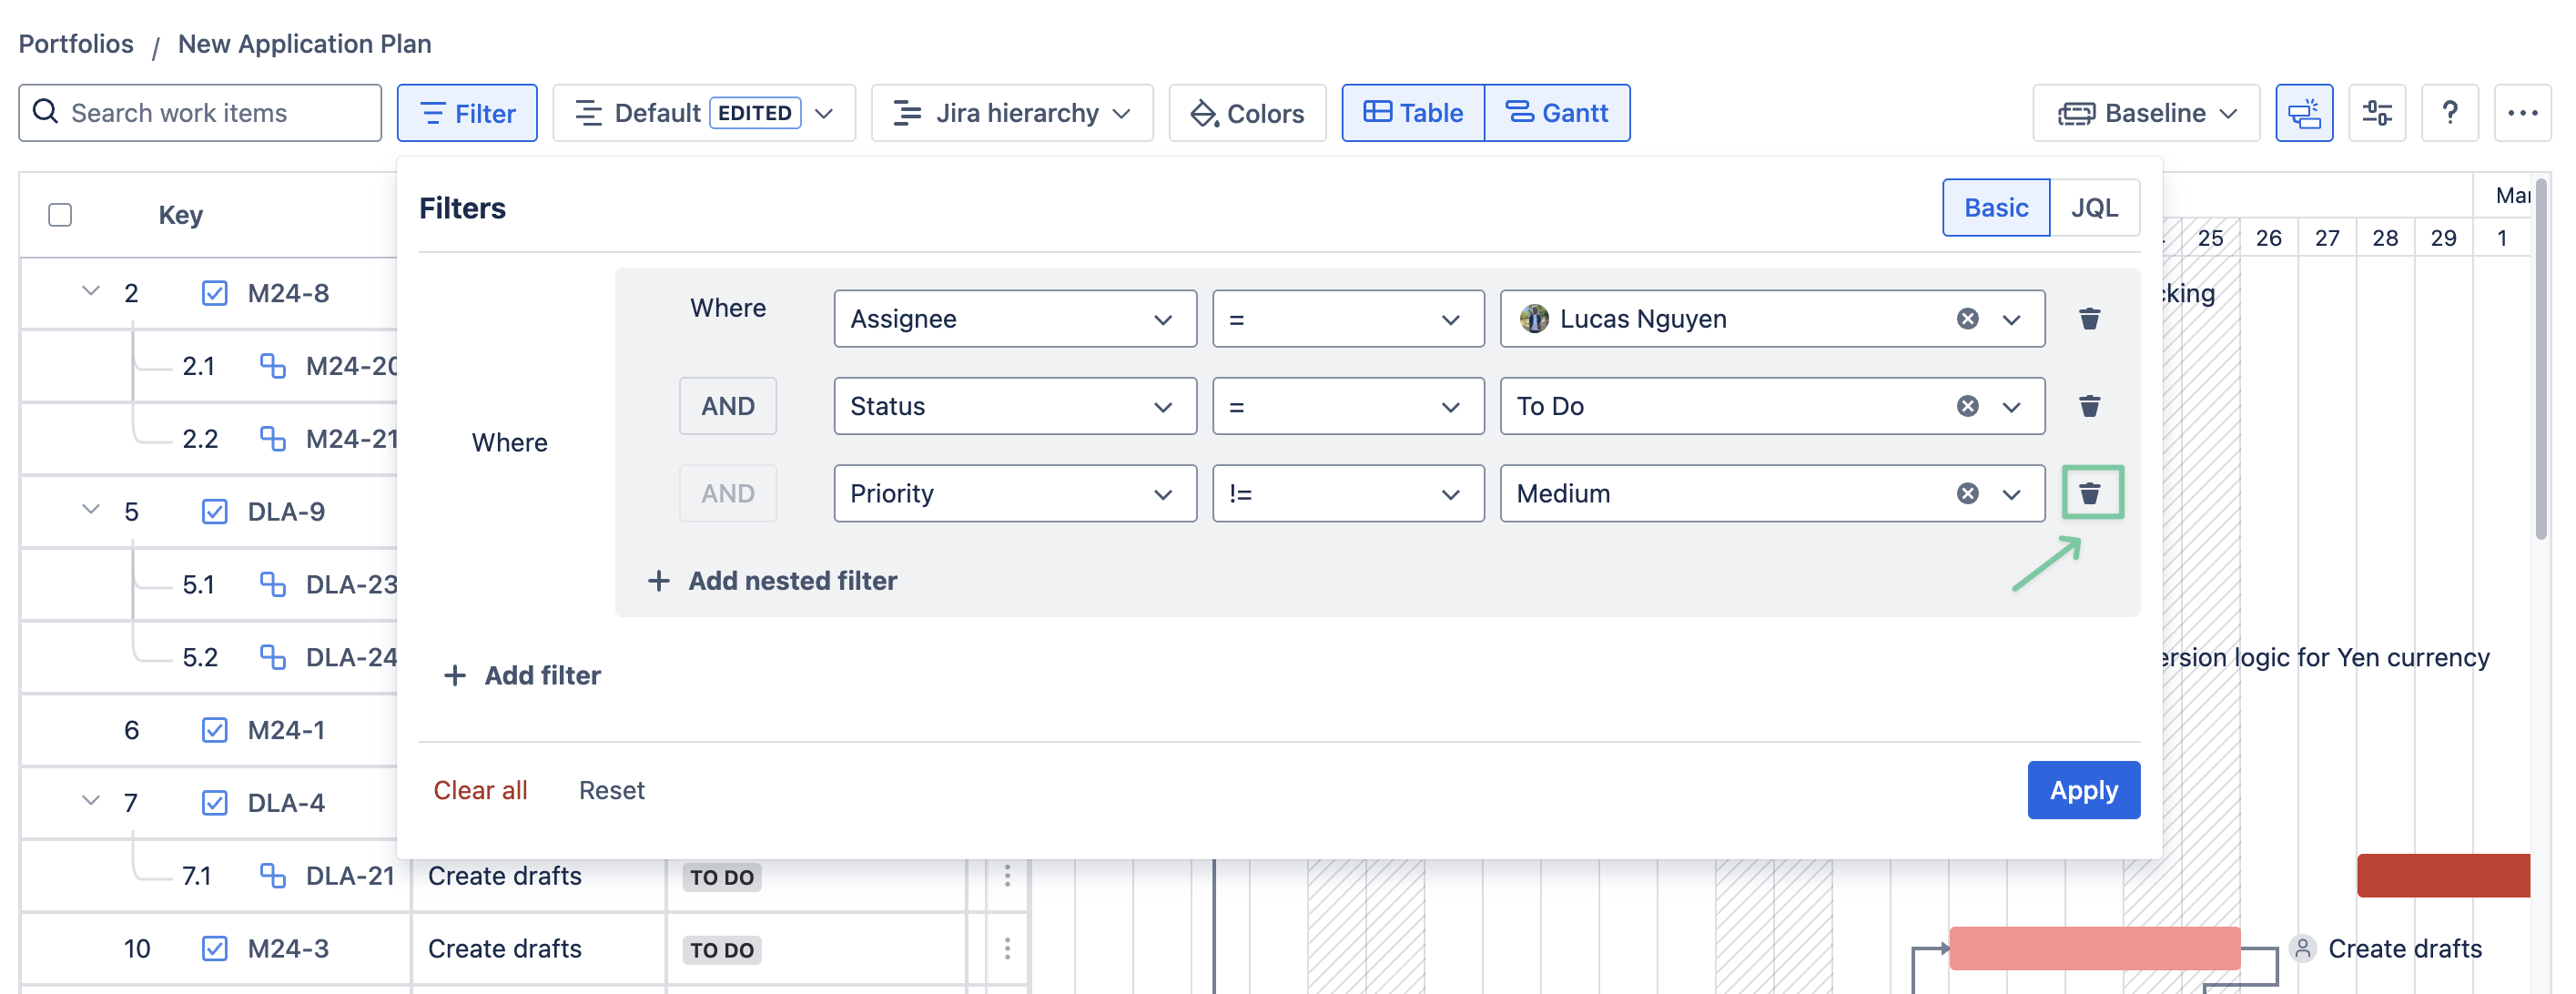
Here is an example of using the Basic filter:
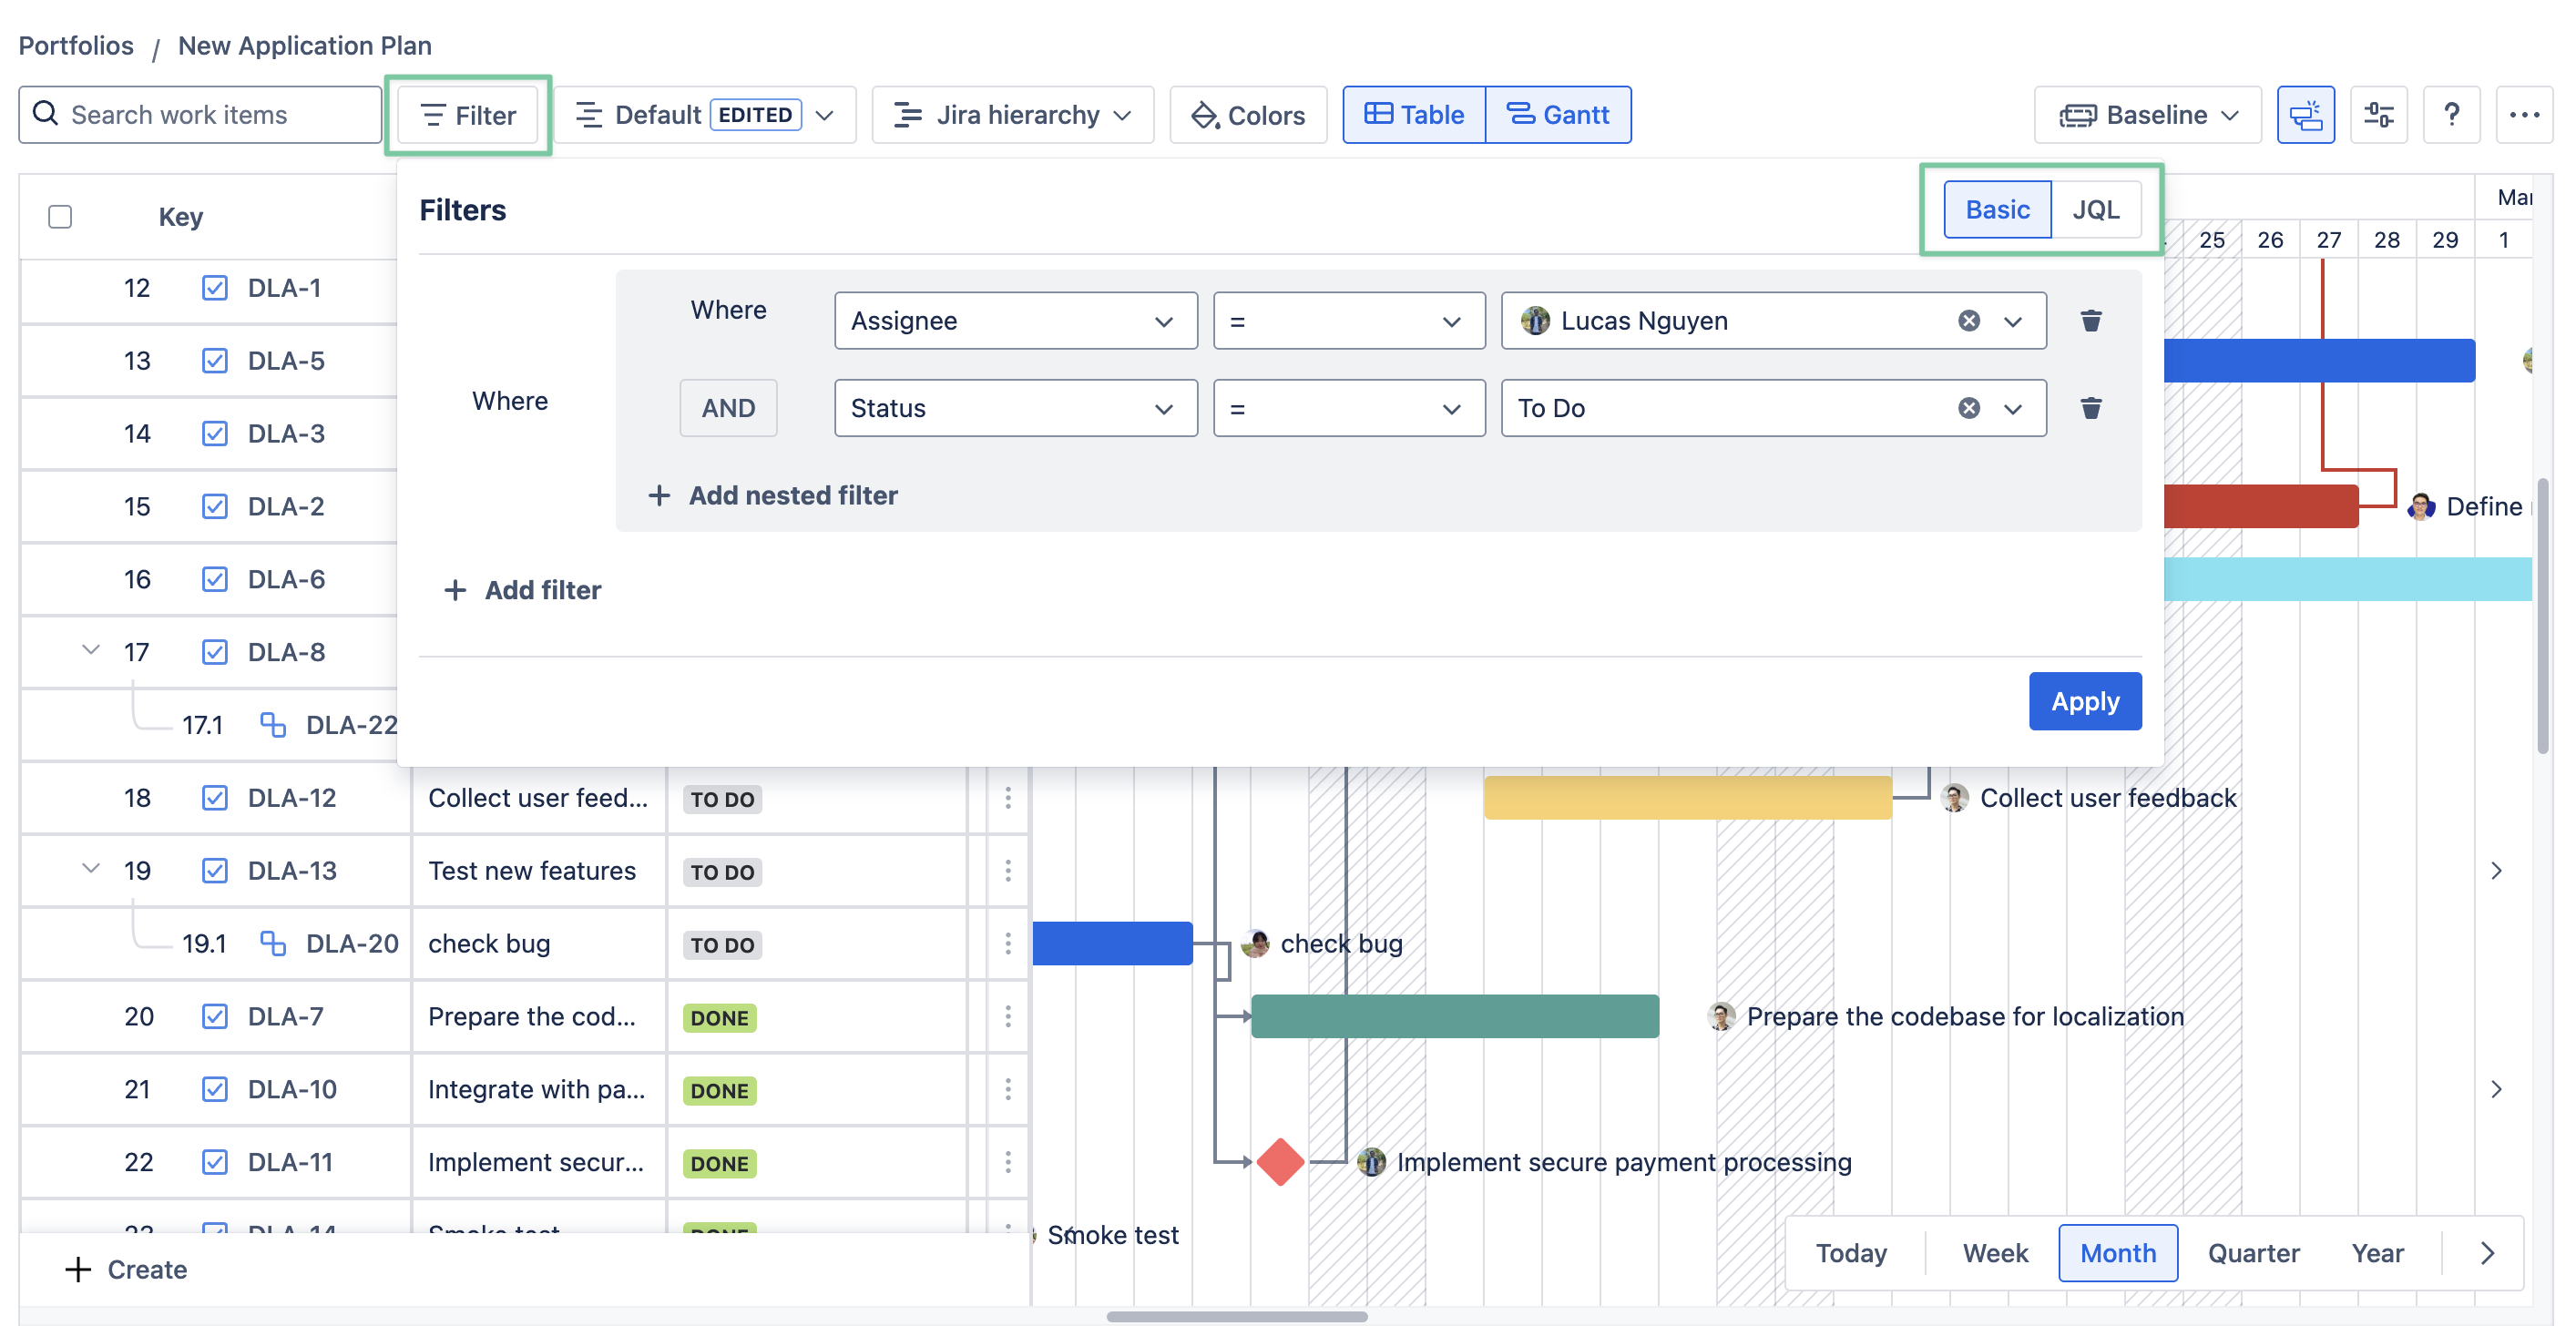
You can switch between AND and OR conditions for a different filtering result.
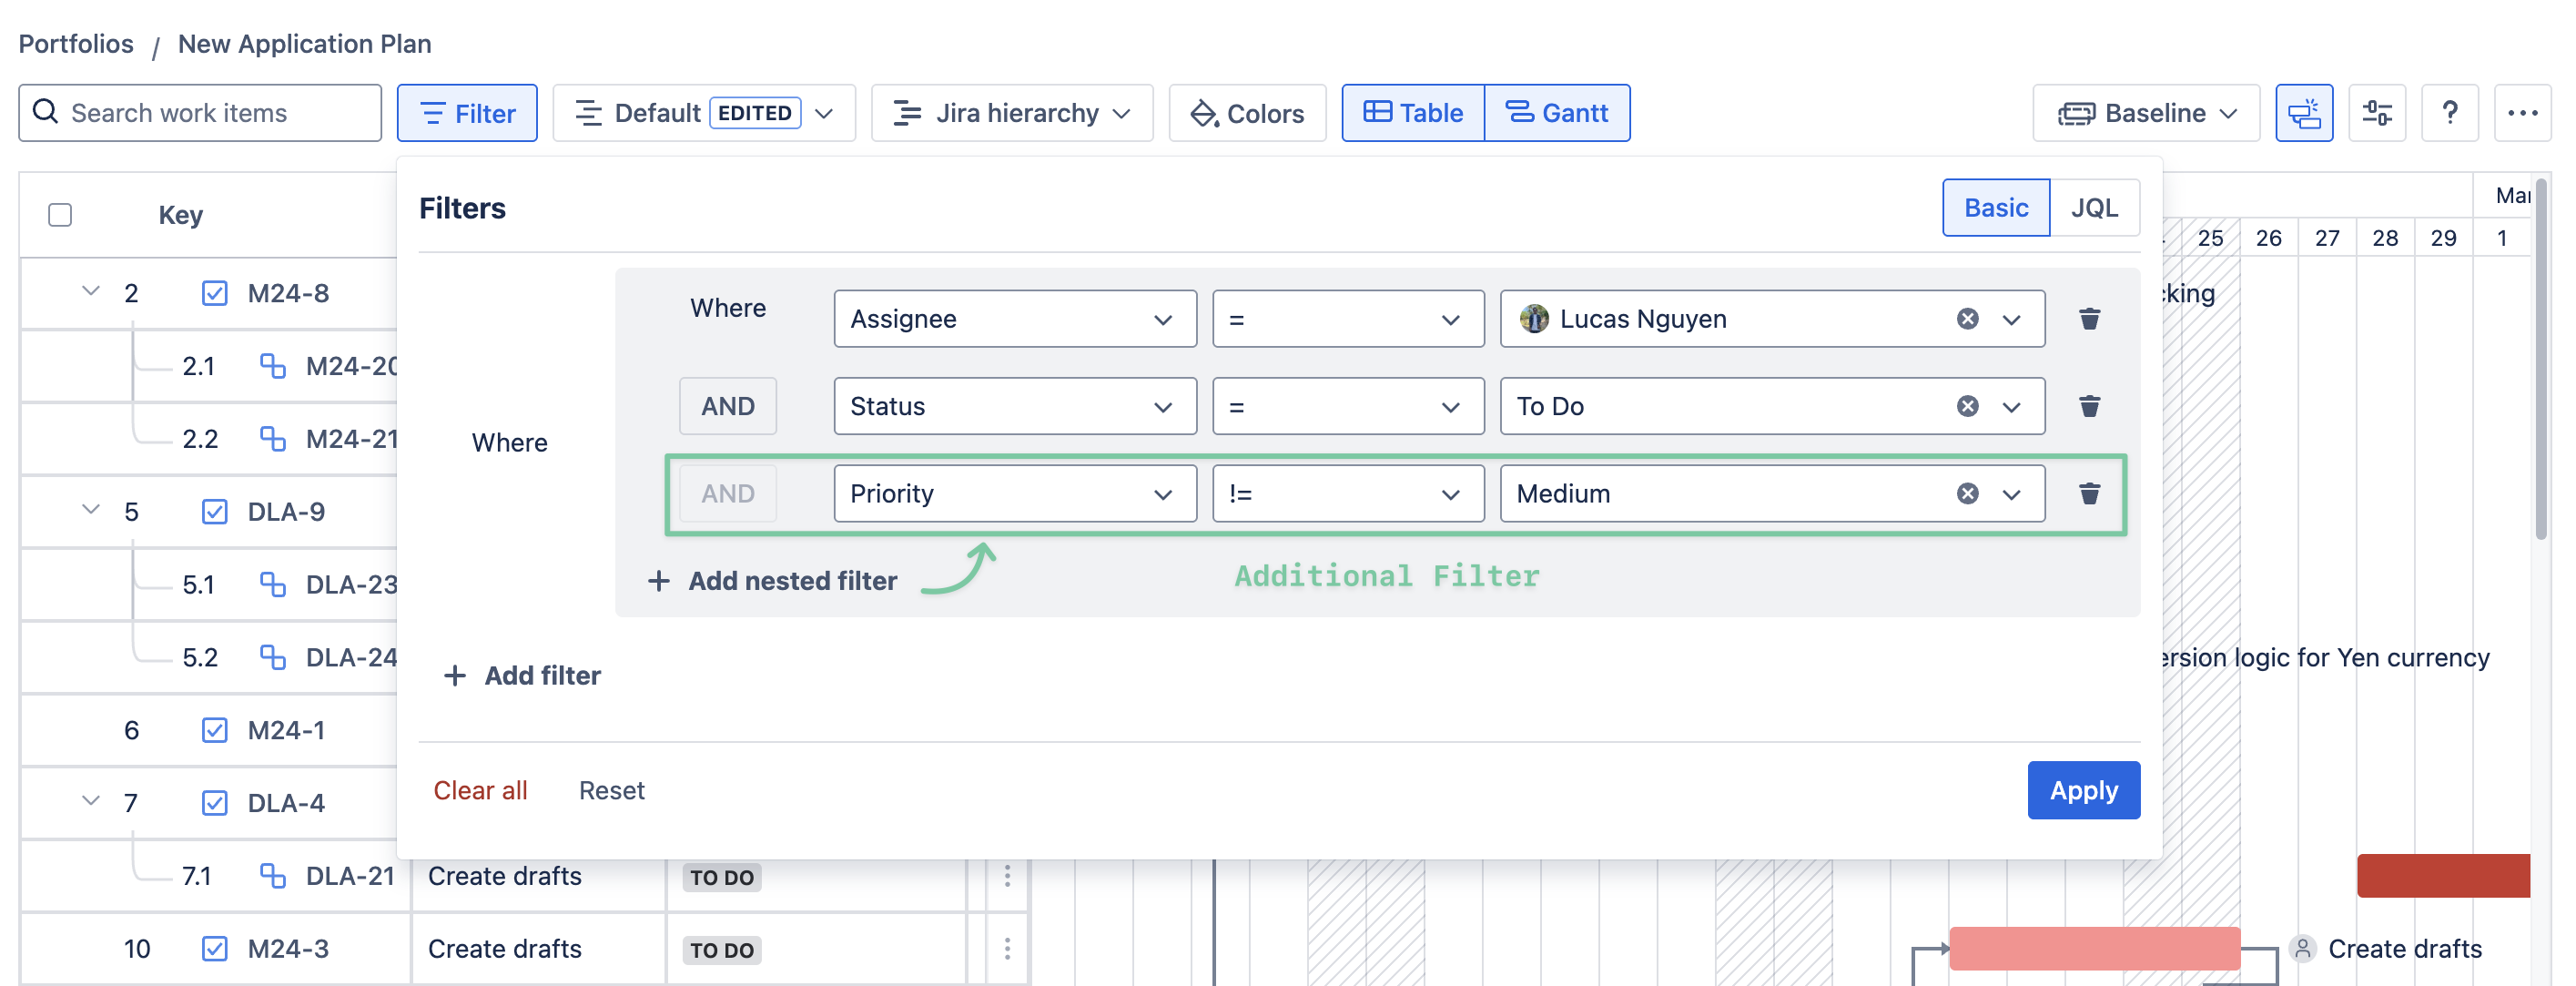
To add more rules in the Filter condition, click + Add nested filter → click Apply.
To remove a condition in the Filter, click the Delete icon.
To add more filter rules, click + Add filter → click Apply.
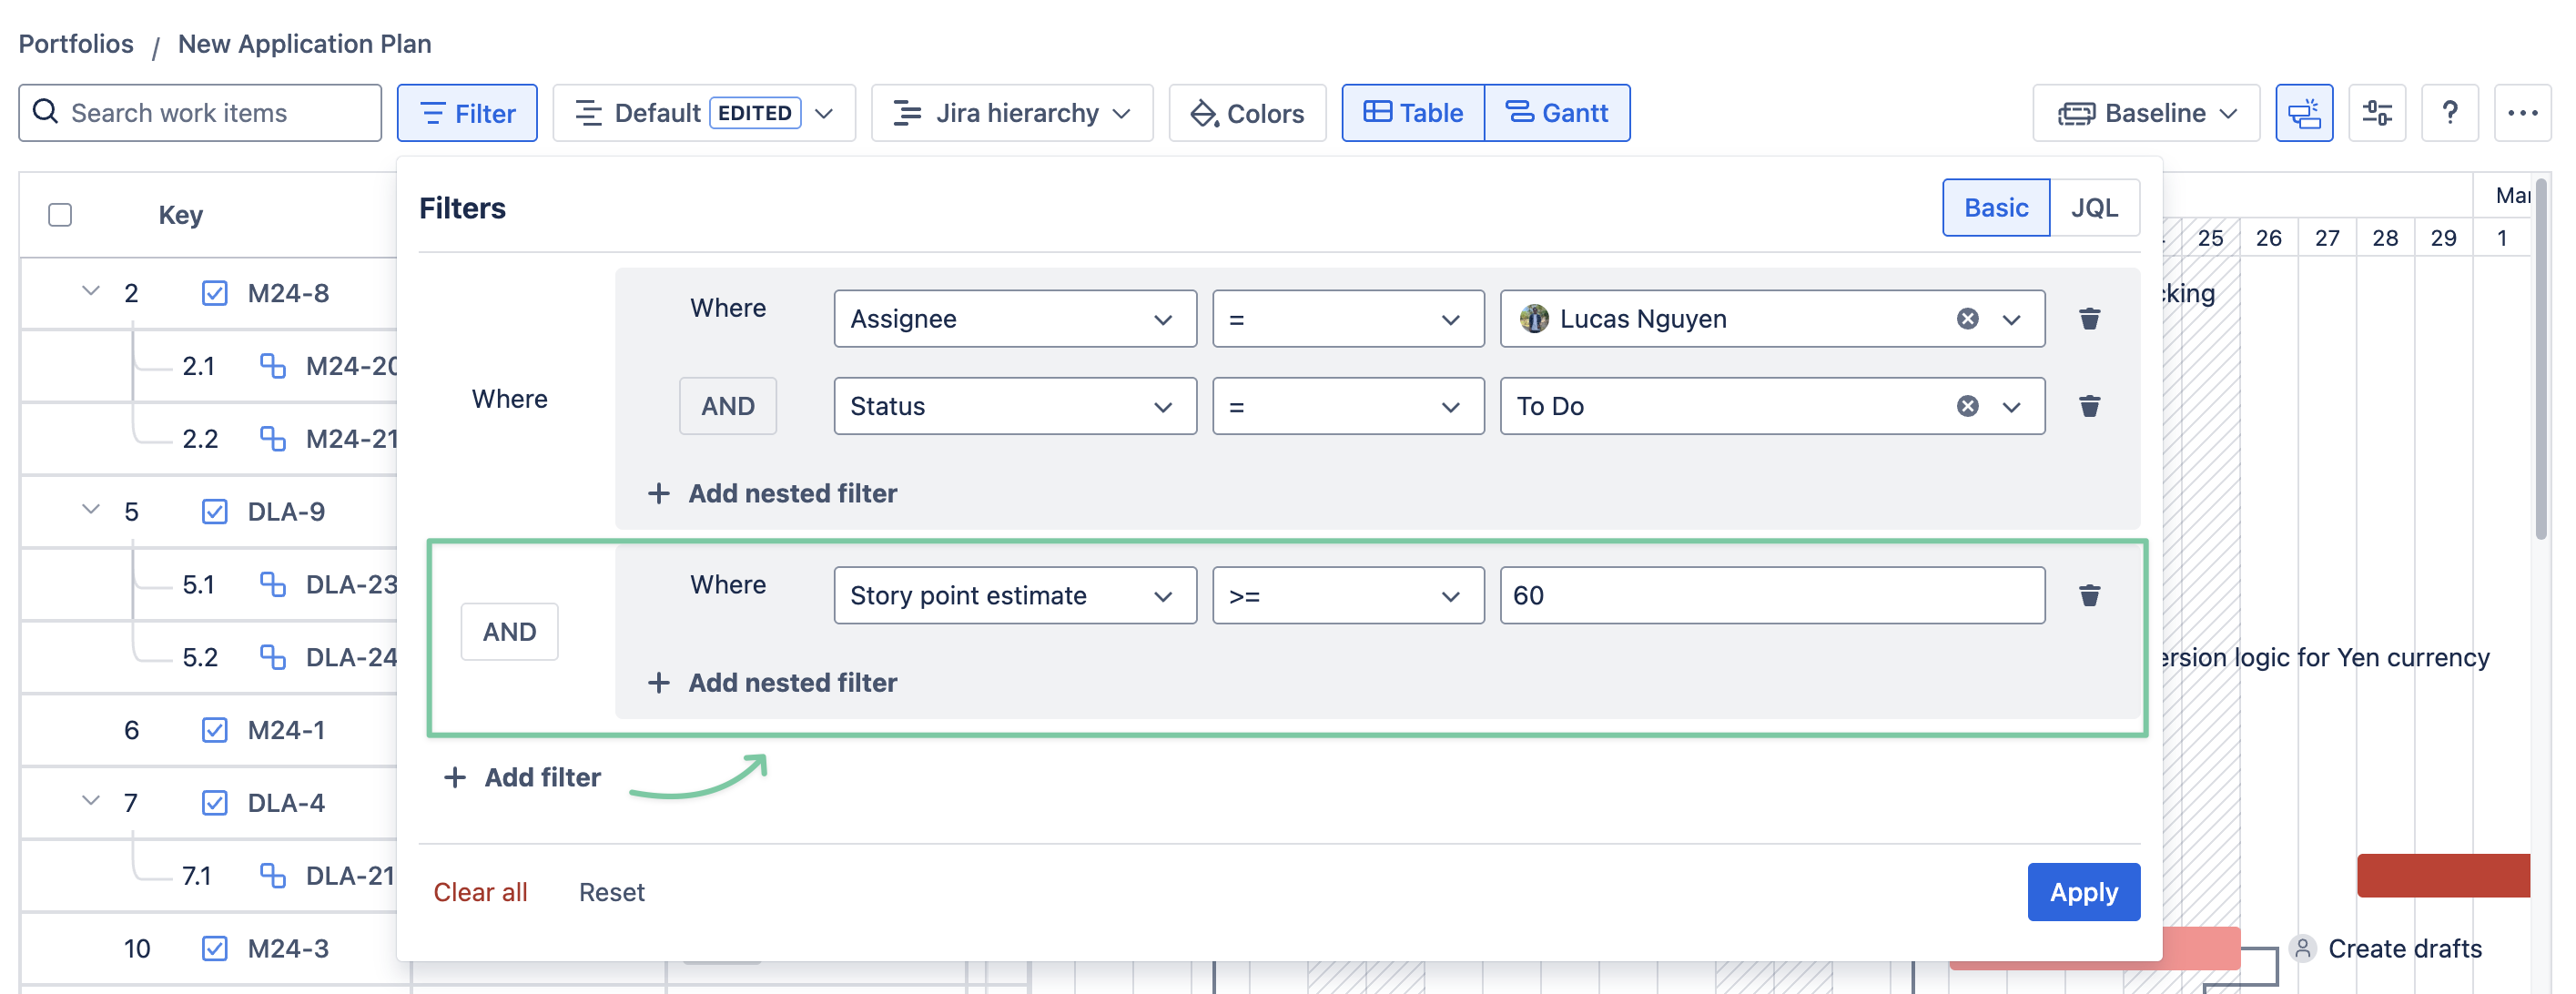
You can also switch between AND and OR conditions for additional filters.
Search
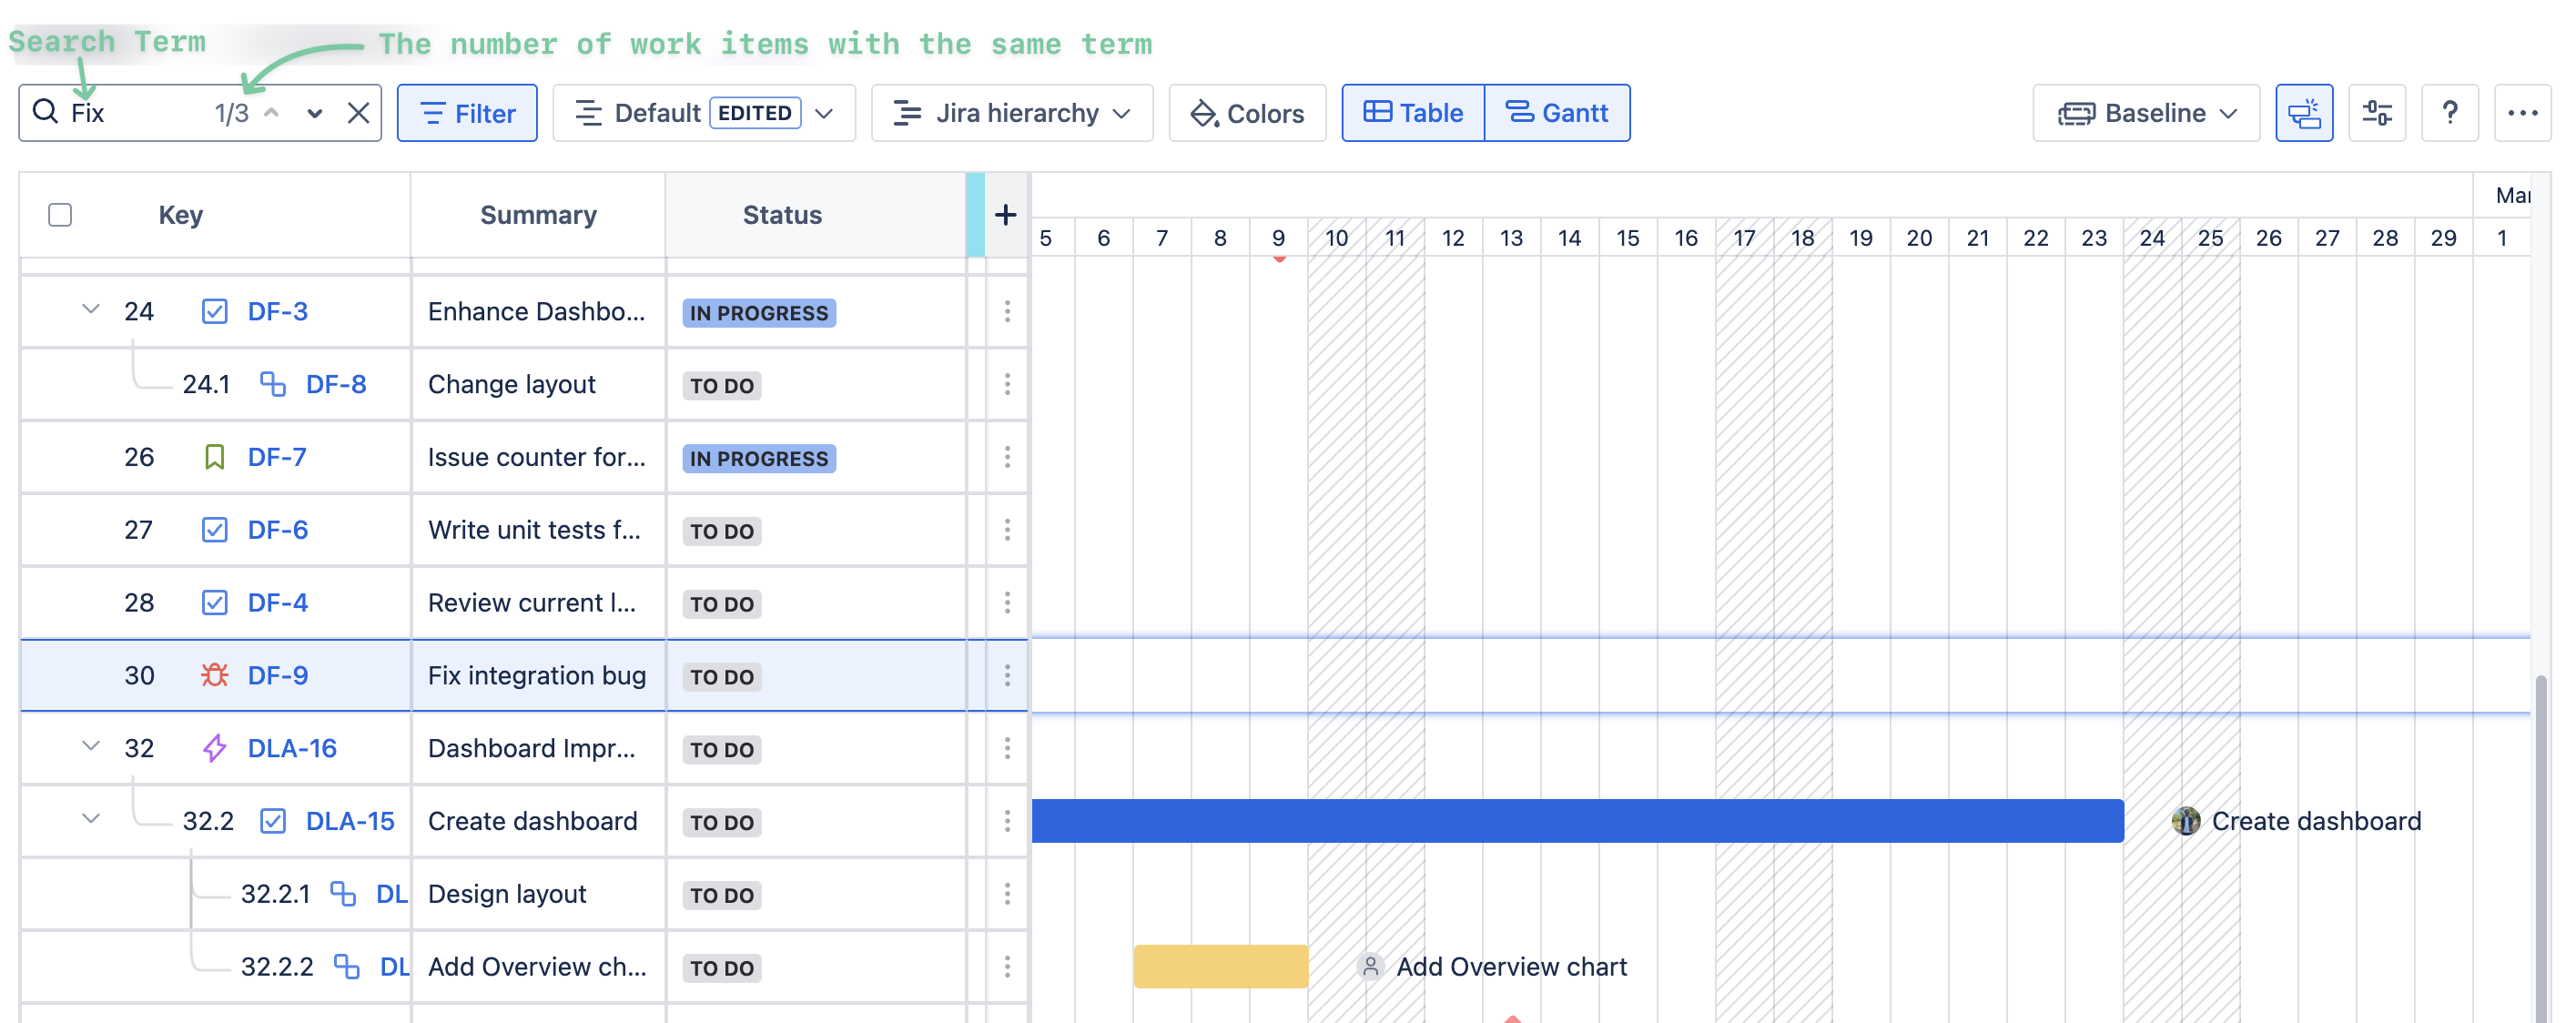
Quickly locate specific tasks or Jira work items by using the Search feature.
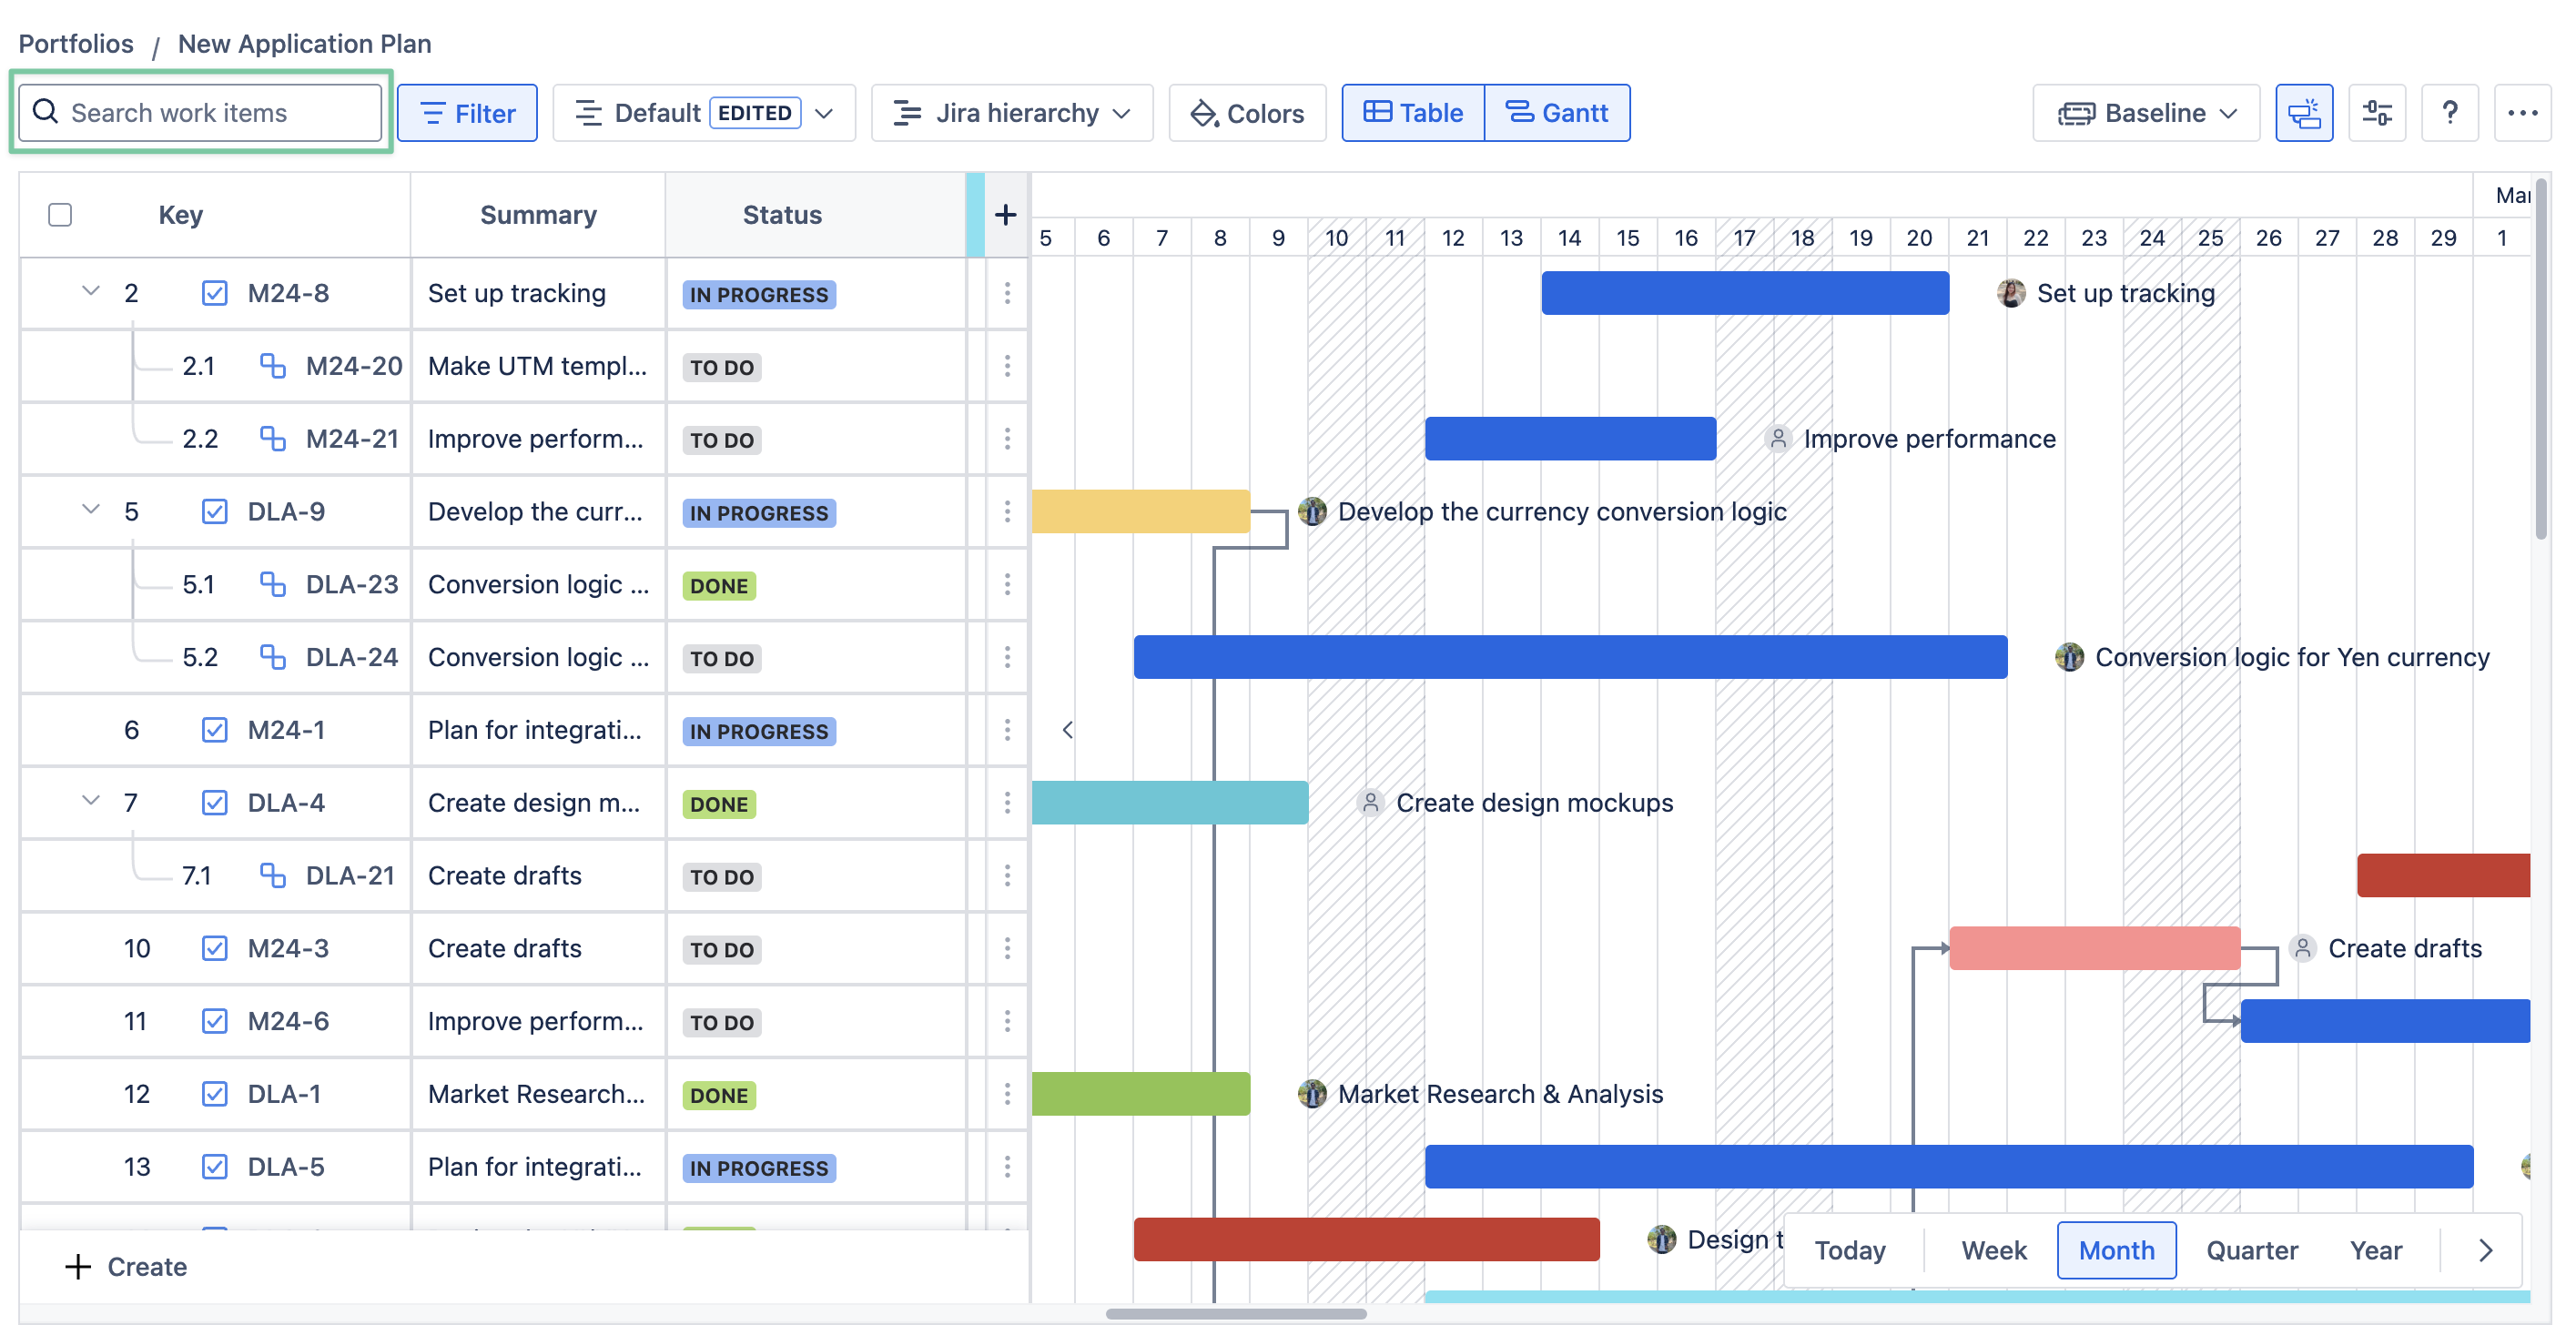
To utilize the Search feature, please use either the Jira work item key or the Summary.
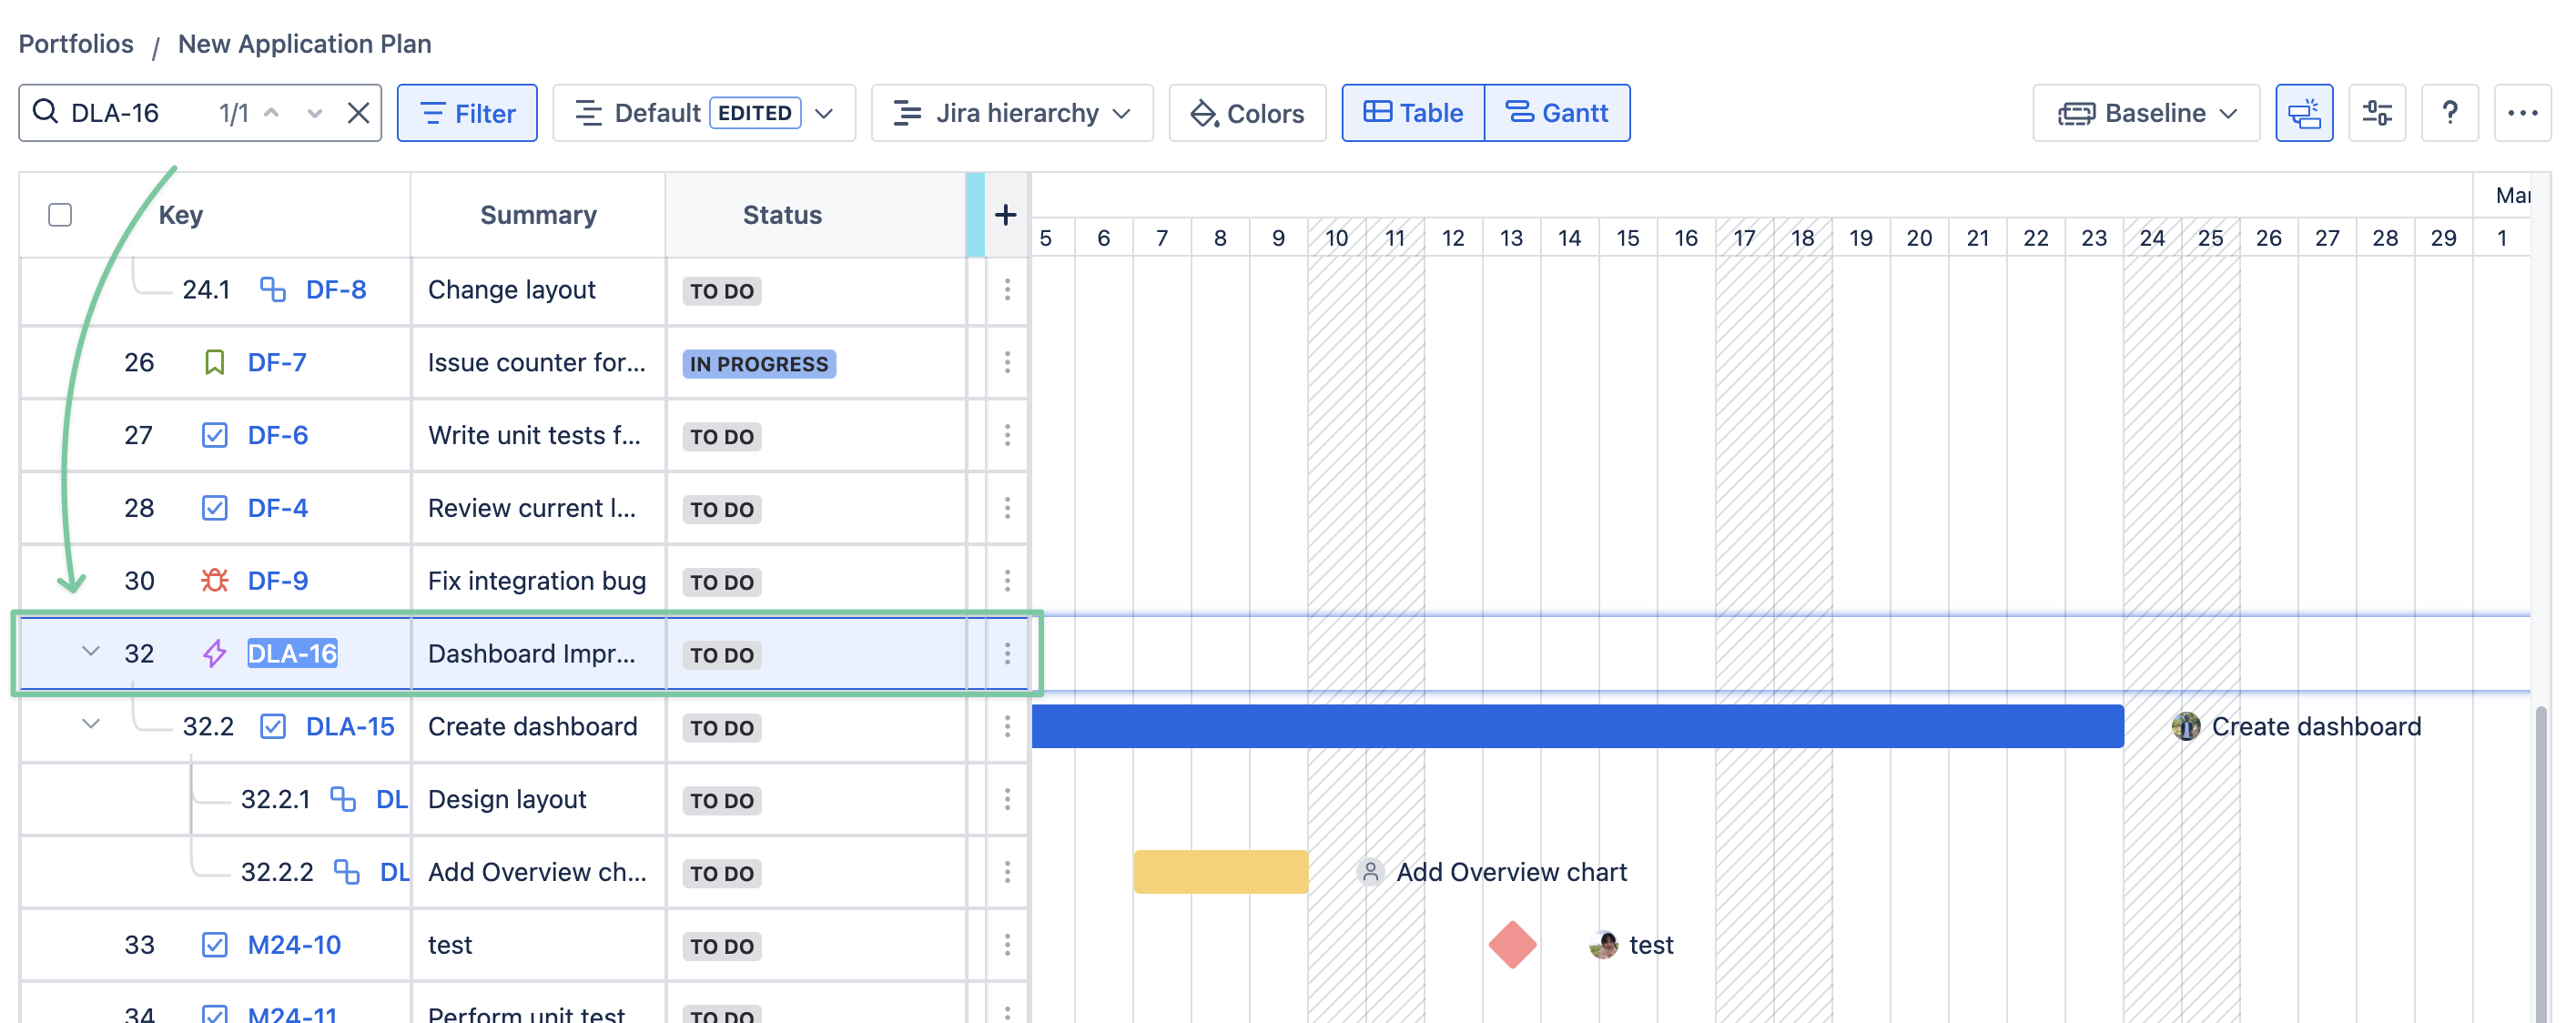
TIP
If you search by using the project key or summary, all the work items with the same search term will be located.
Colors
GanttTable is equipped with a Color mark feature to help you work with the issue structure sheet more easily.
With this, users can quickly add colors to multiple cells or rows in the structure table at the same time.
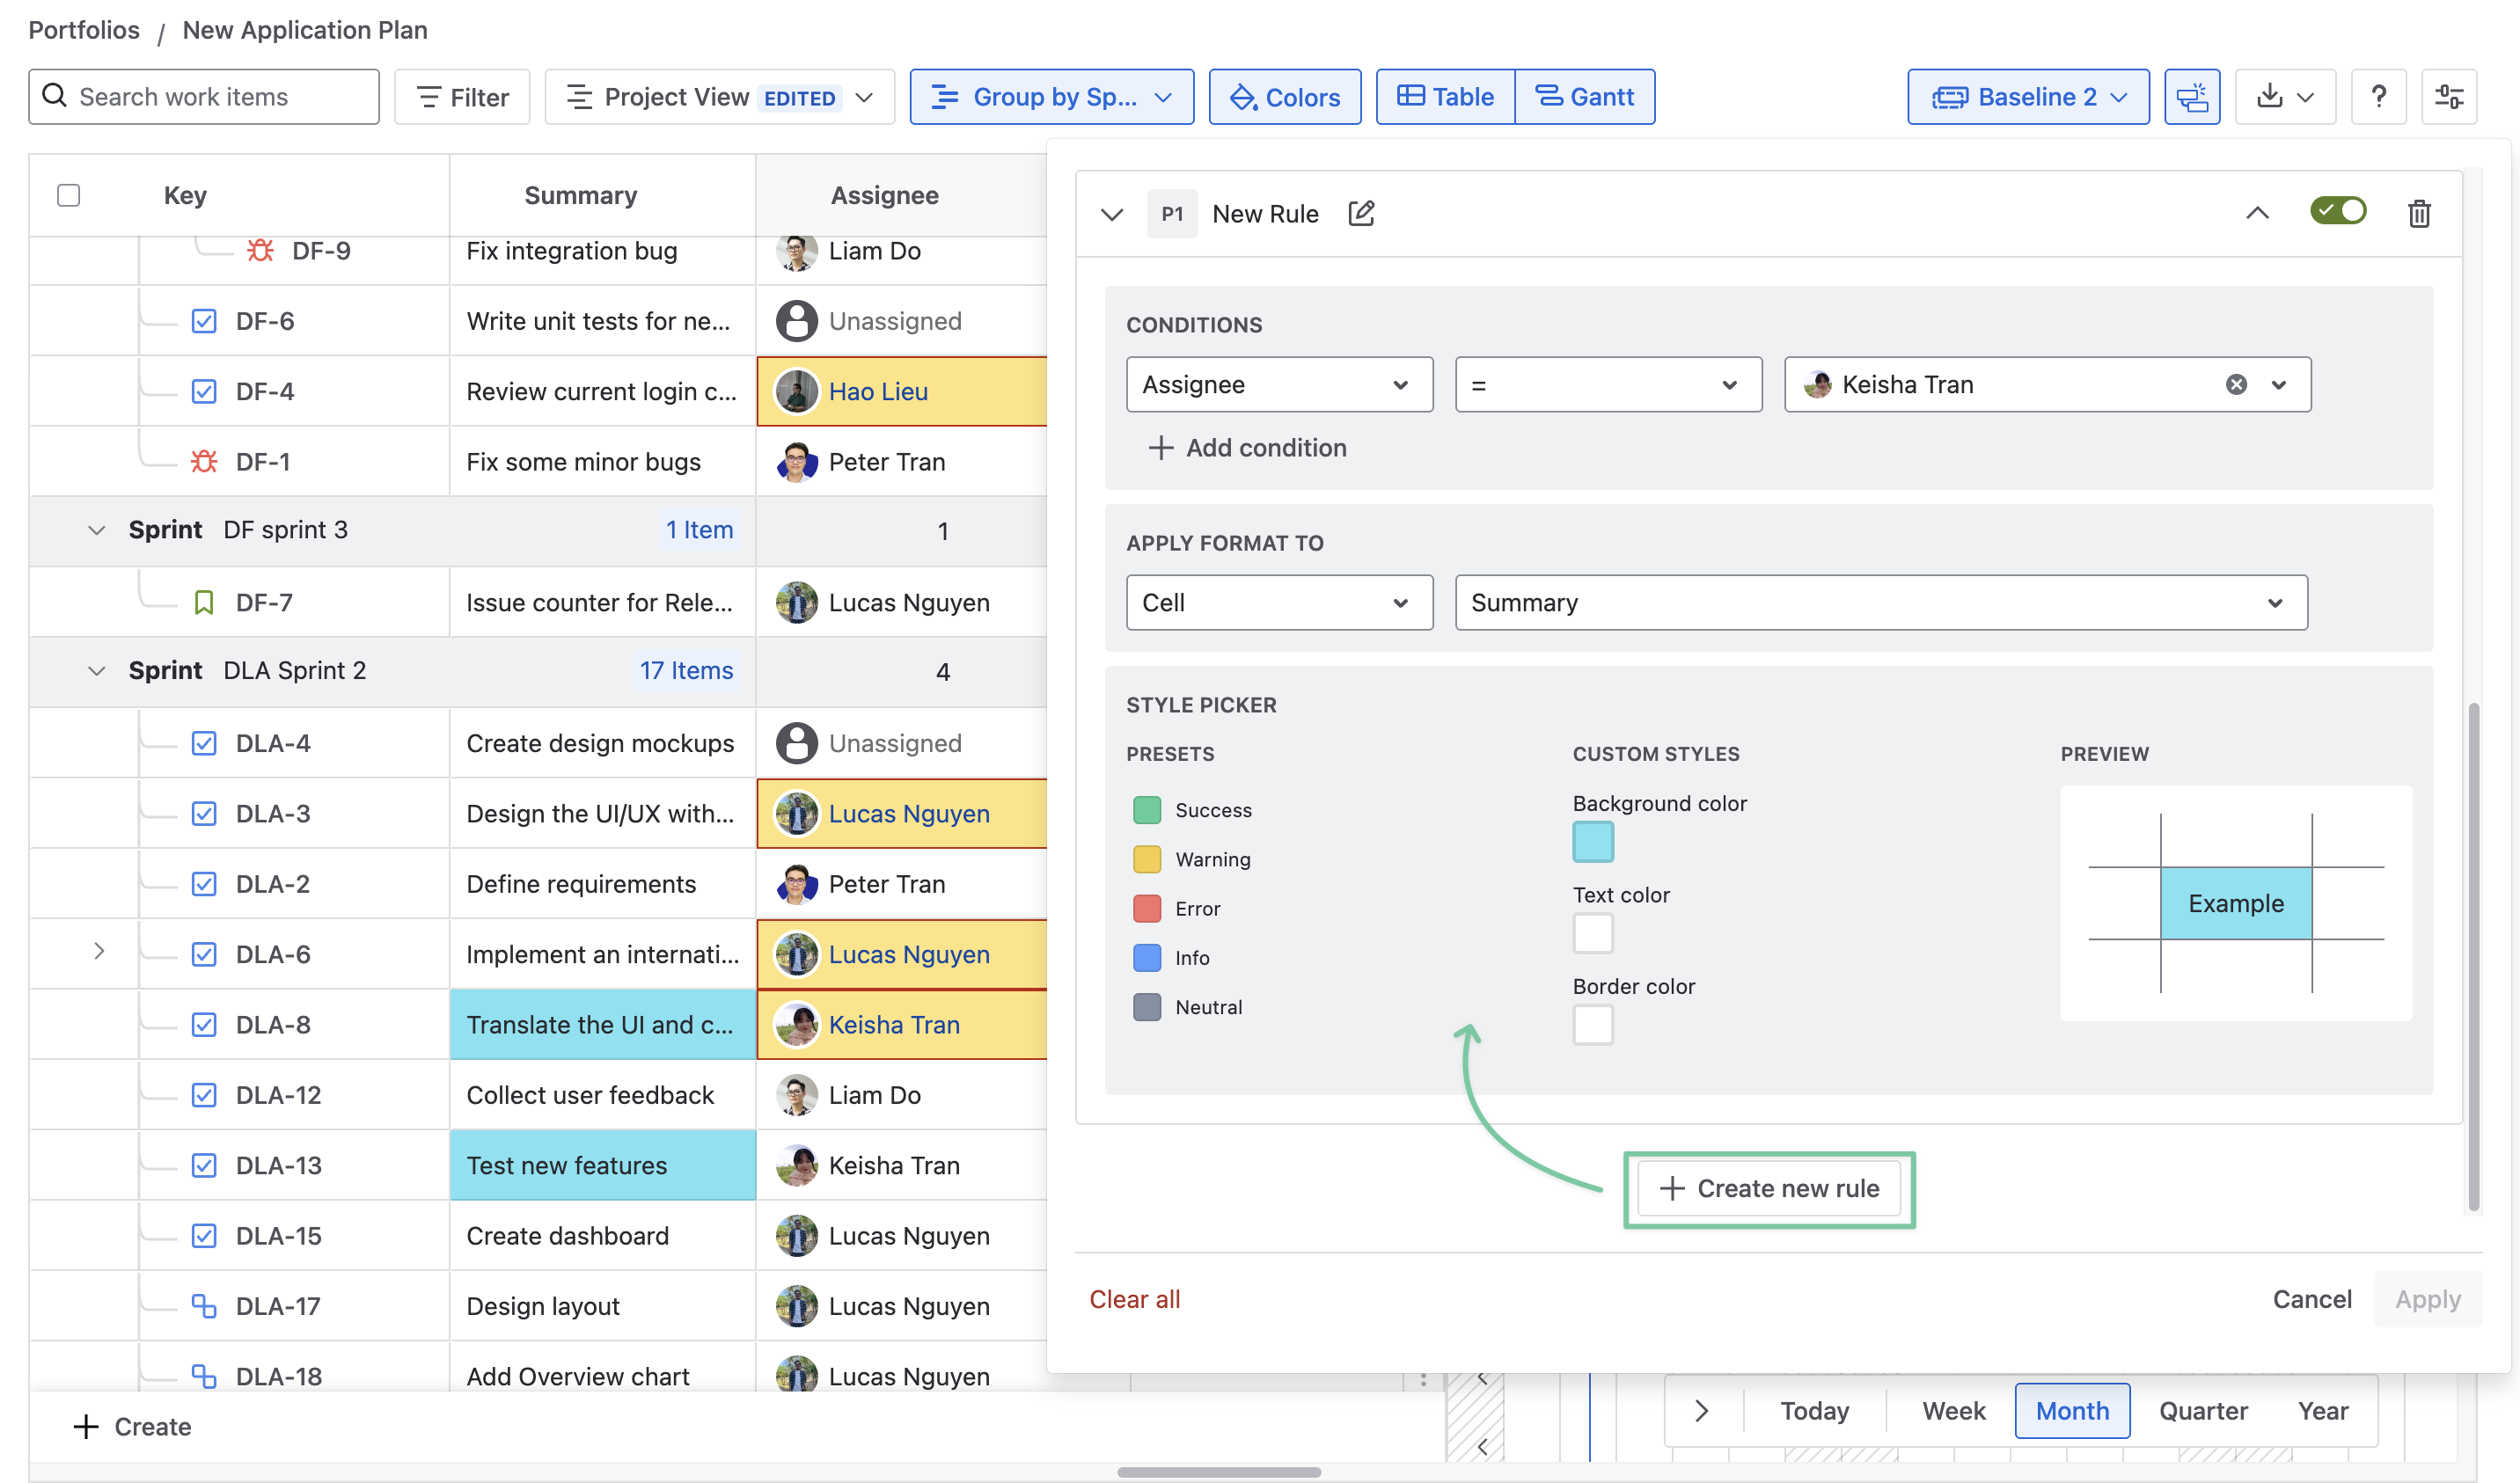
Locate the Colors button. Then, you can add a new rule to start setting a new color condition.
In the dialog, you can choose which field will be used for the condition and the value related to that field. (For example, in the image below, we’re selecting Priority and choosing the ‘High’ priority as the condition).
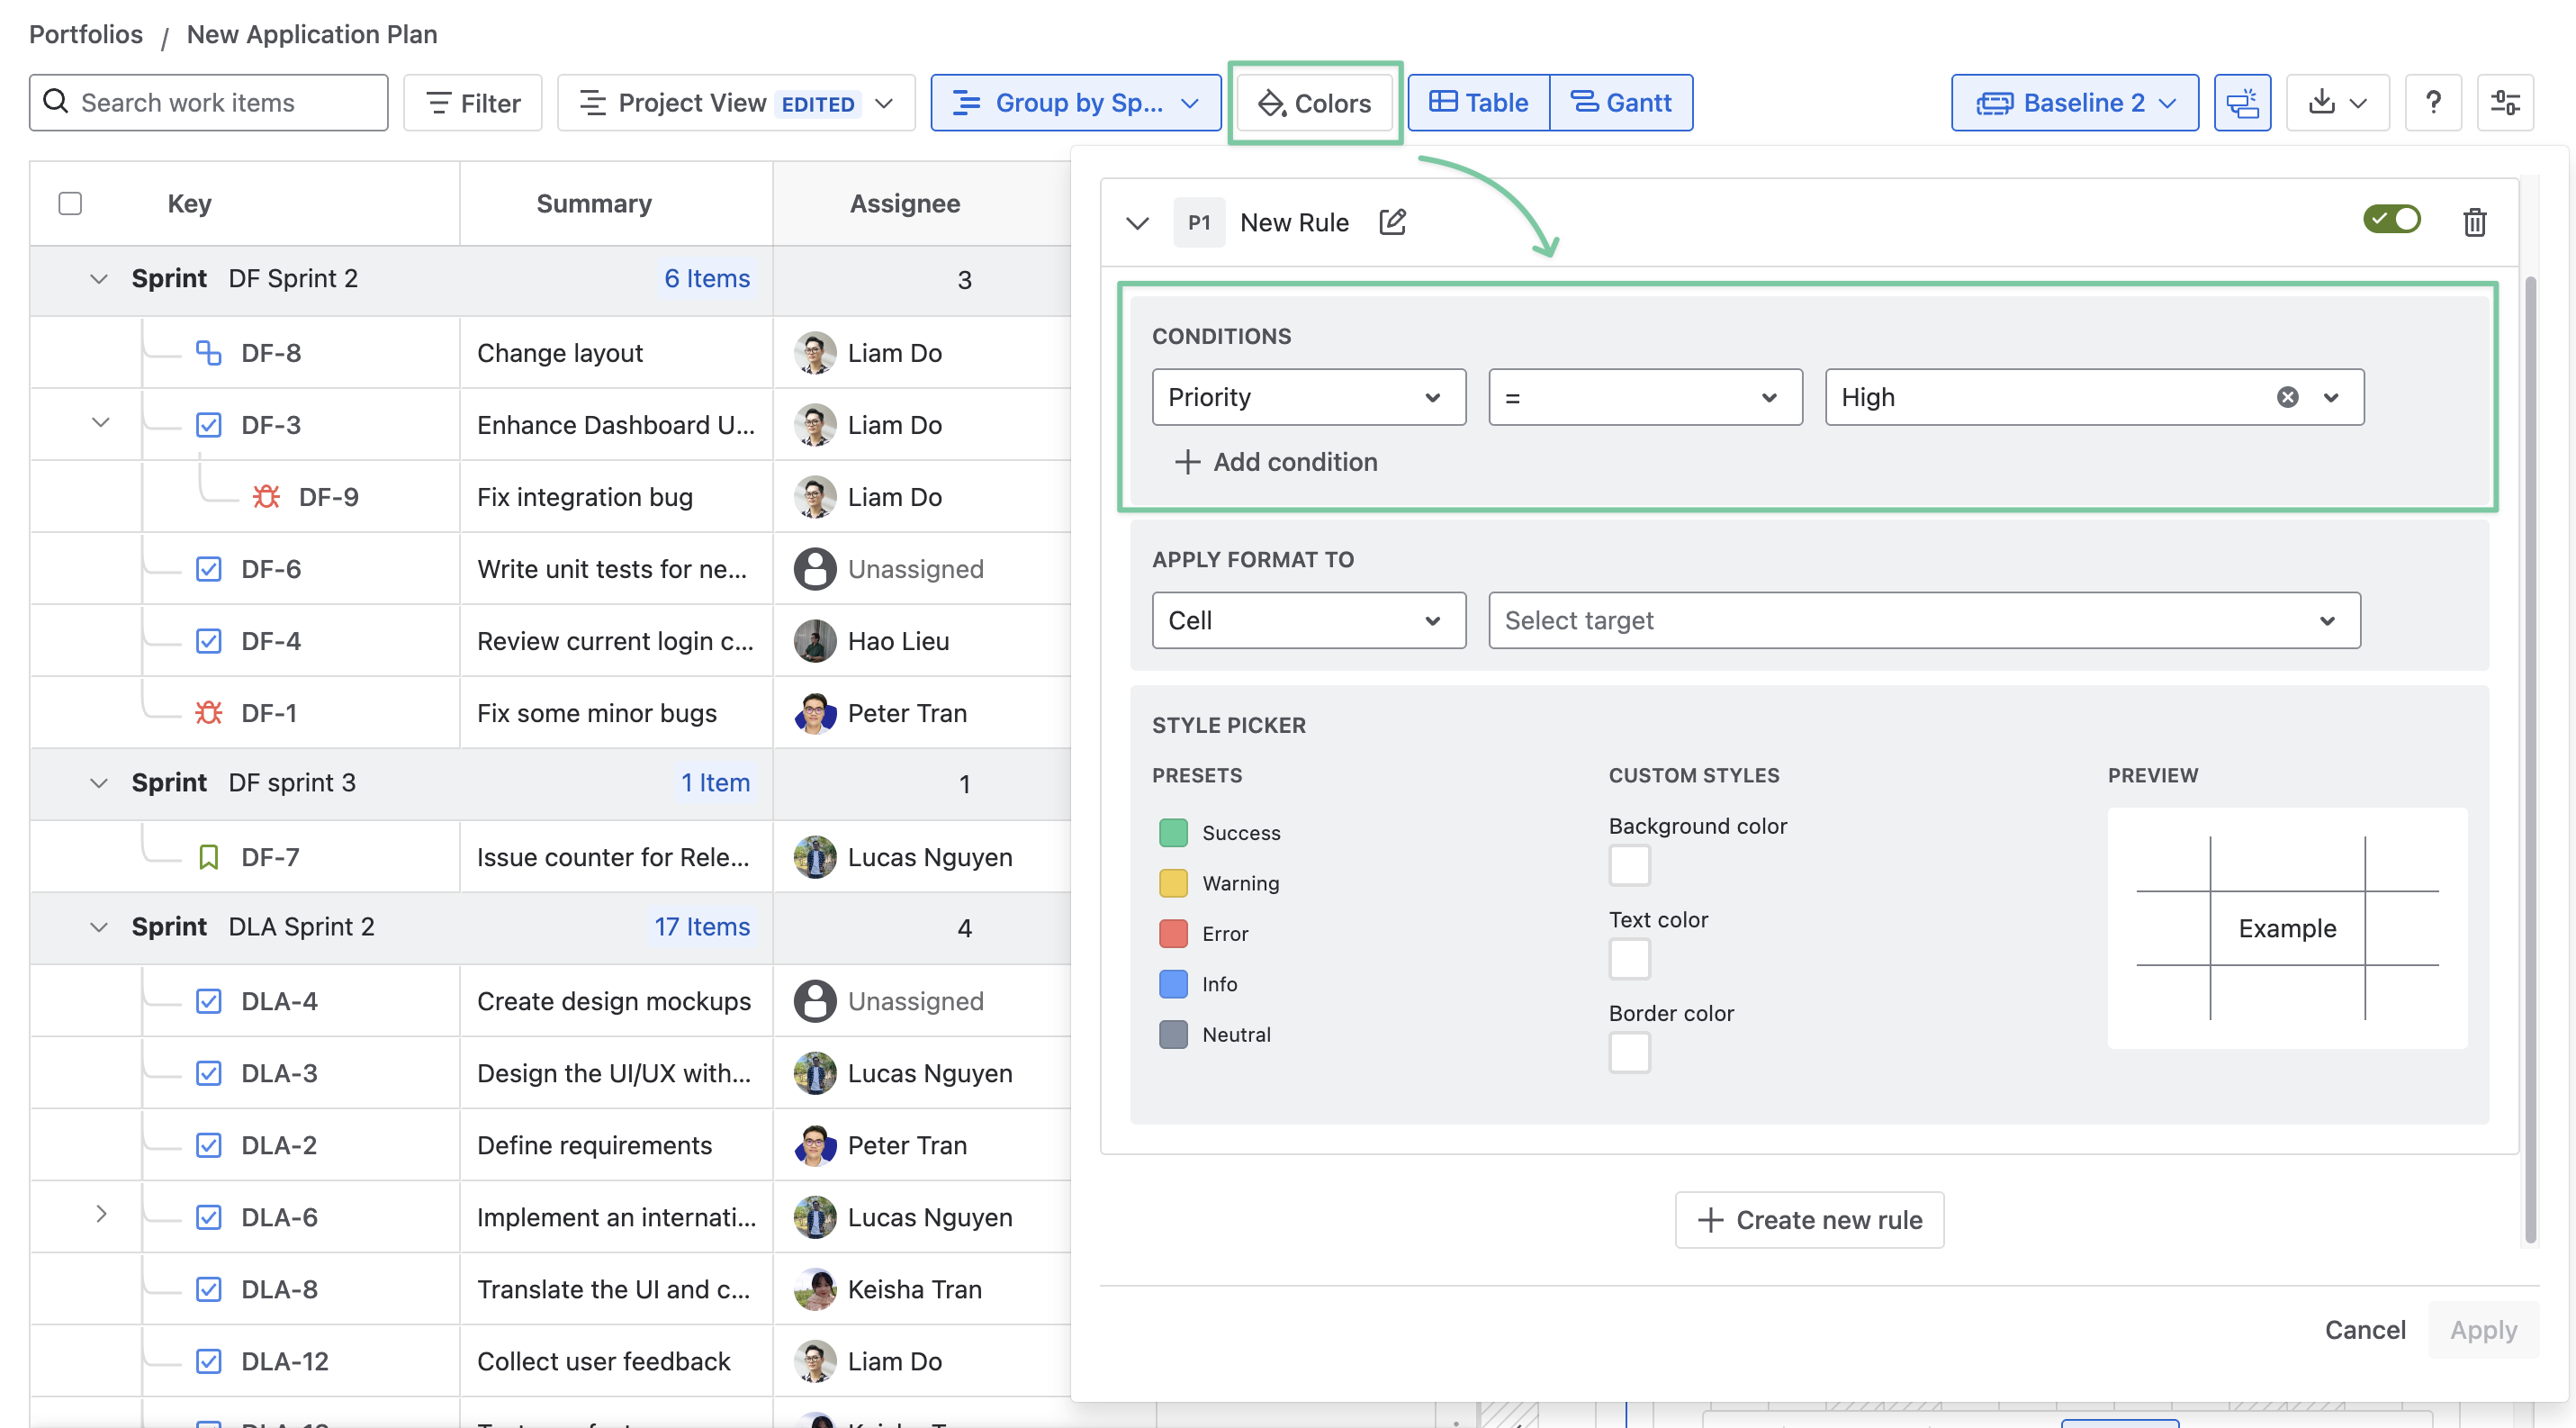
You can also add another condition in the same rule for additional color conditions of the rule.
Next, move on to Applying Format, where you can decide whether you want to assign color to specific cells or the entire row of the structure table.
When coloring cells only, you will have to select the target cells to make it work. (If you want to color the whole row, you don’t have to choose the target cell.)
All you have to do now is choose the color you want. Currently, GanttTable supports adding color to:
-
Background
-
Border
-
Text
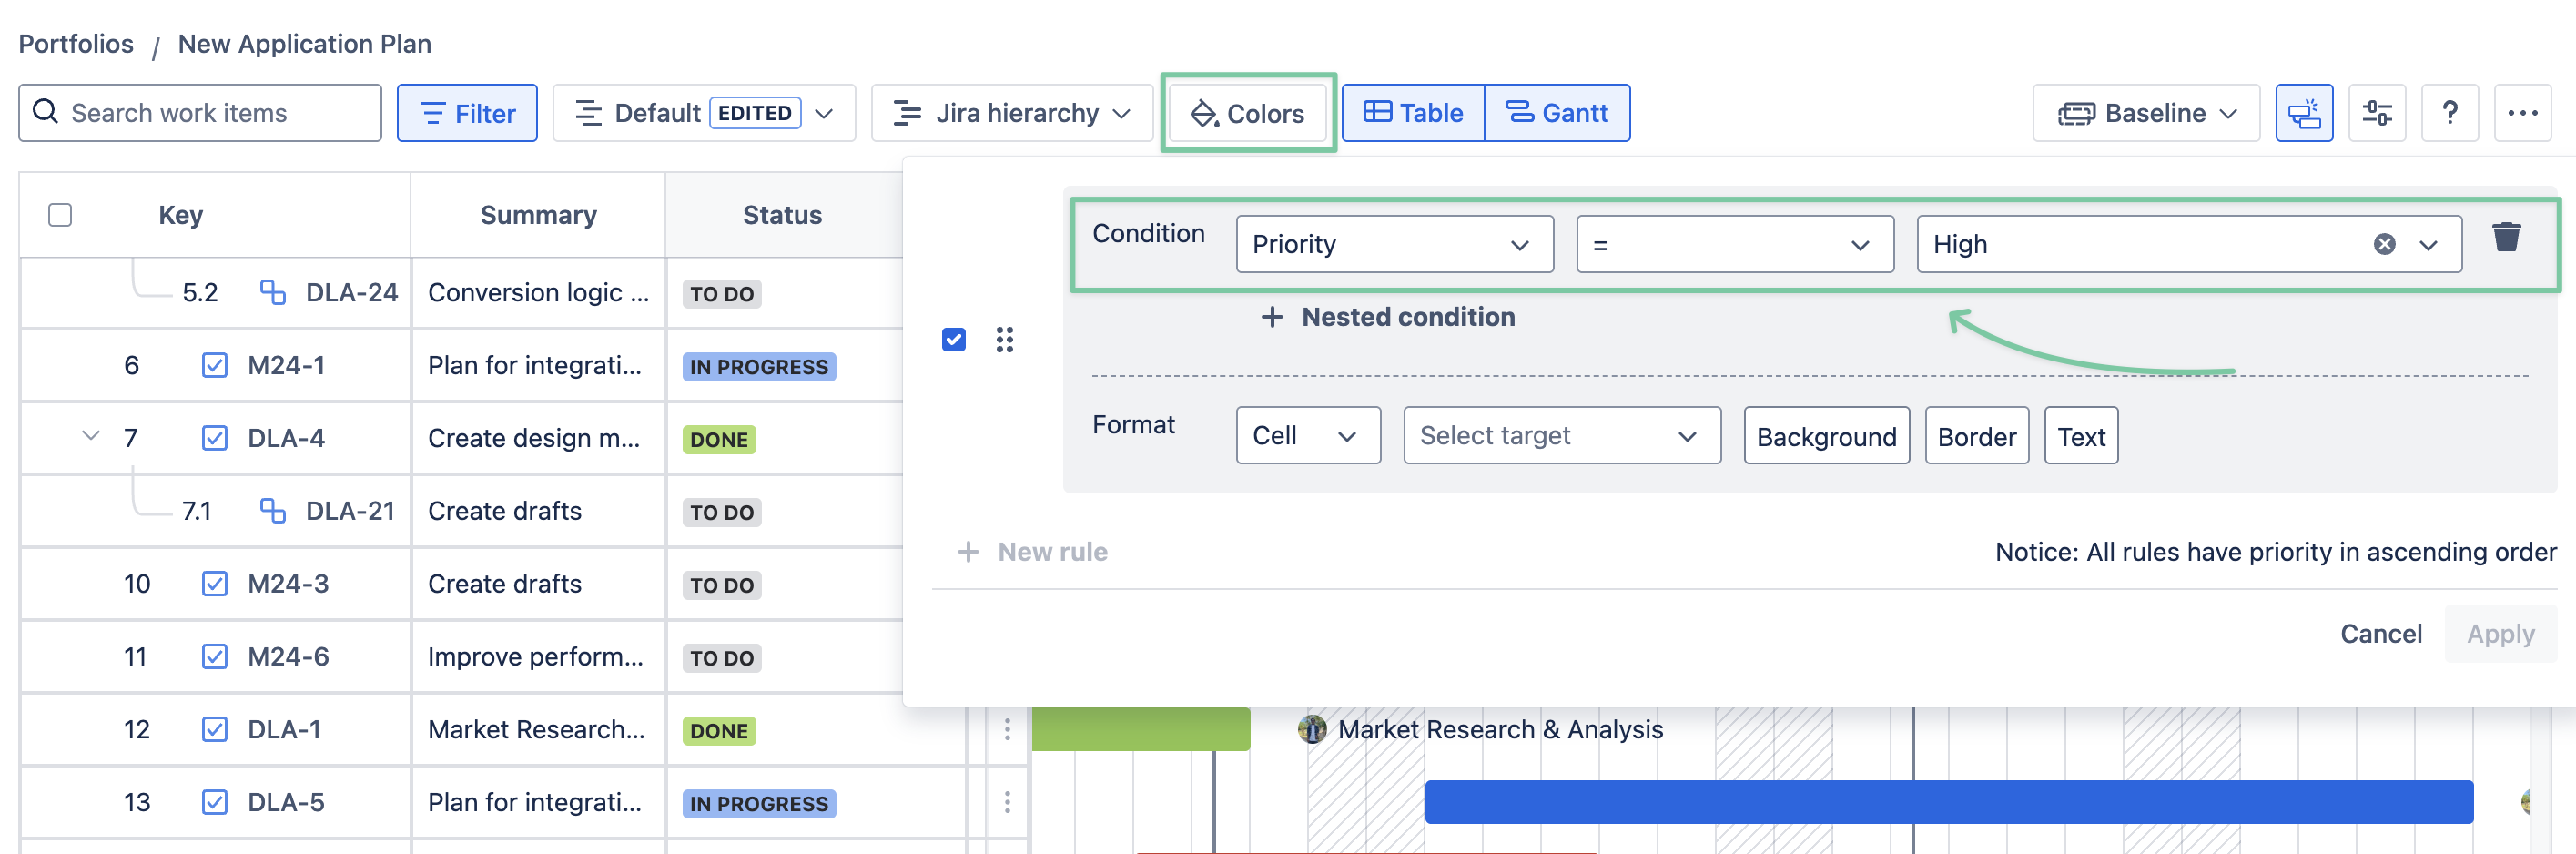
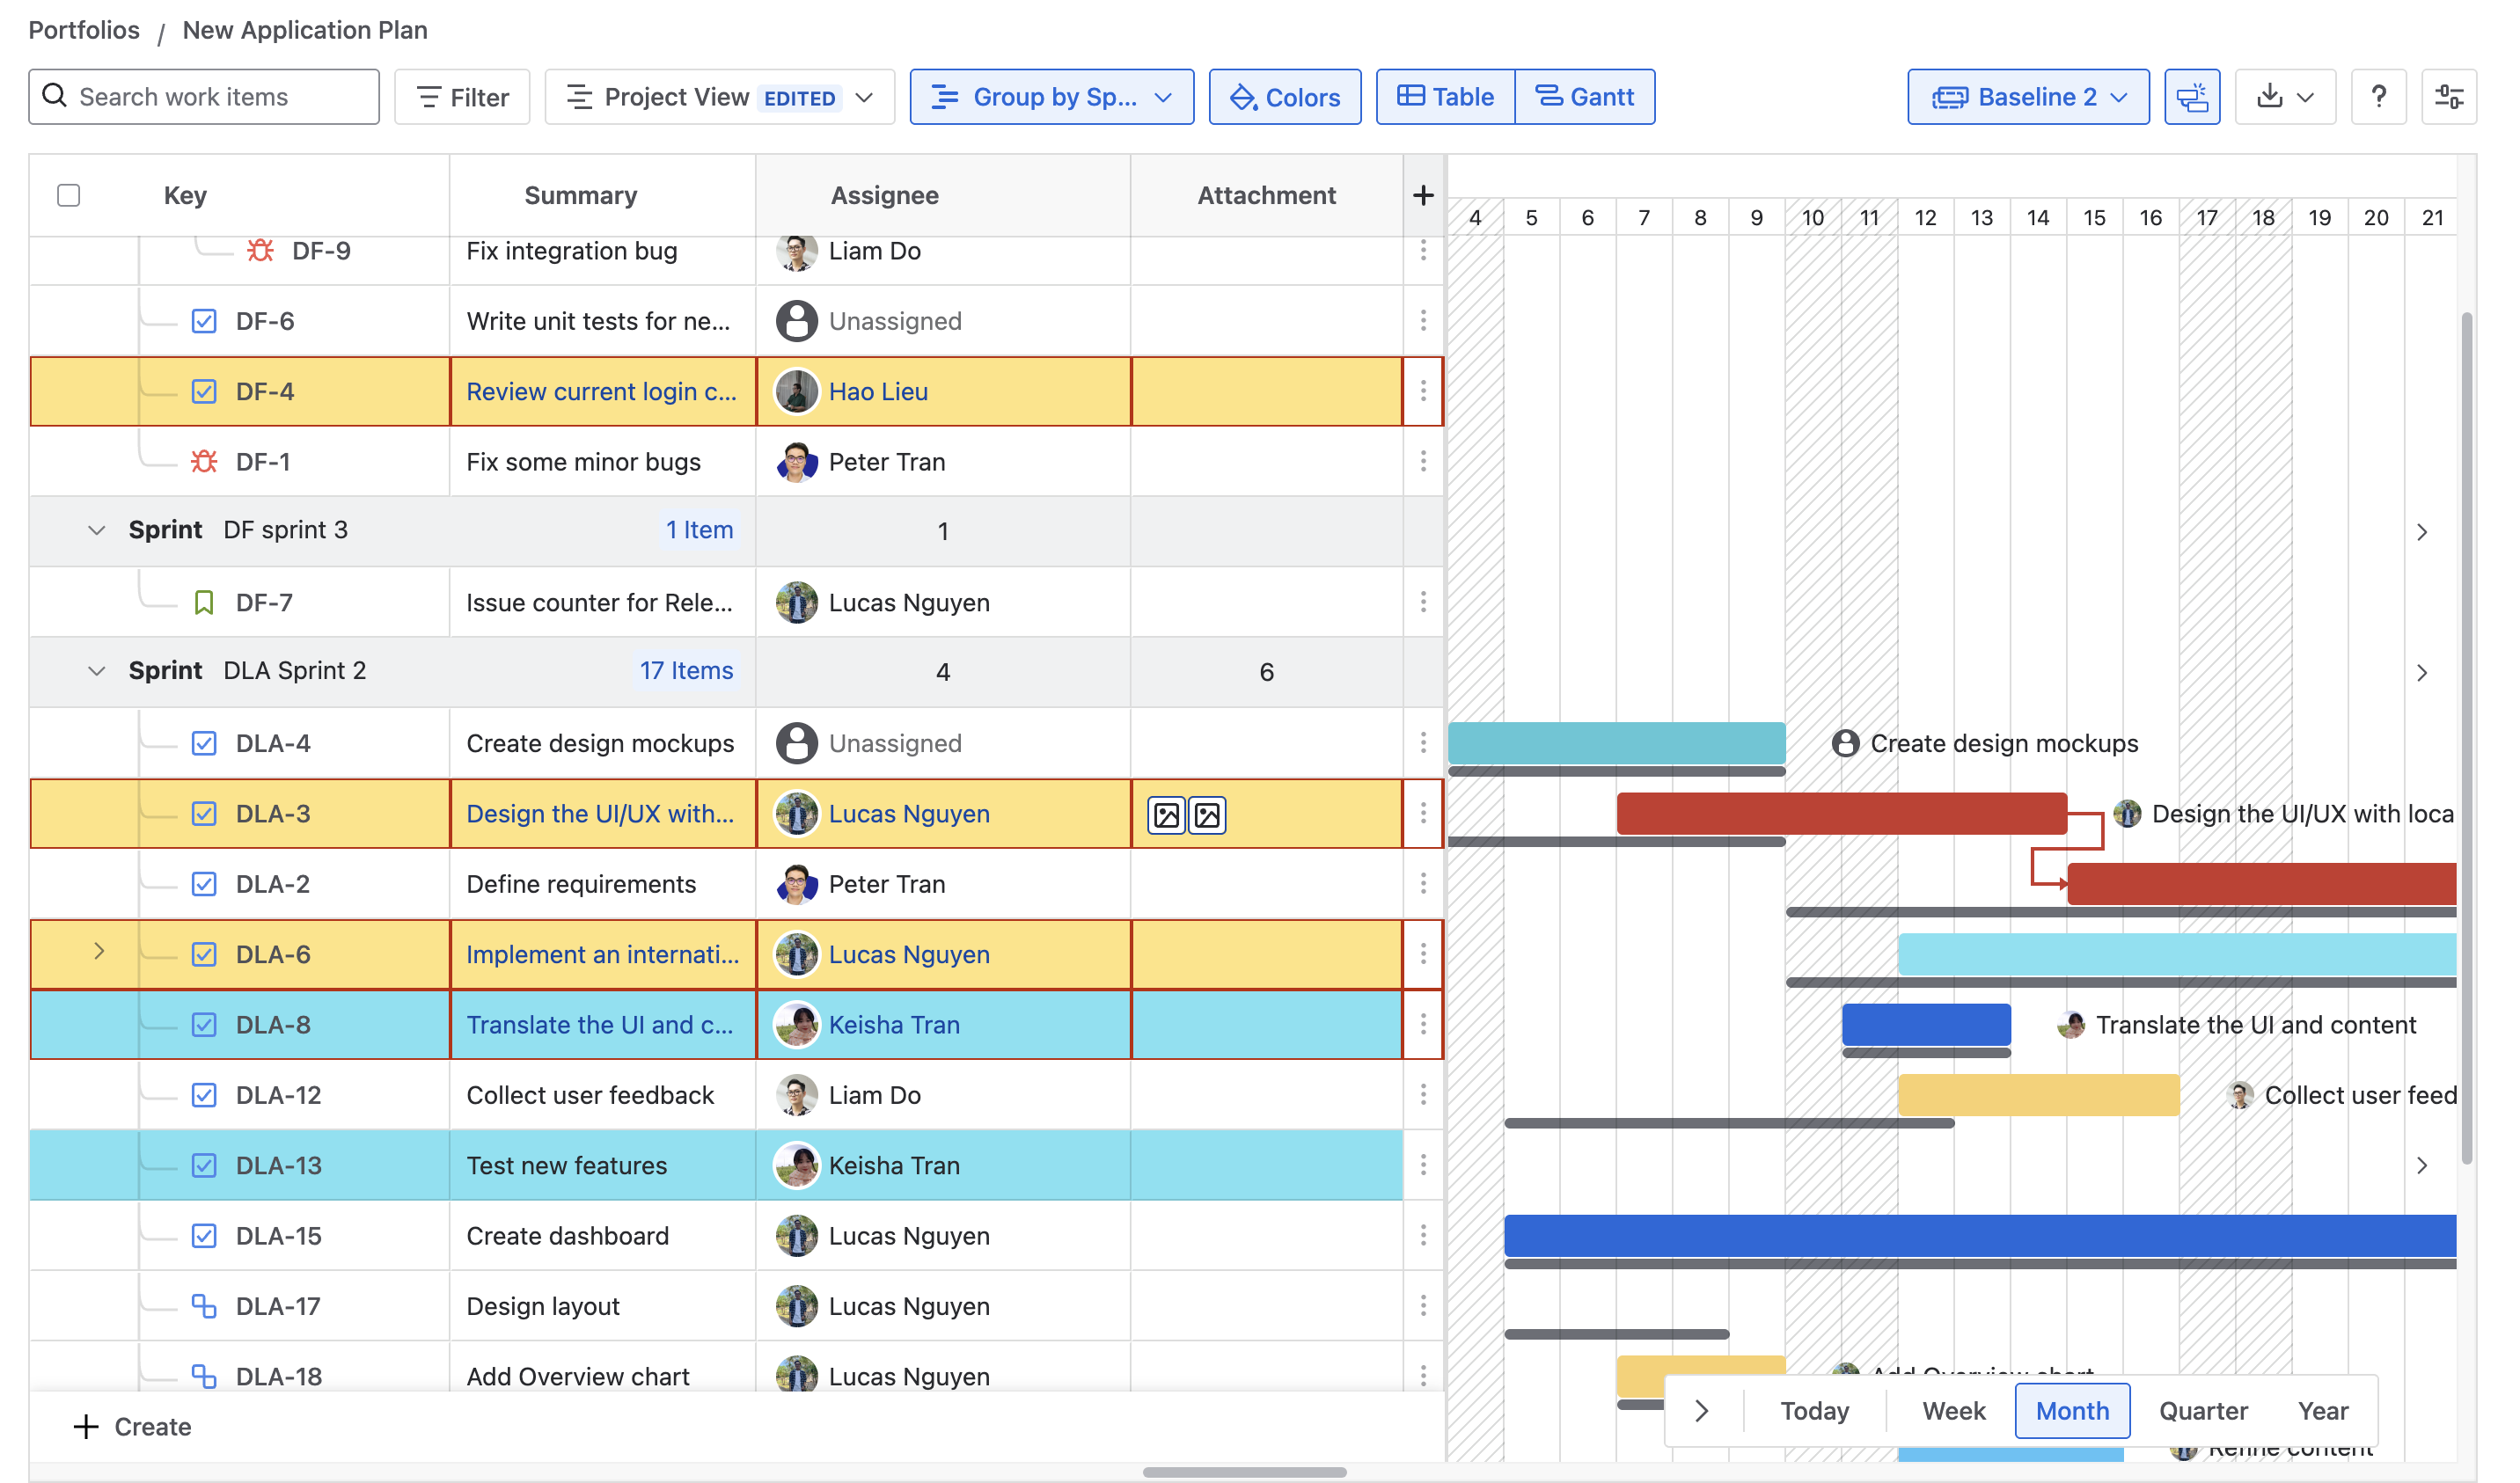
There is a preview of how color marking conditions are applied to the table view.
To add another color to the table, click + Create New rule for the Color condition.
However, keep in mind that all condition rules will have priority in ascending order. In other words, the newest color condition on the list will be prioritized to avoid overlapping.
You can freely change the order of these color conditions by clicking Move rule up or down to increase or decrease its priority.
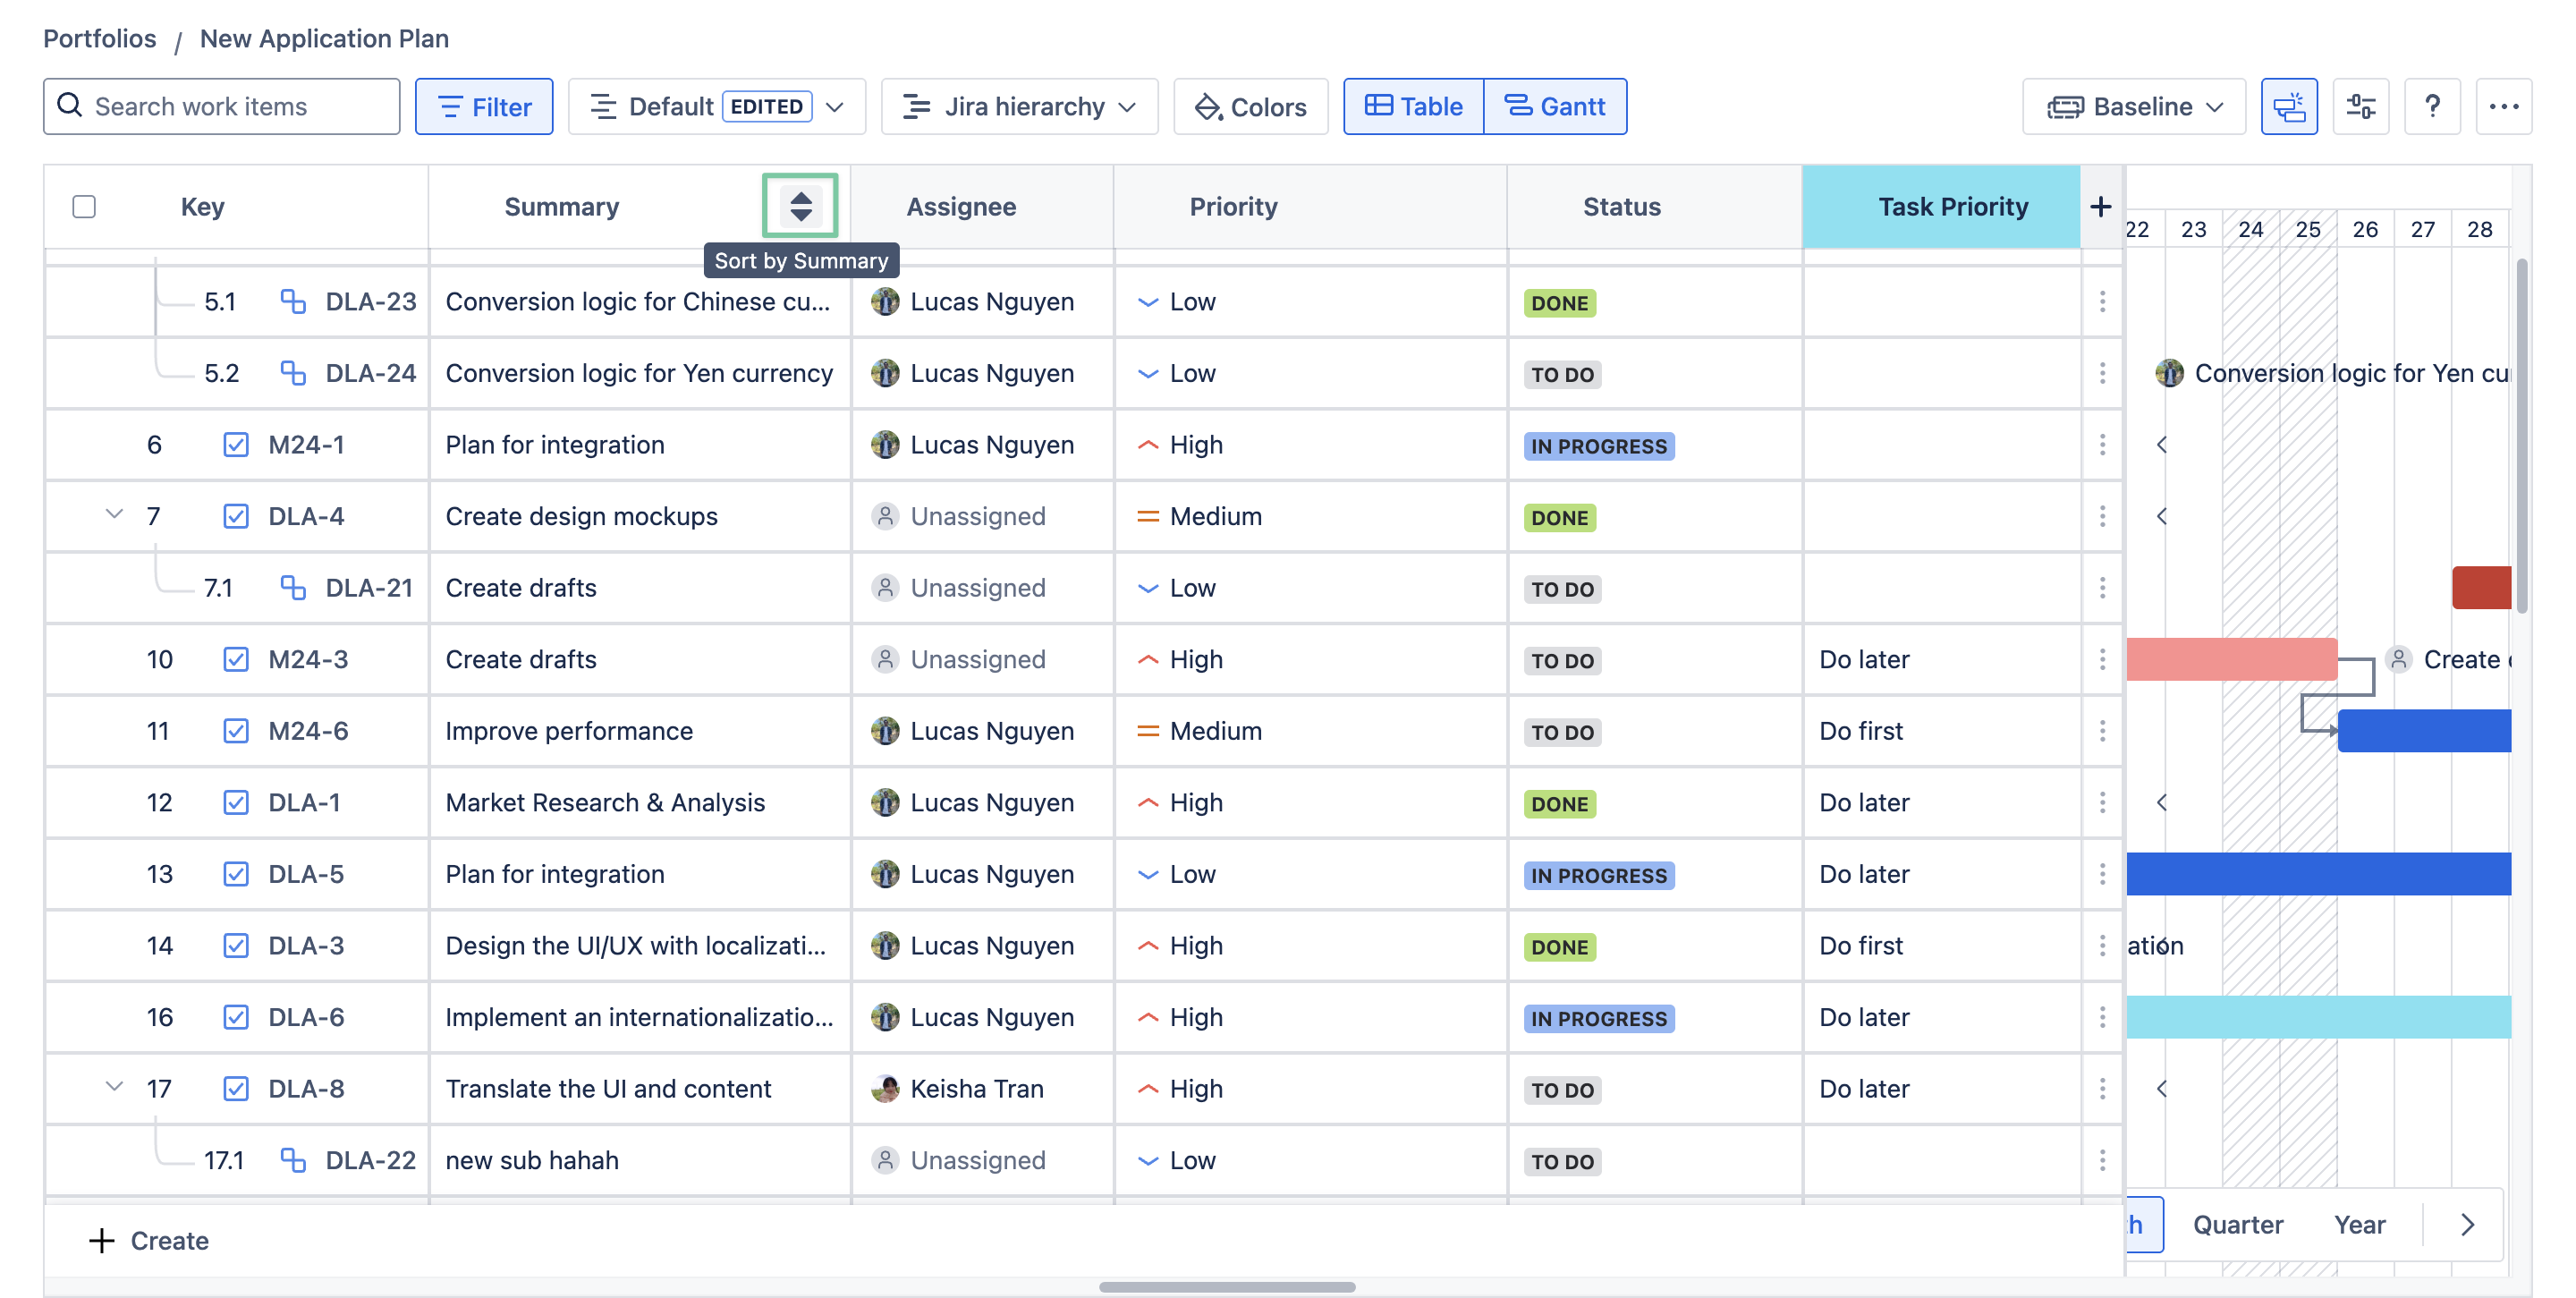
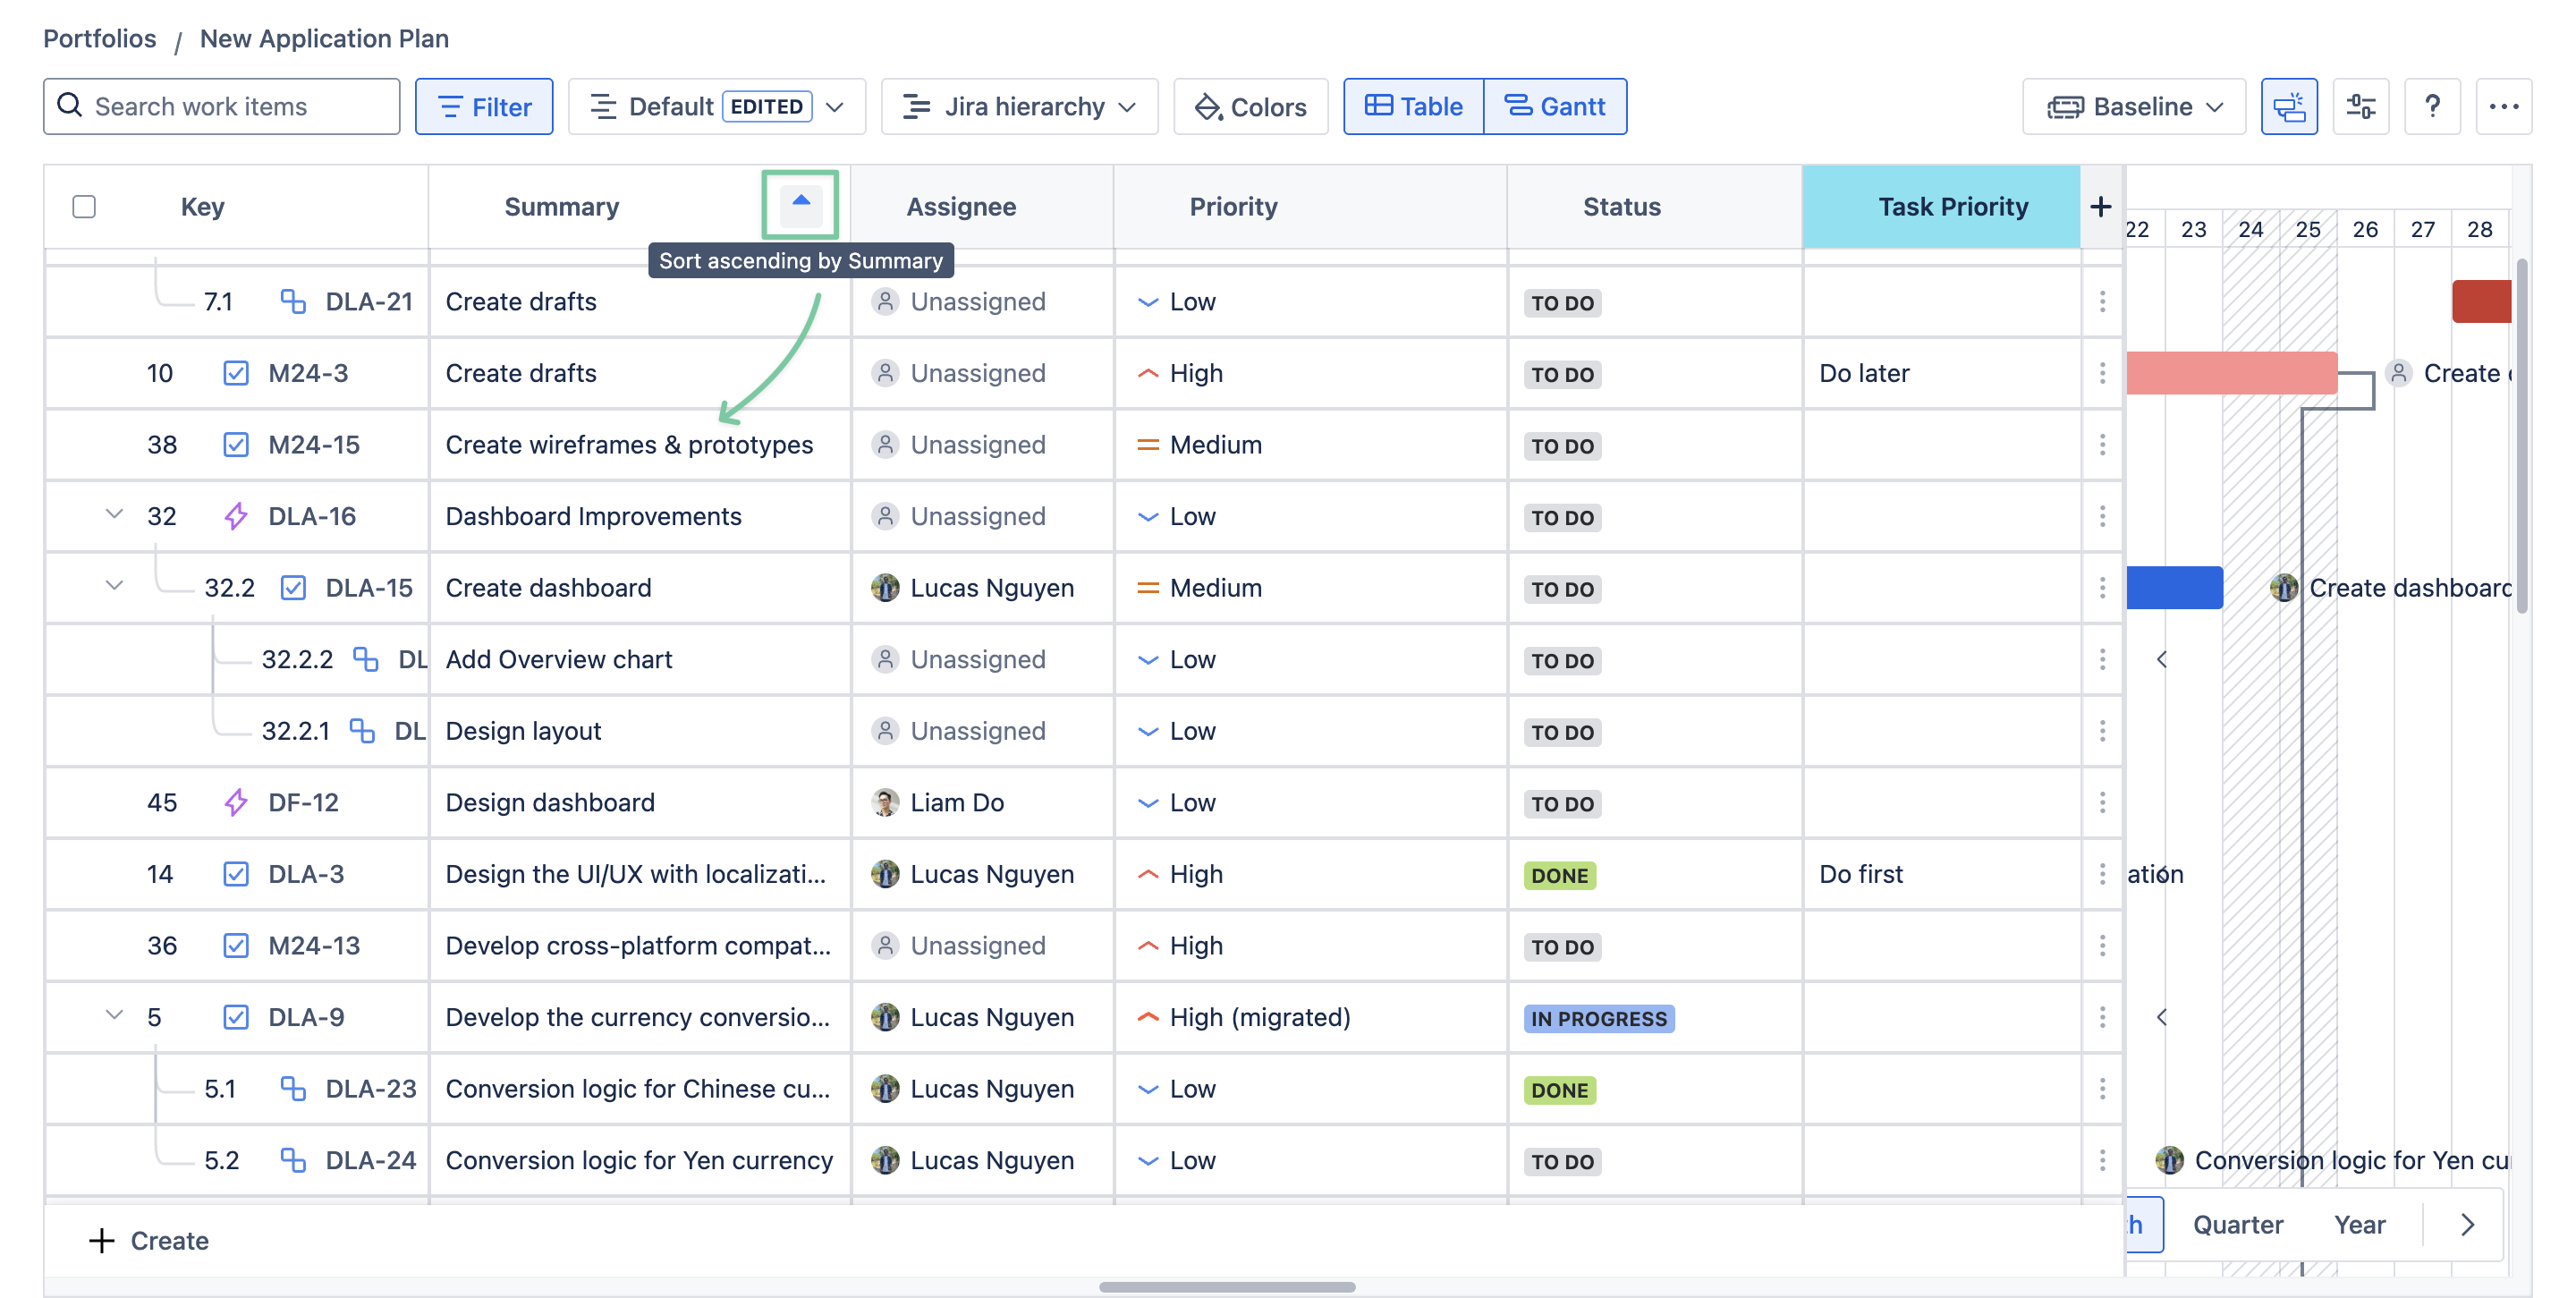
Sorting
Use the Sort feature to arrange Jira issues in the table by a chosen column in ascending or descending order.
Copy & Paste
You can quickly edit the GanttTable’s data by using the copy-and-paste feature, just like Excel or Google Spreadsheet.
To do that, simply right-click on the cell you want and choose copy cell, then paste the value.
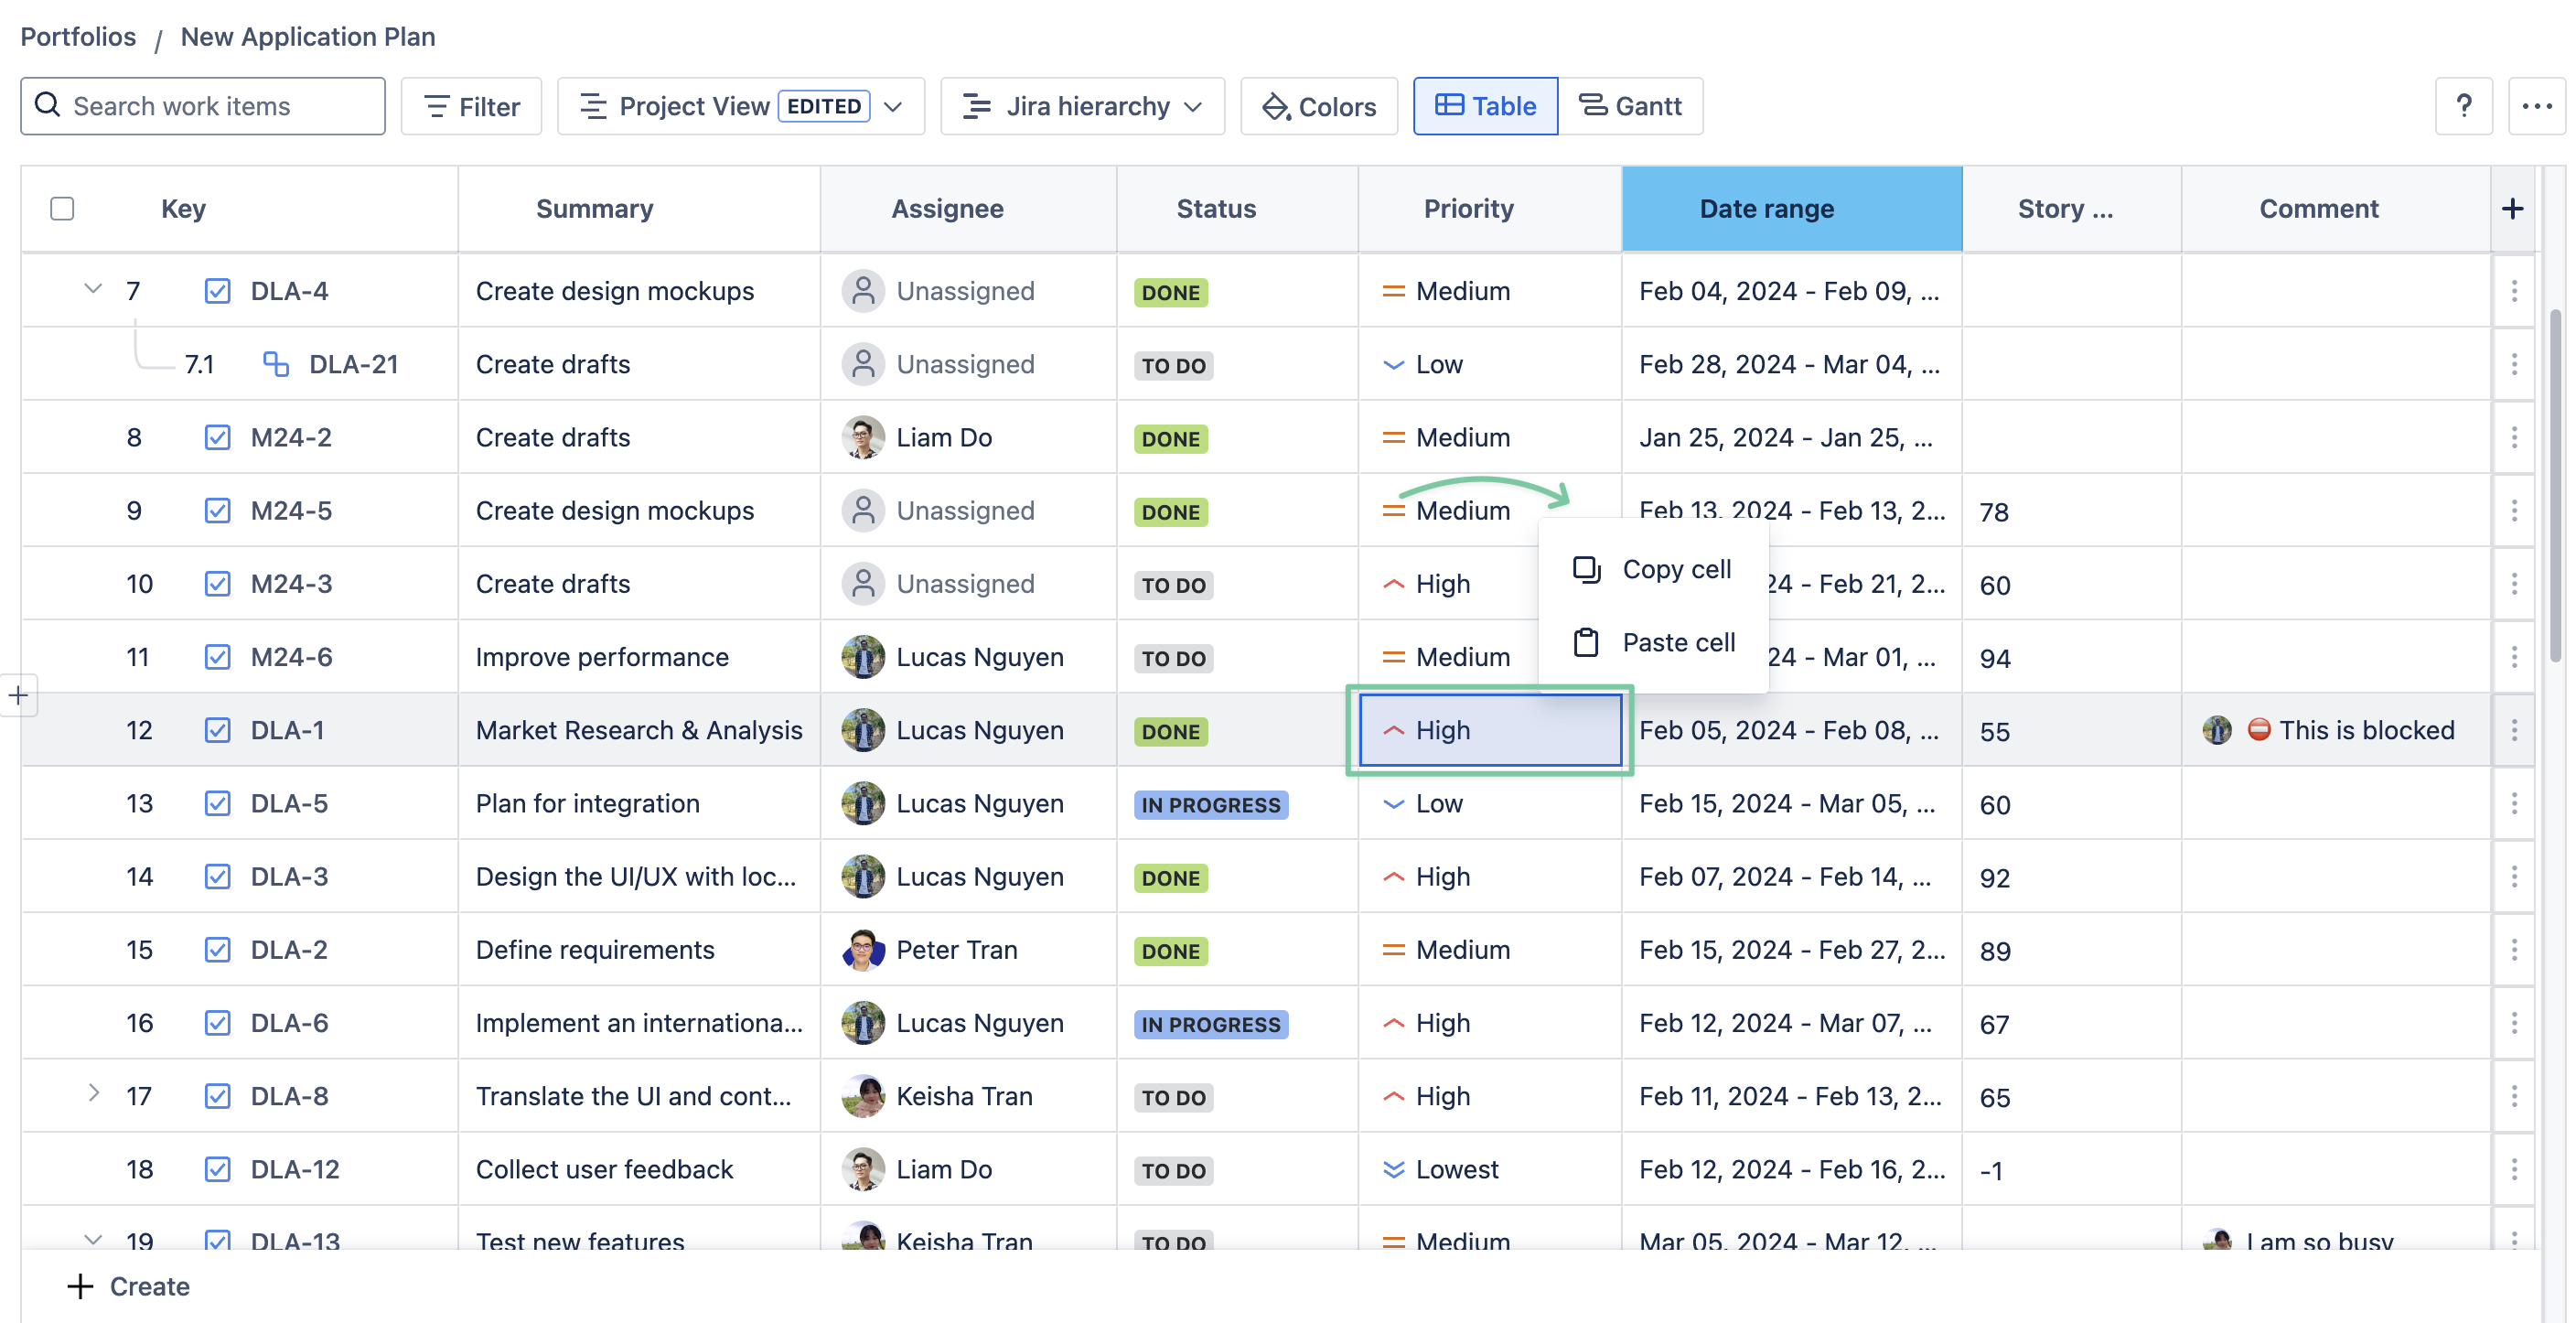
GanttTable also supports selecting multiple cells to make bulk editing data inline easier. You can click and drag over the cells you want to paste the value to.
Or, you can use the supported keyboard shortcuts below.
Keyboard commands
GanttTable supports all common keyboard shortcuts on both macOS and Windows to help users perform actions in the app quickly.
|
Keyboard commands |
Windows |
Mac |
|
|---|---|---|---|
|
1 |
Create a new portfolio |
|
|
|
2 |
Navigate between cells |
⬆️, ⬇️, ⬅️, ➡️, |
|
|
3 |
Select multiple cells |
|
|
|
4 |
Enter cell edit |
(Select a cell and press Enter to edit) |
(Select a cell and press return to edit) |
|
5 |
Cancel cell edit |
|
|
|
6 |
Create an issue below |
|
|
|
7 |
Create an issue above |
|
|
|
8 |
Open issue details |
|
|
|
9 |
Duplicate issue |
|
|
|
10 |
Delete issue |
|
|
|
11 |
Copy cell |
|
|
|
12 |
Paste cell |
|
|
|
13 |
Enable Table mode |
|
|
|
14 |
Enable Gantt mode |
|
|
|
15 |
Enable Critical Path |
|
|
|
16 |
Toggle issue search bar |
|
|
|
17 |
Open View dialog |
|
|
|
18 |
Save current view |
|
|
|
19 |
Save current view as new |
|
|
|
20 |
Reset view |
|
|
|
21 |
Open Structure dialog |
|
|
|
22 |
Open Filter Dialog |
|
|
|
23 |
Open Baseline dialog |
|
|
|
24 |
Open Color Dialog |
|
|
|
25 |
Open Export dialog |
|
|
|
26 |
Export as image |
|
|
|
27 |
Export as Excel |
|
|
|
28 |
Export as CSV |
|
|
|
29 |
Open Settings dialog |
|
|
|
30 |
Open Board Settings |
|
|
|
31 |
Open Help Menu |
|
|
You can view these keyboard shortcuts directly in GanttTable from the Help section.
Comments
GanttTable supports an integrated comment section for each Jira work item, allowing users to quickly view and delete comments directly.
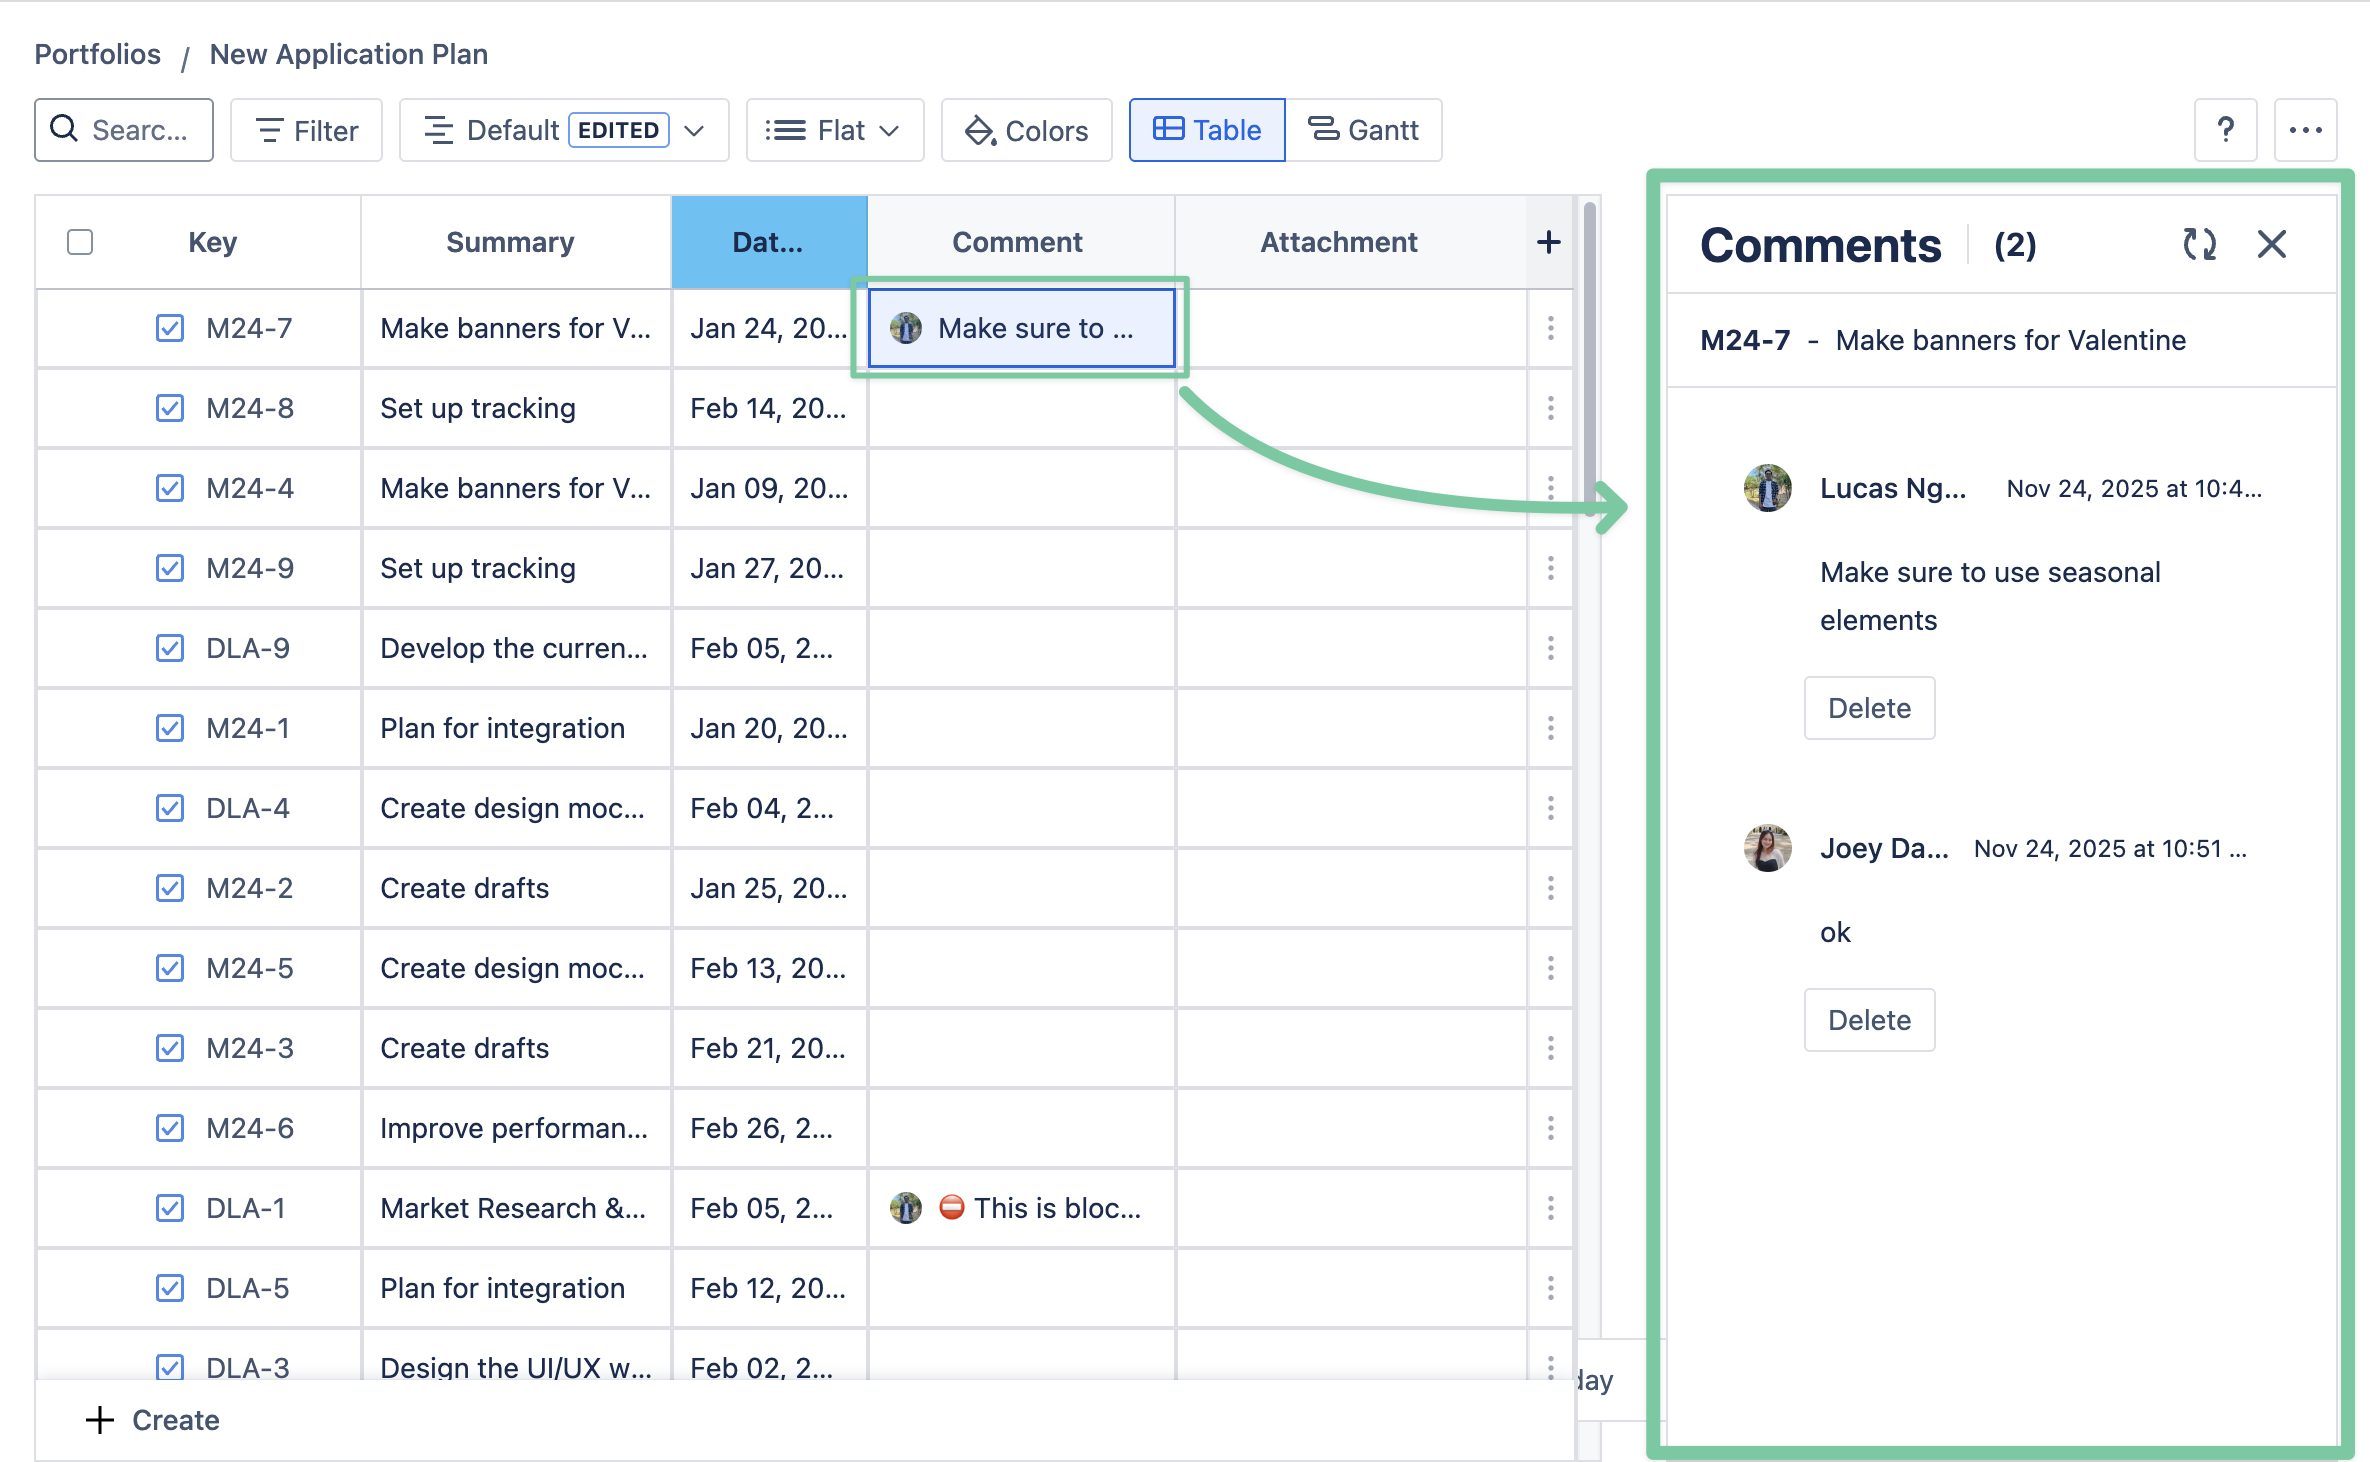
To open the Comment section in GanttTable, click on the comment column of a specific Jira work item.
To add new comments, users have to open the Jira work item details and add comments manually.
Attachments
Besides visualizing the attachment column in the table view, users can add or remove attachments like files, images, or videos directly within GanttTable.
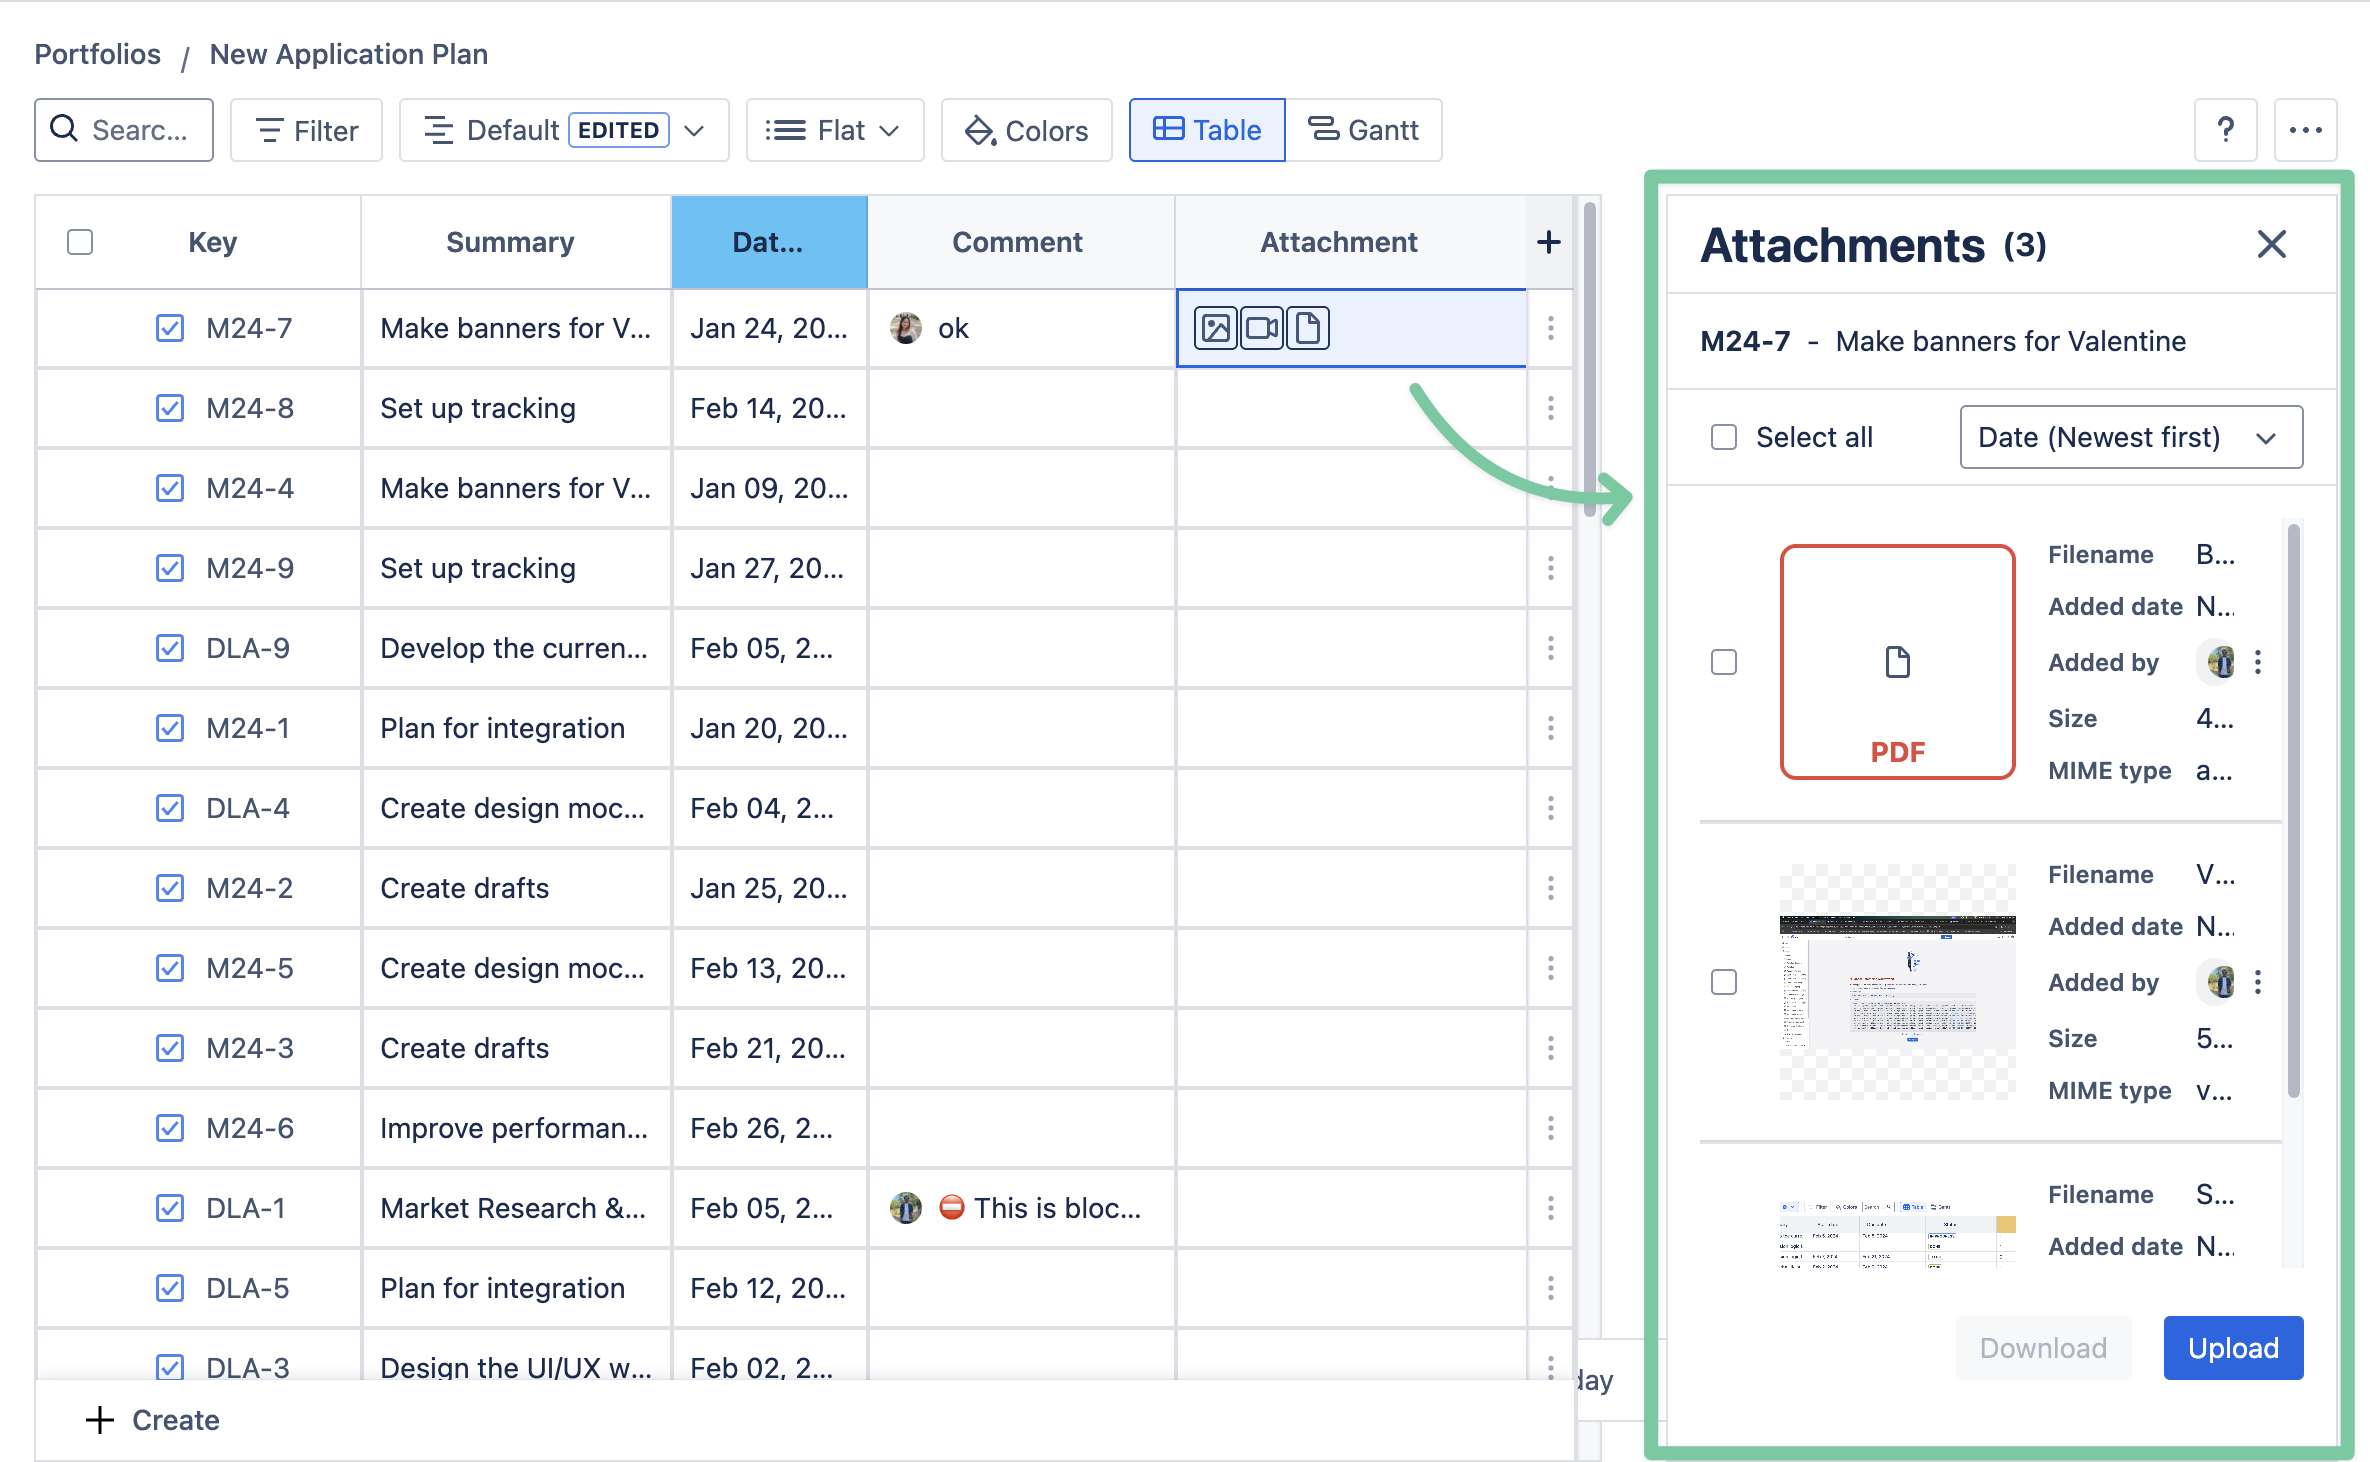
To add files to Attachments, click Upload and choose files, or drag and drop files into this section.
Here, you can sort and arrange the order of files by:
-
Date (Newest first)
-
Date (Oldest first)
-
File name (A-Z)
-
File name (Z-A)

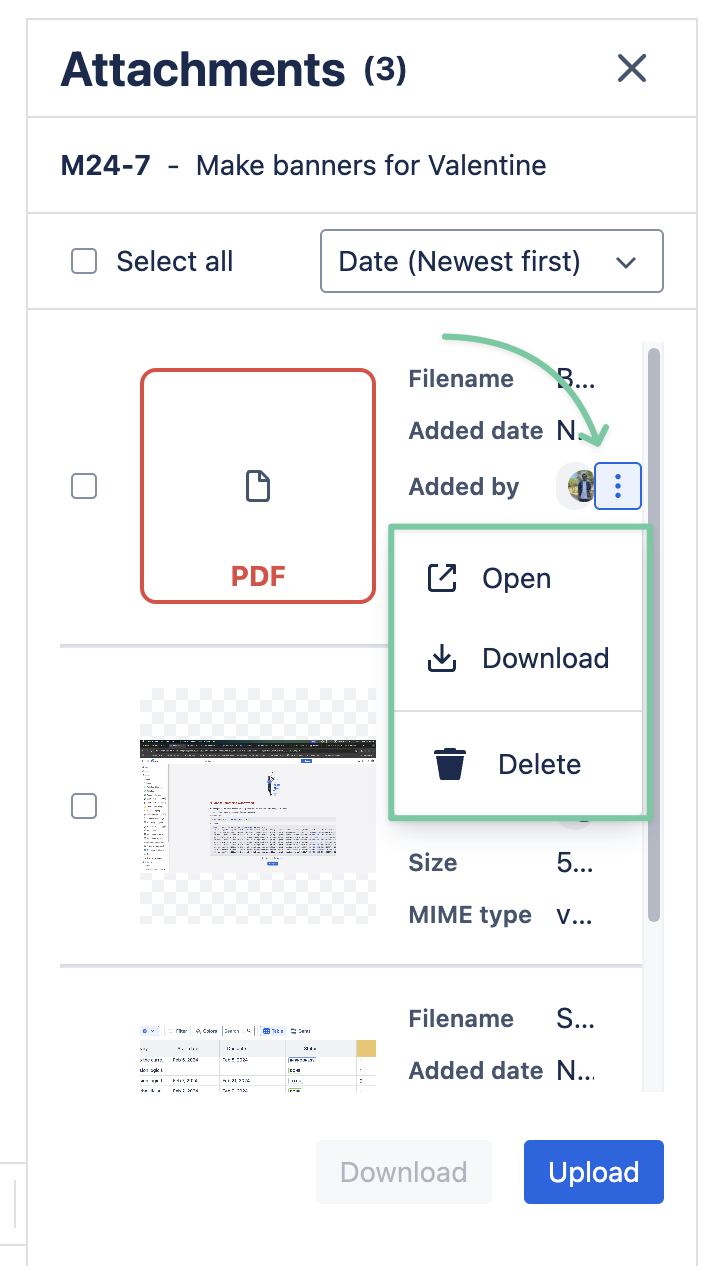
In the Attachments section, you can:
-
Open and view files (for PDF files, it will be downloaded automatically)
-
Download files
-
Delete files from Attachments
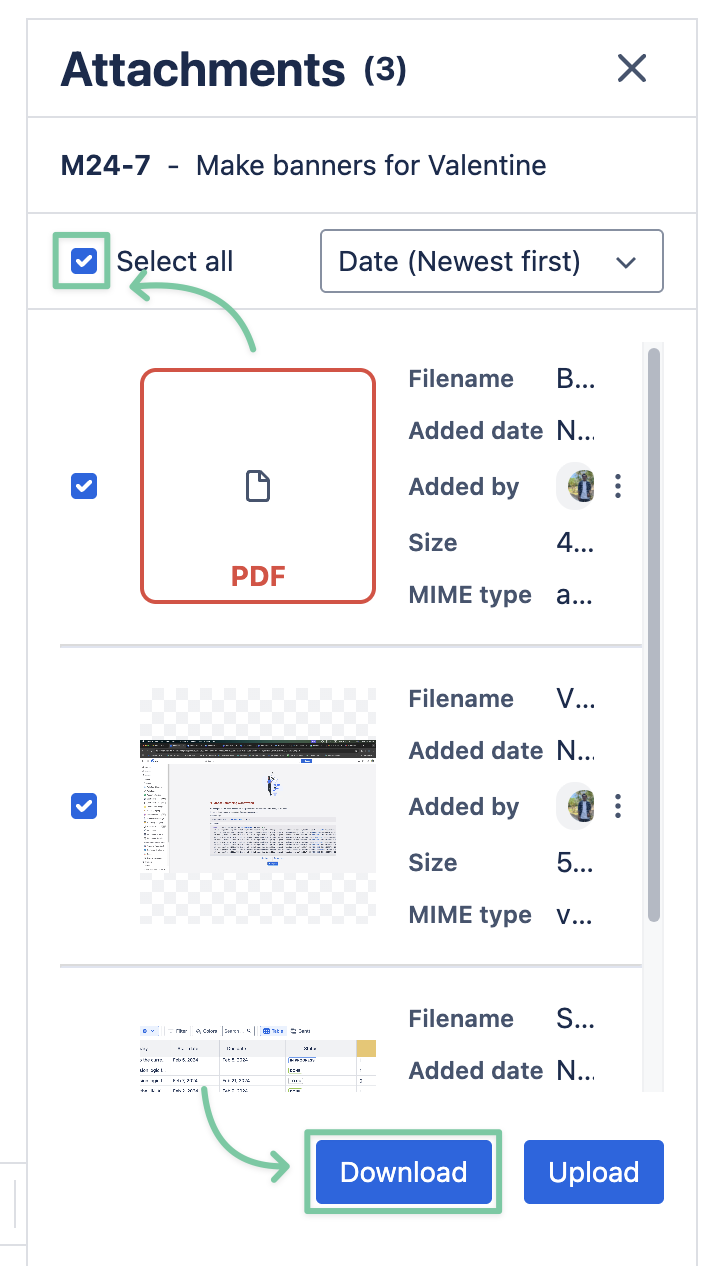
To download all files in bulk, choose Select all the files in the Attachments section and click Download.
View preferences
1. What is View in GanttTable?
View represents how the app visualizes your Jira issues and projects in the portfolio. Each different view tells a different story based on the settings, filters, and structure of the table.
Keep in mind that when creating a new view, it will have the same filters and settings as your currently selected view in GanttTable.
2. Manage Columns in GanttTable
You can add more (or remove) Jira fields and labels to GanttTable as columns and manage them in the Table.
Add columns to the table
By default, GanttTable generates a board using your Jira project’s work item keys and Summaries as data fields in the table. You can add more to your preferences.
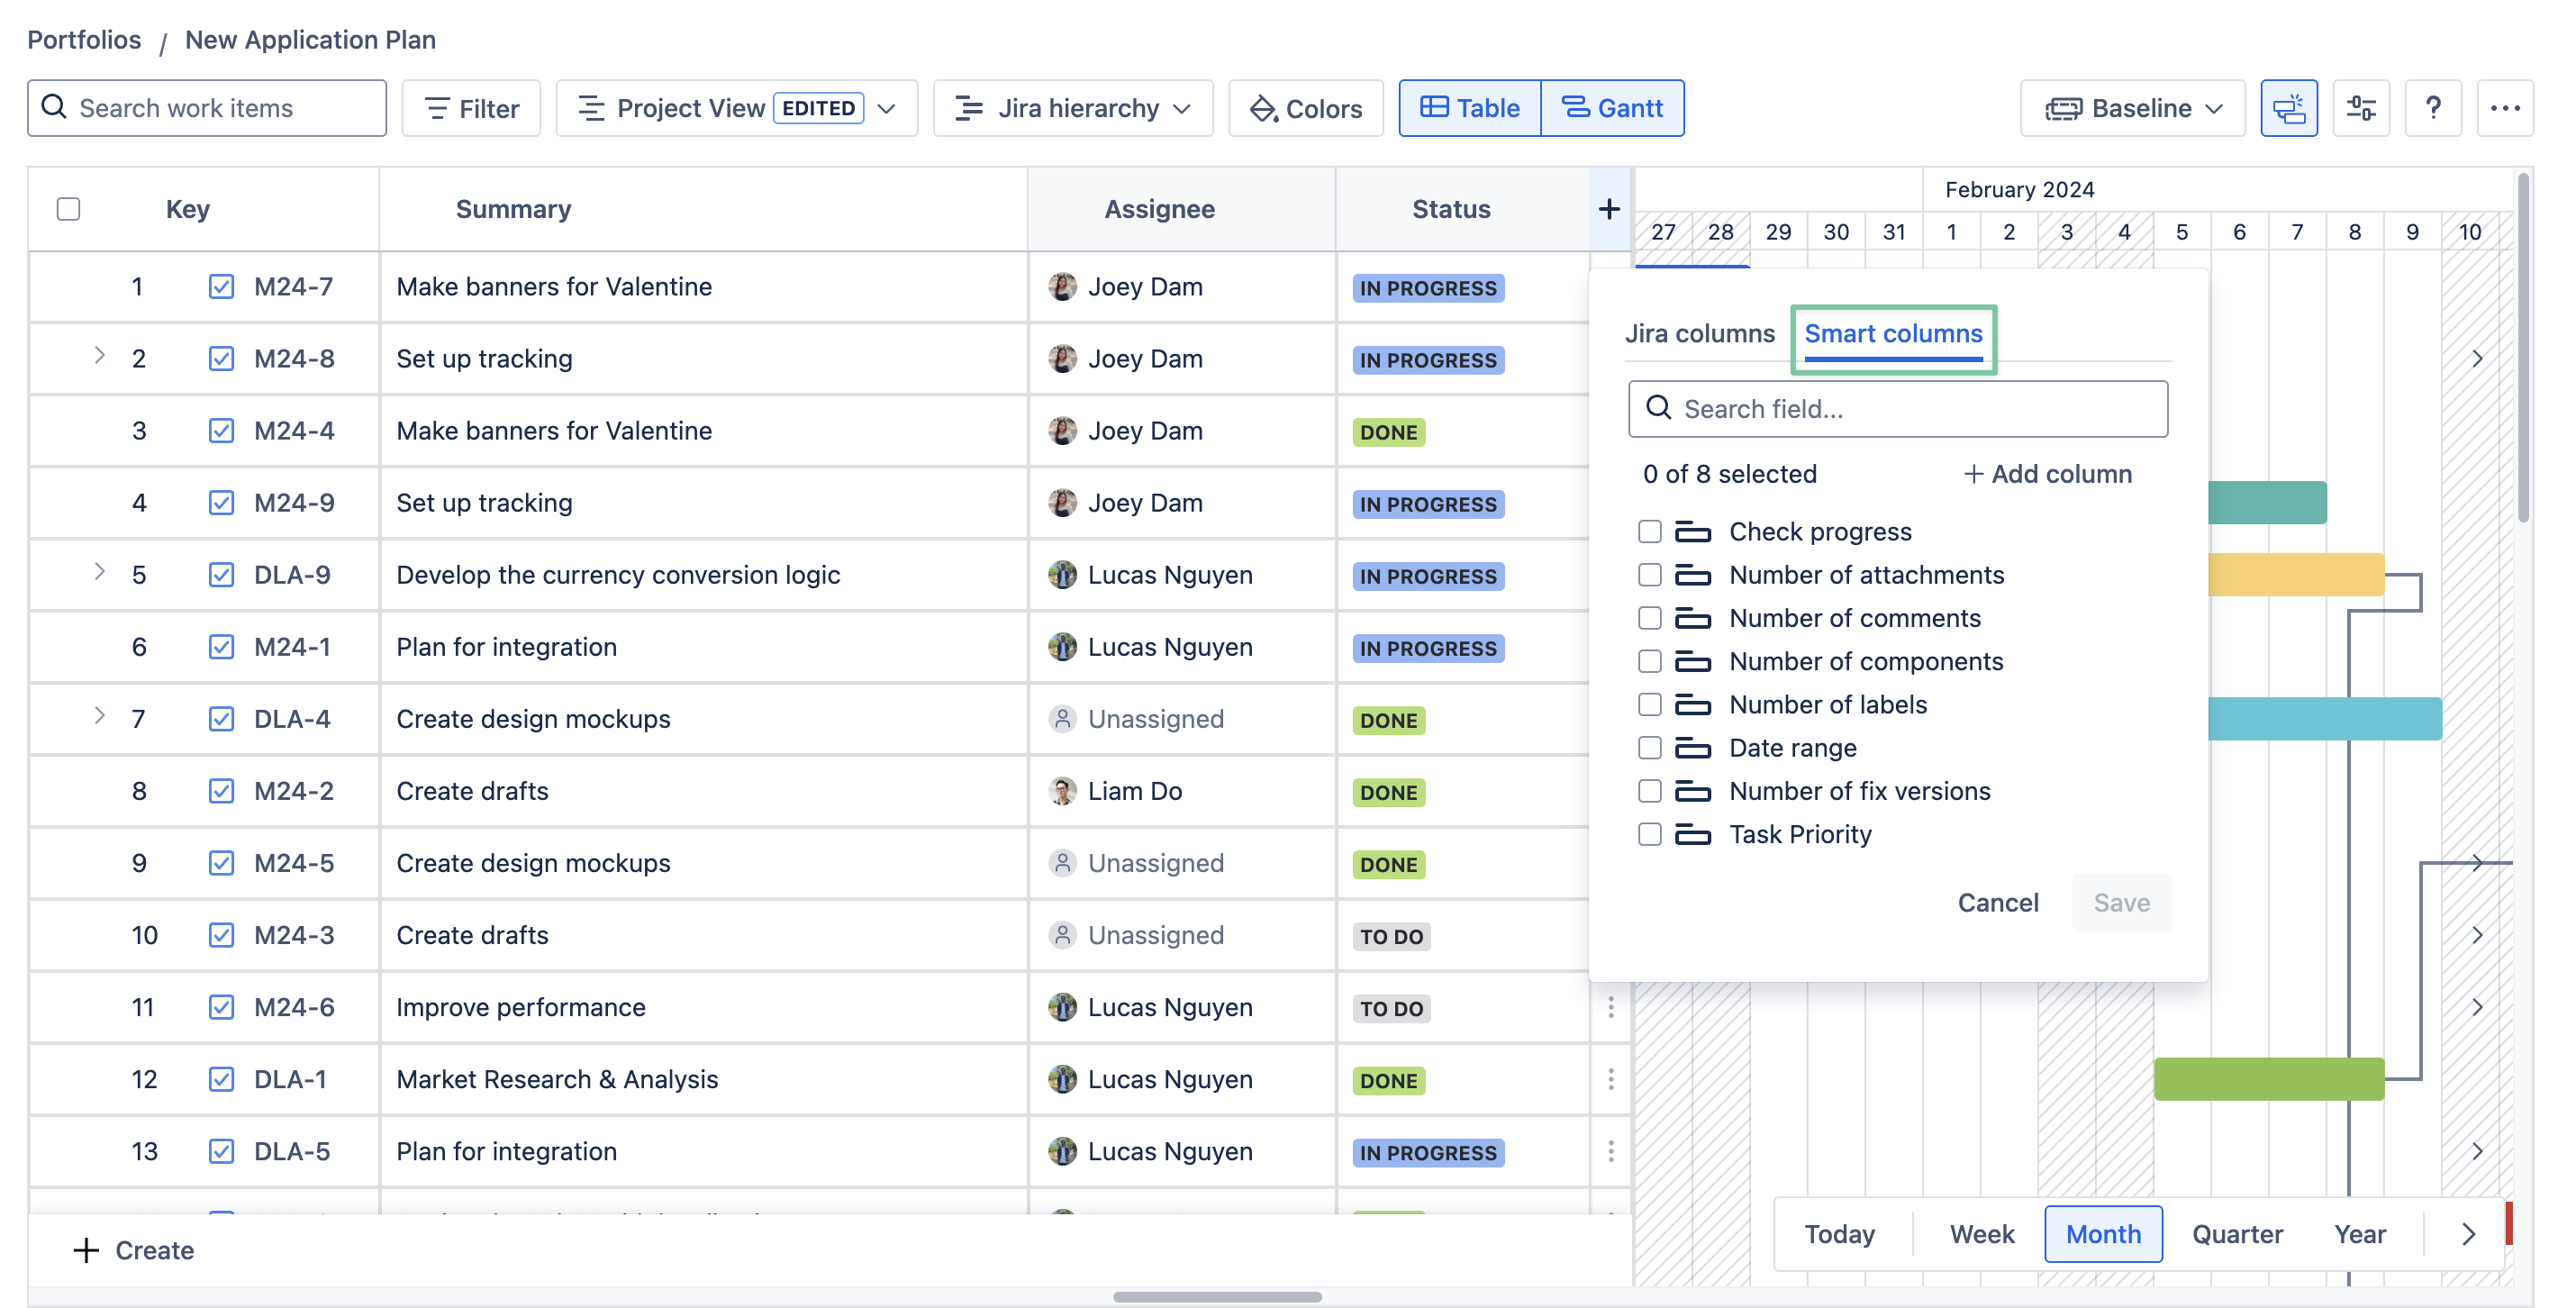
To add more data to the table as columns, click the ➕ button next to the column and search for the fields you want to add.
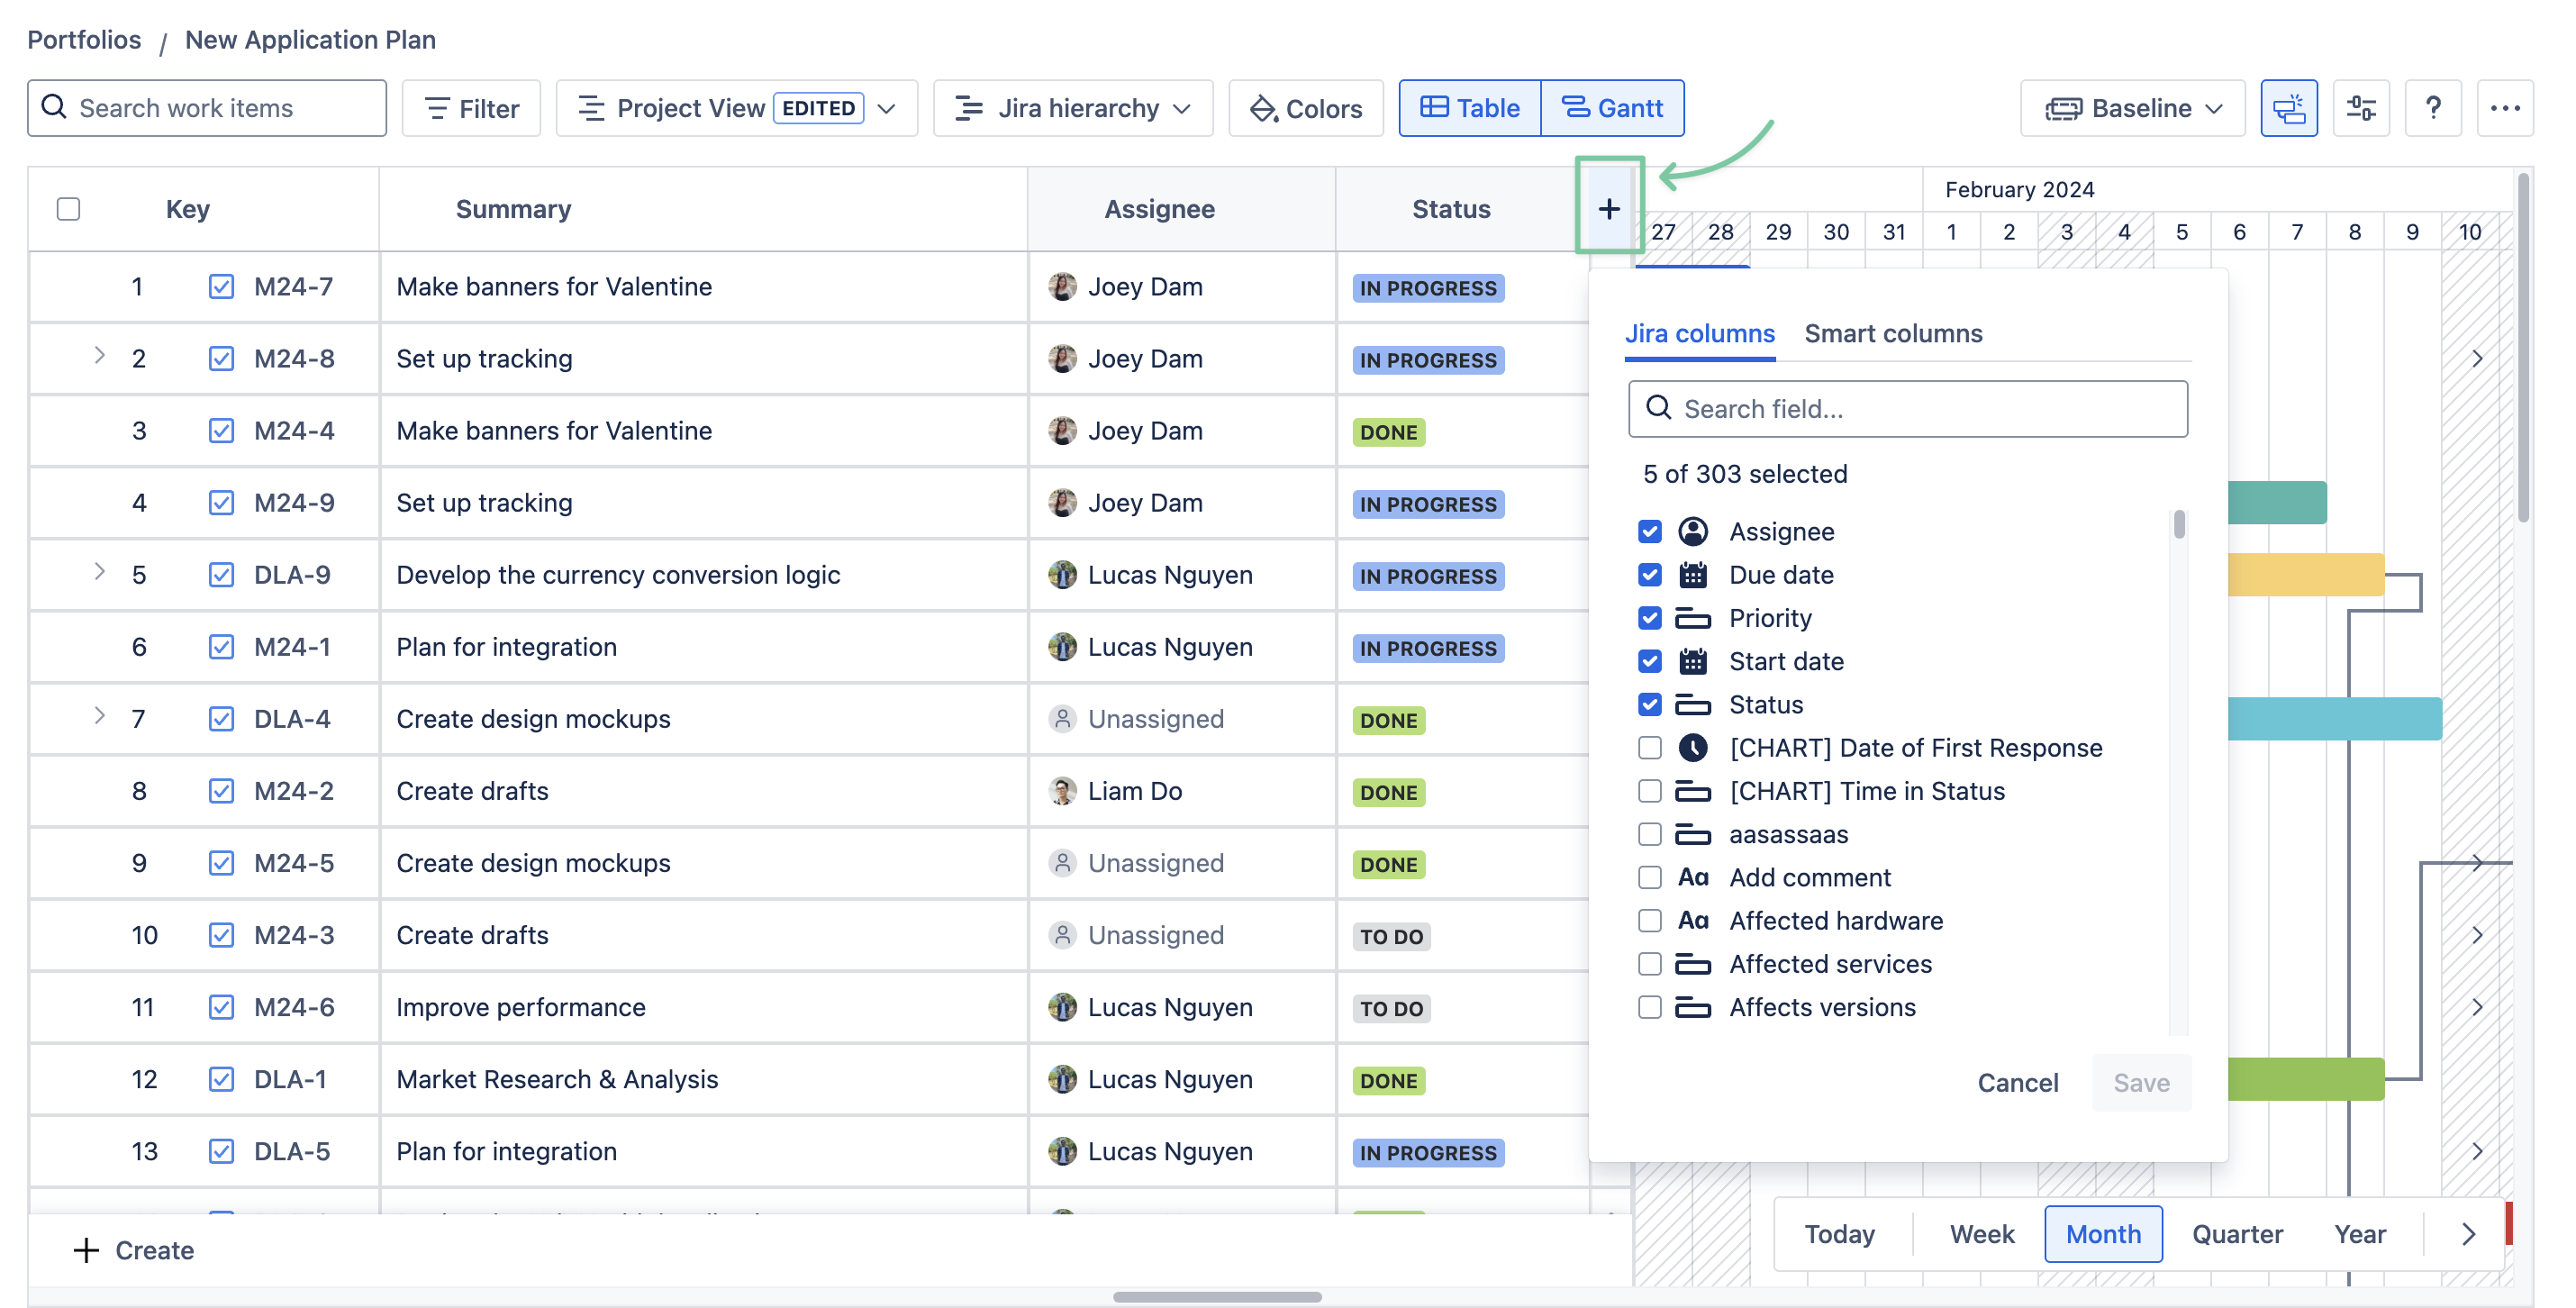
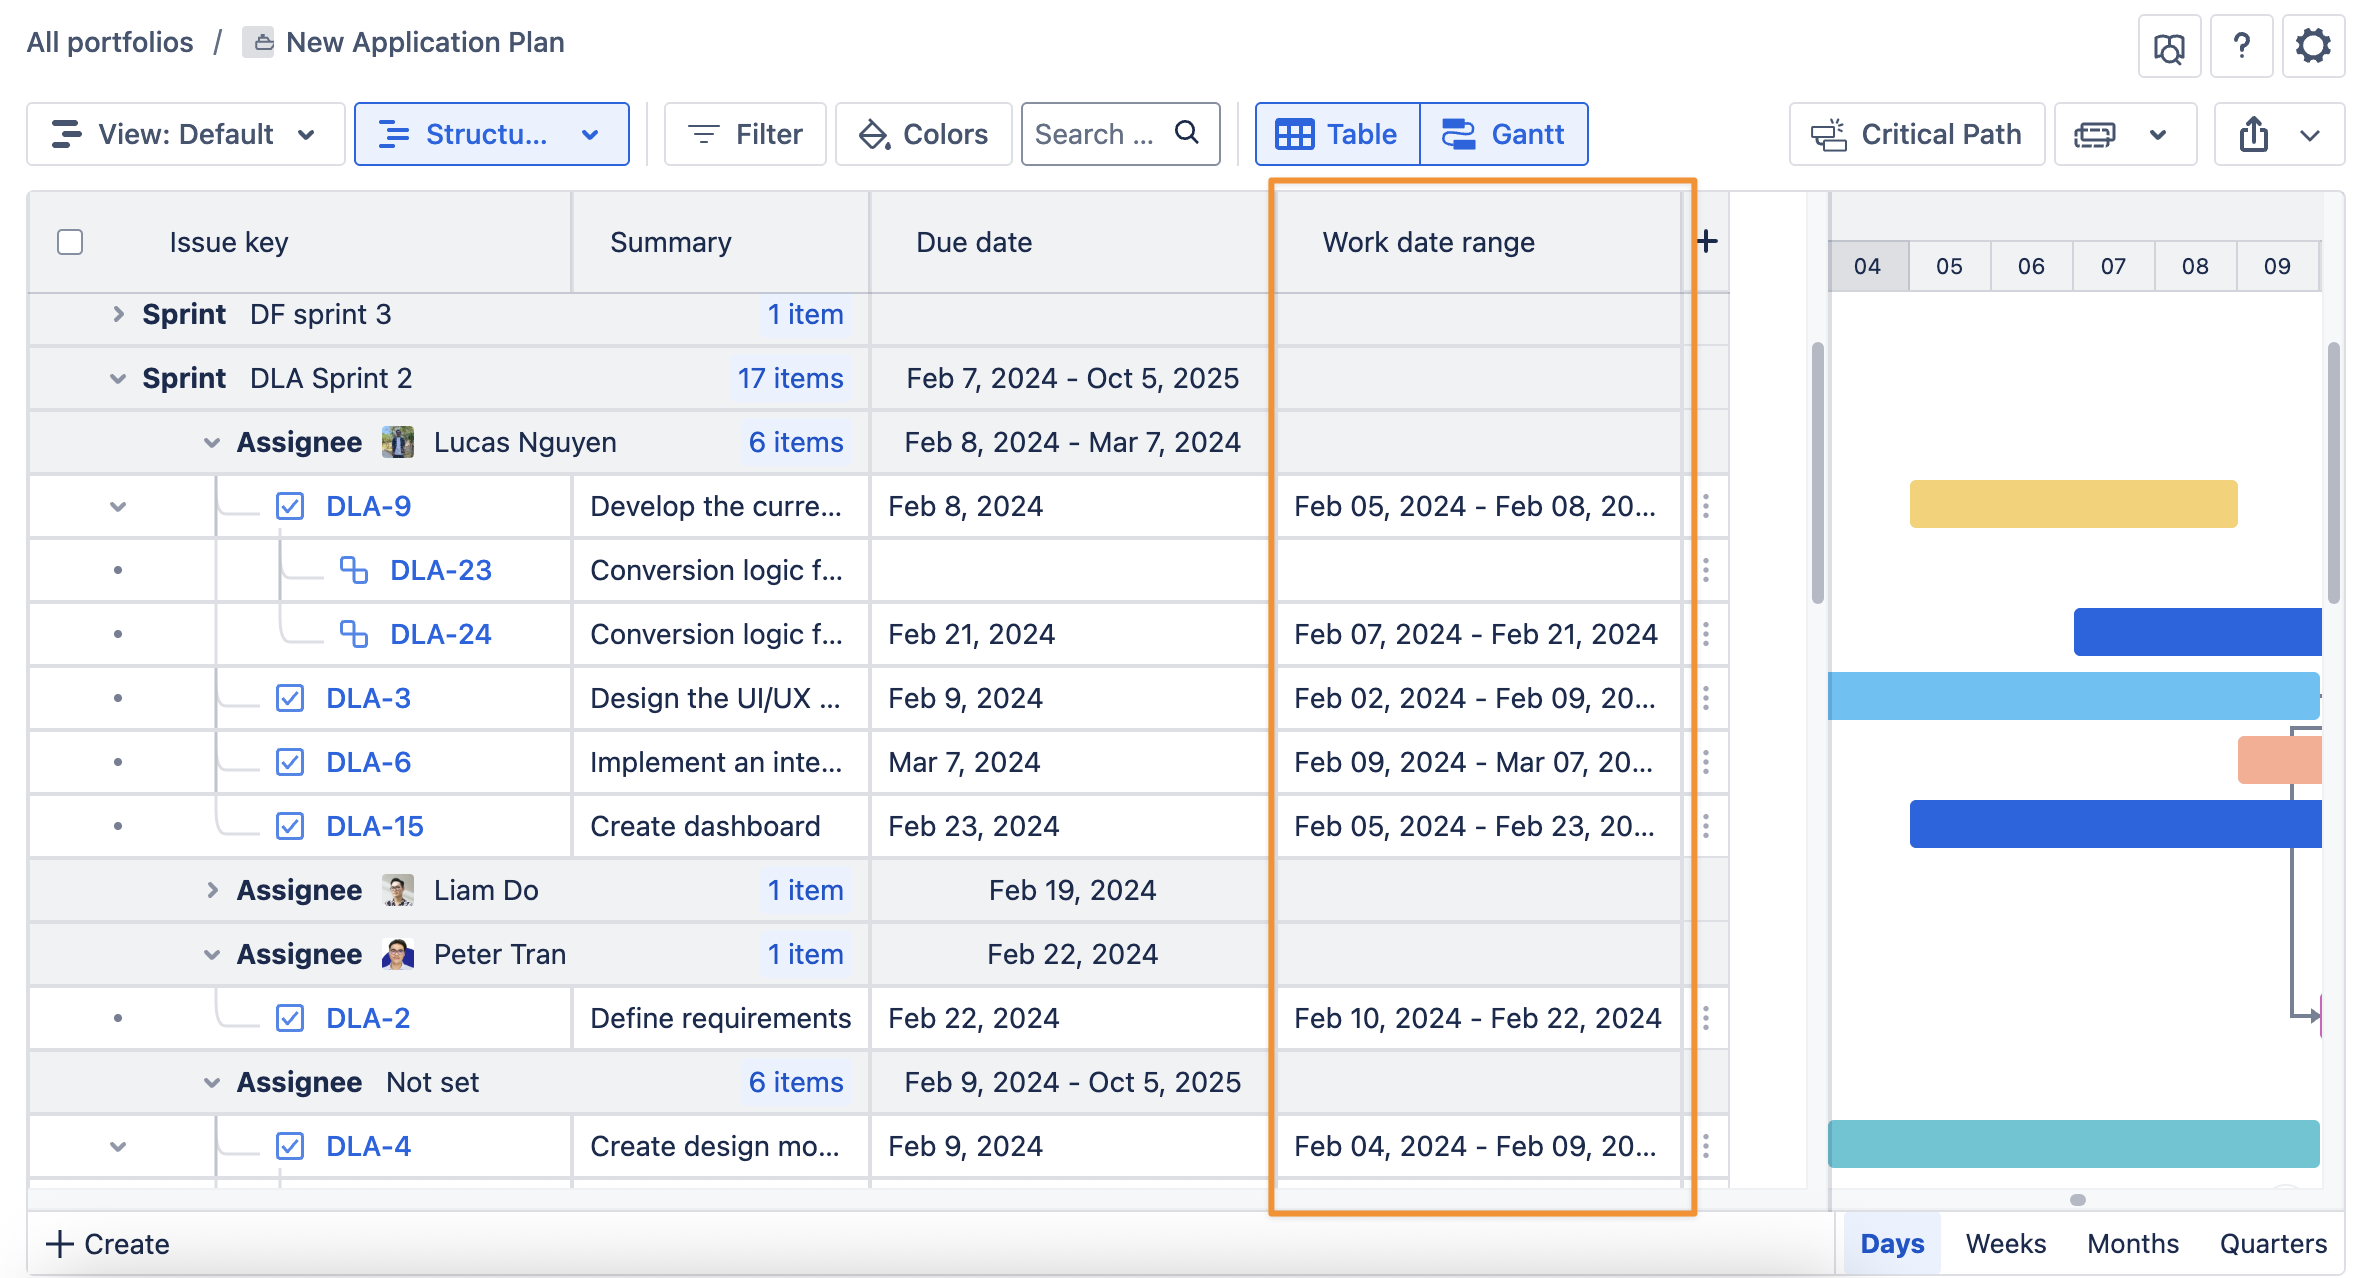
You can also add Smart columns to the table to show calculated information.
After choosing what data or fields you want to add to the table, click outside the menu to close it, and the table will automatically update to load the new columns.
There are certain fields (both Jira default and custom) that GanttTable can support. For more details, please visit Supported fields.
Remove columns
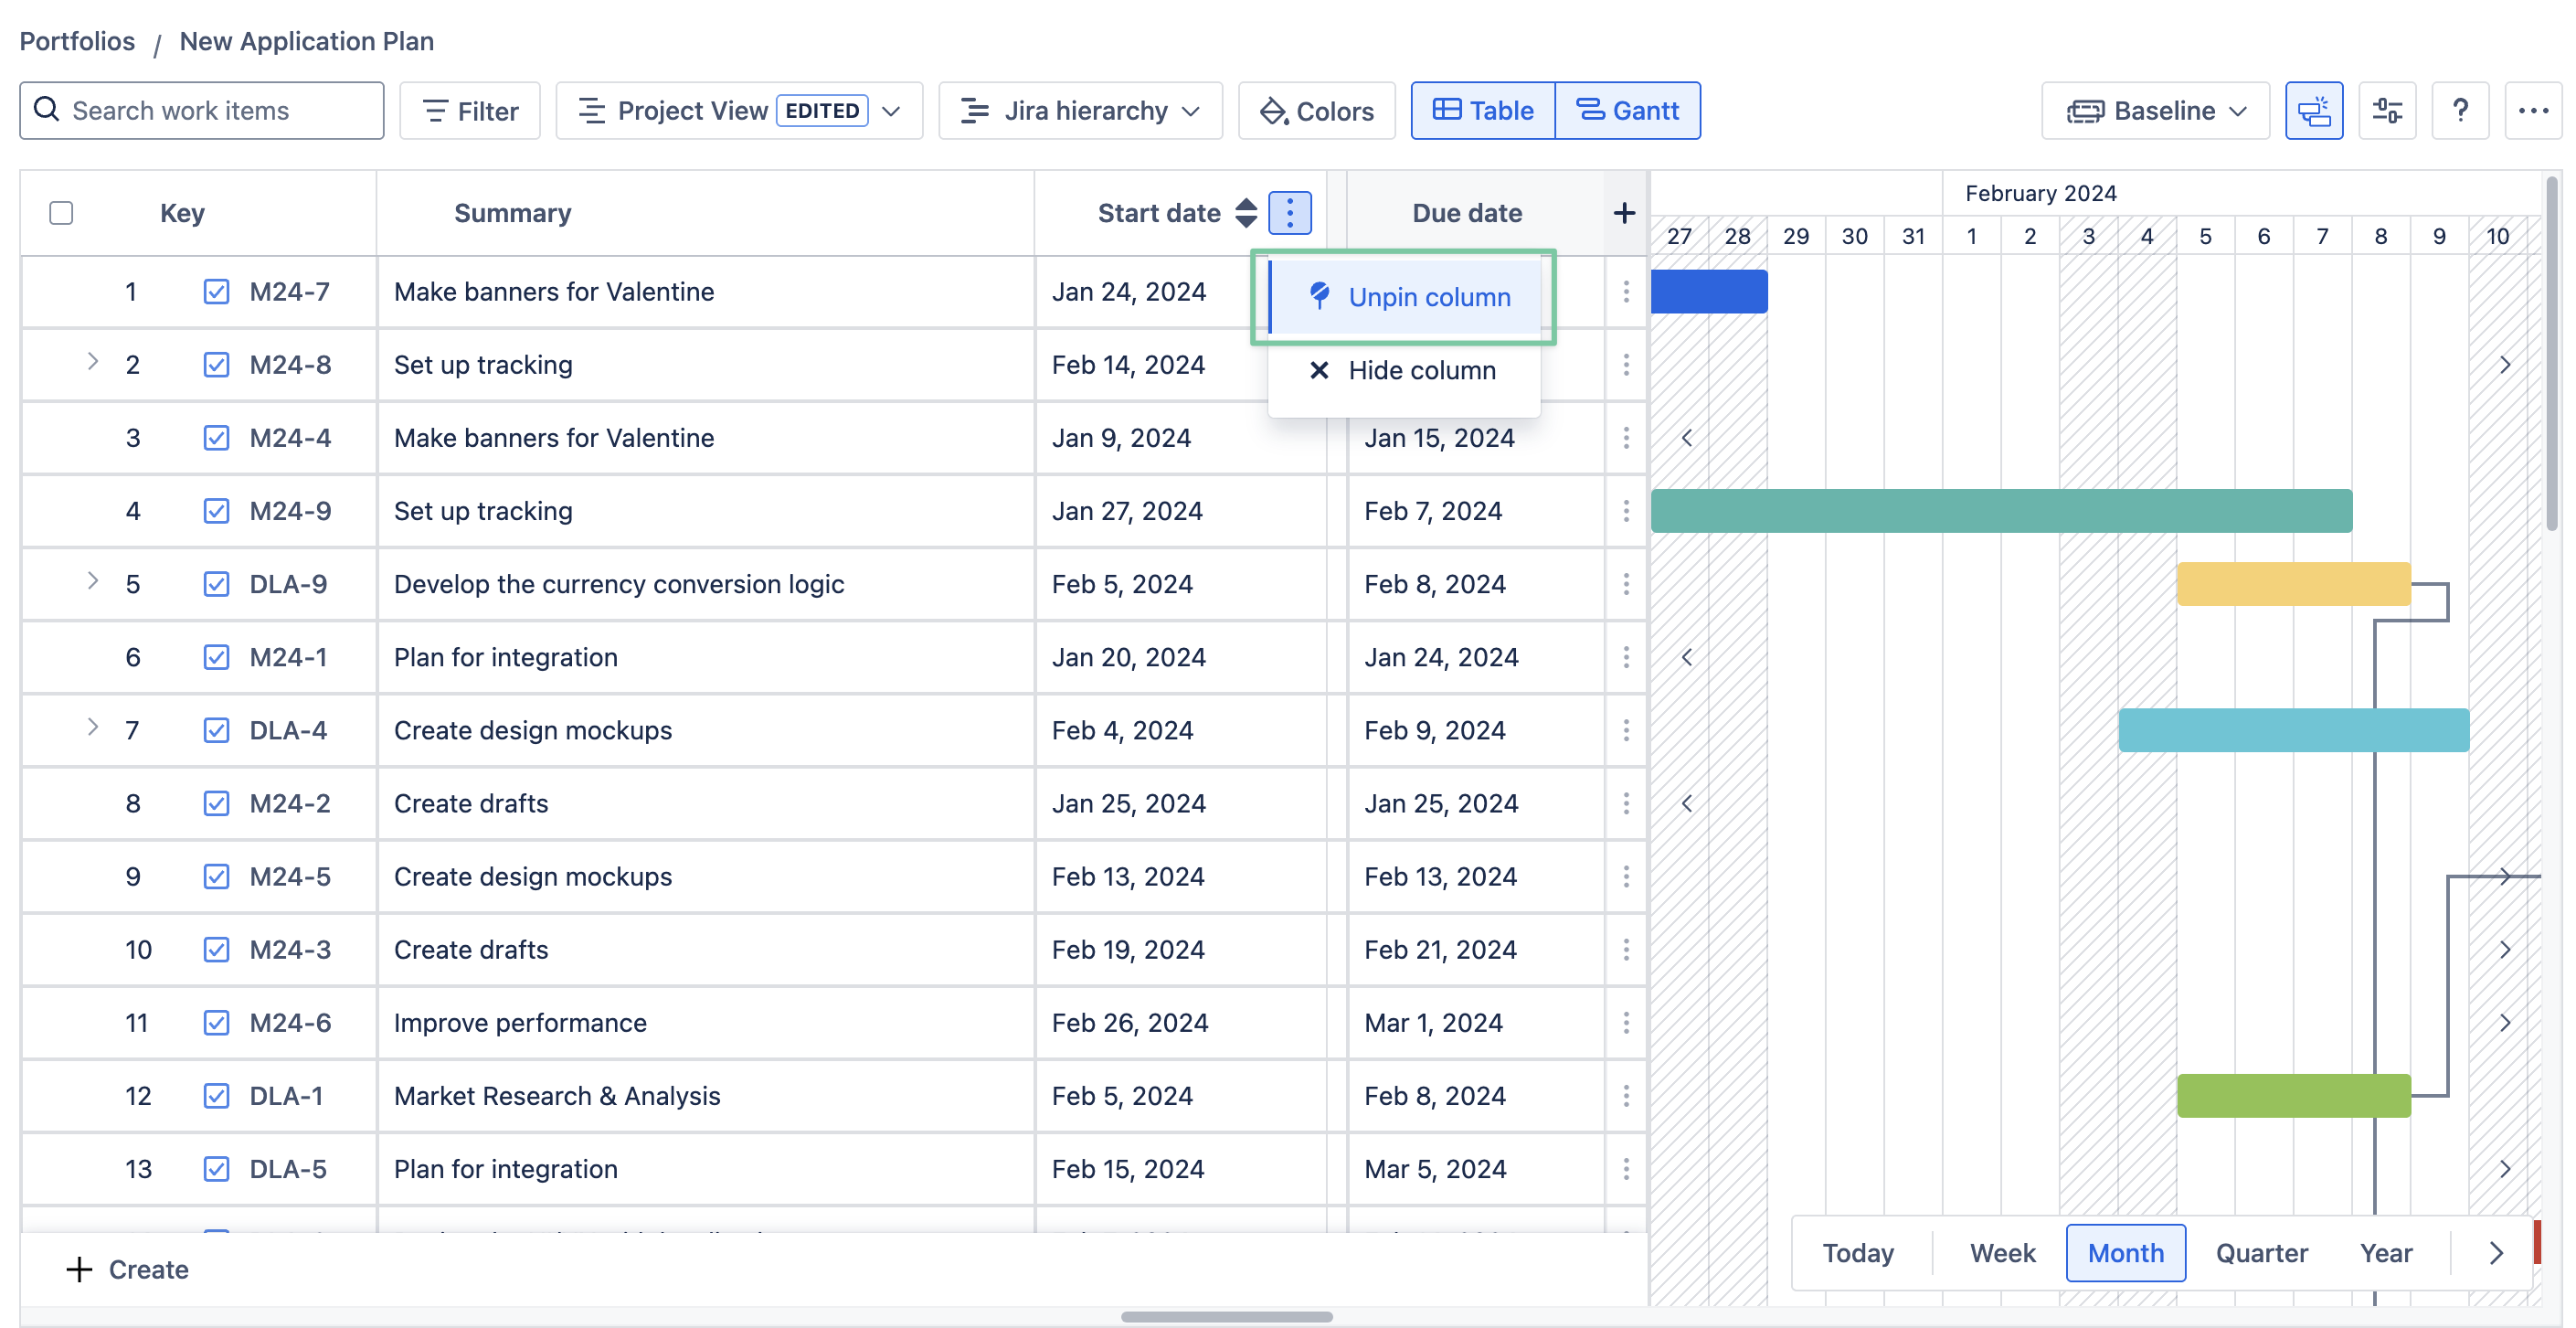
To remove a column from the table, you can hover over that column → click the three-dot symbol -> choose Hide column.
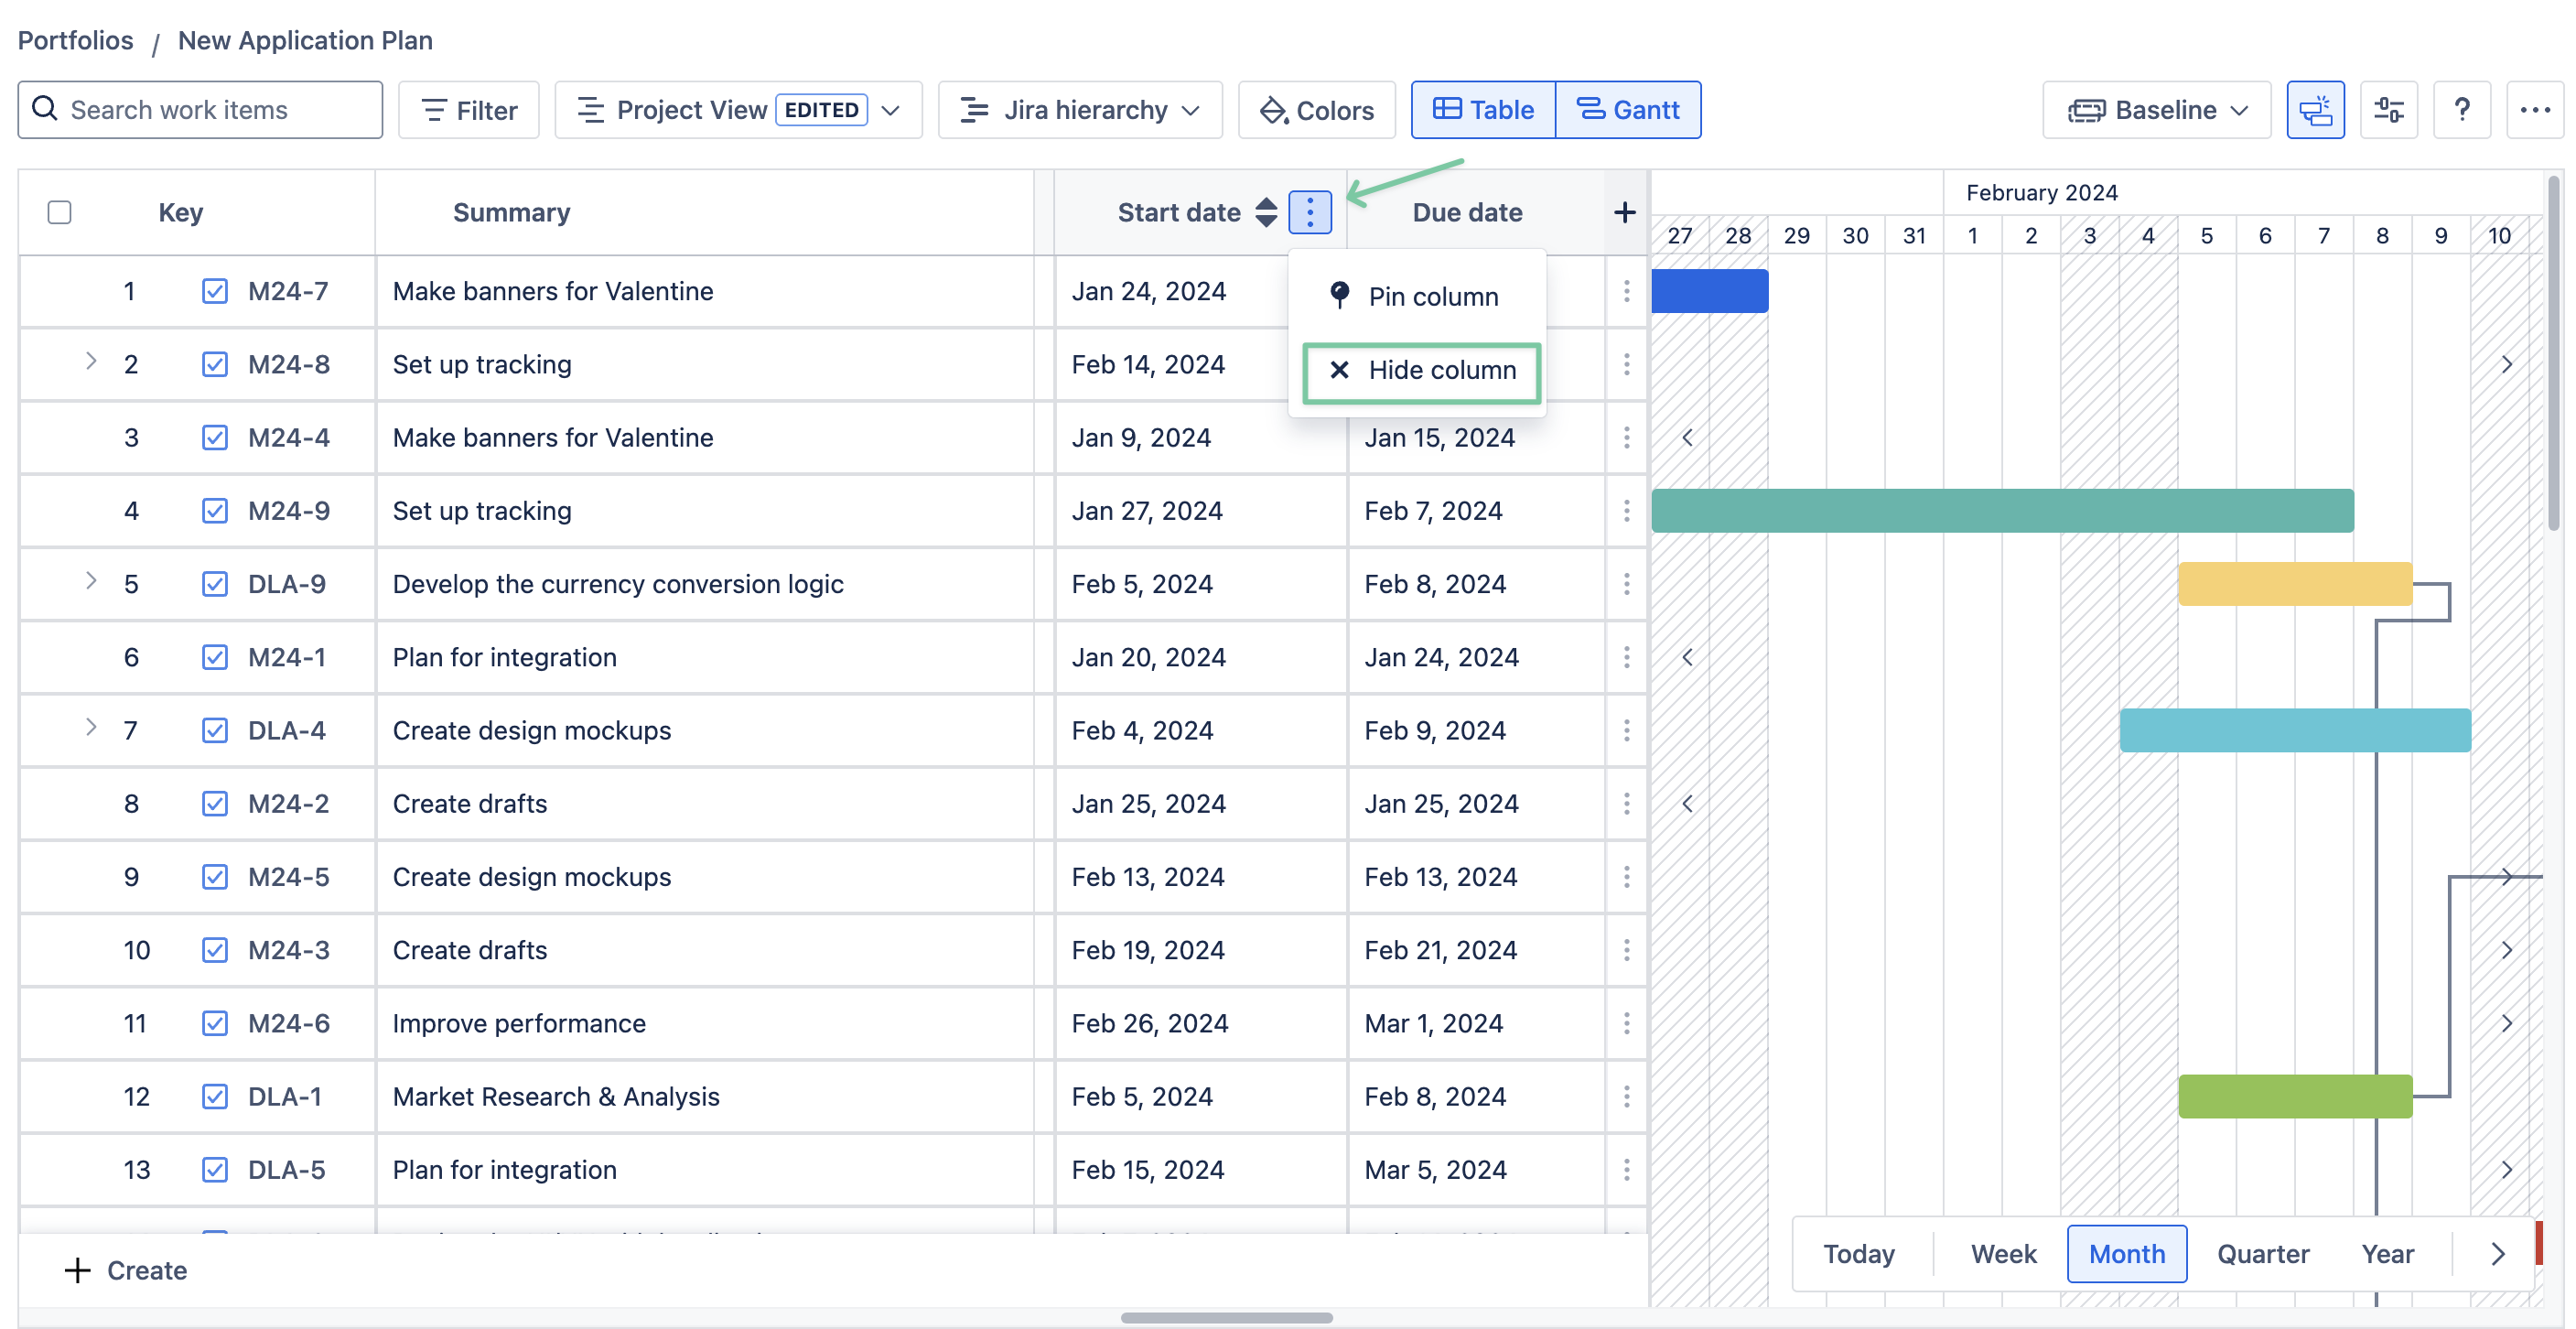
This can be helpful if you want to create different Saved views using different column layouts.
For example, this allows you to switch between different column layouts on the same board, which can be used for different teams or projects.
Resize and arrange the columns
You can narrow or widen a table column by clicking the right-hand-side border of its column cell and dragging it horizontally to adjust it.
You can adjust the column order freely by hovering the cursor over the dots symbol. Then, click and drag the column to a new position.
Freeze a column
By default, the app freezes the Issue key and Summary columns on the left. You can freeze other columns as well by using the pin function.
Hover the cursor over the column you want to freeze, click the three-dot symbol → choose 📍Pin column to avoid scrolling it away.
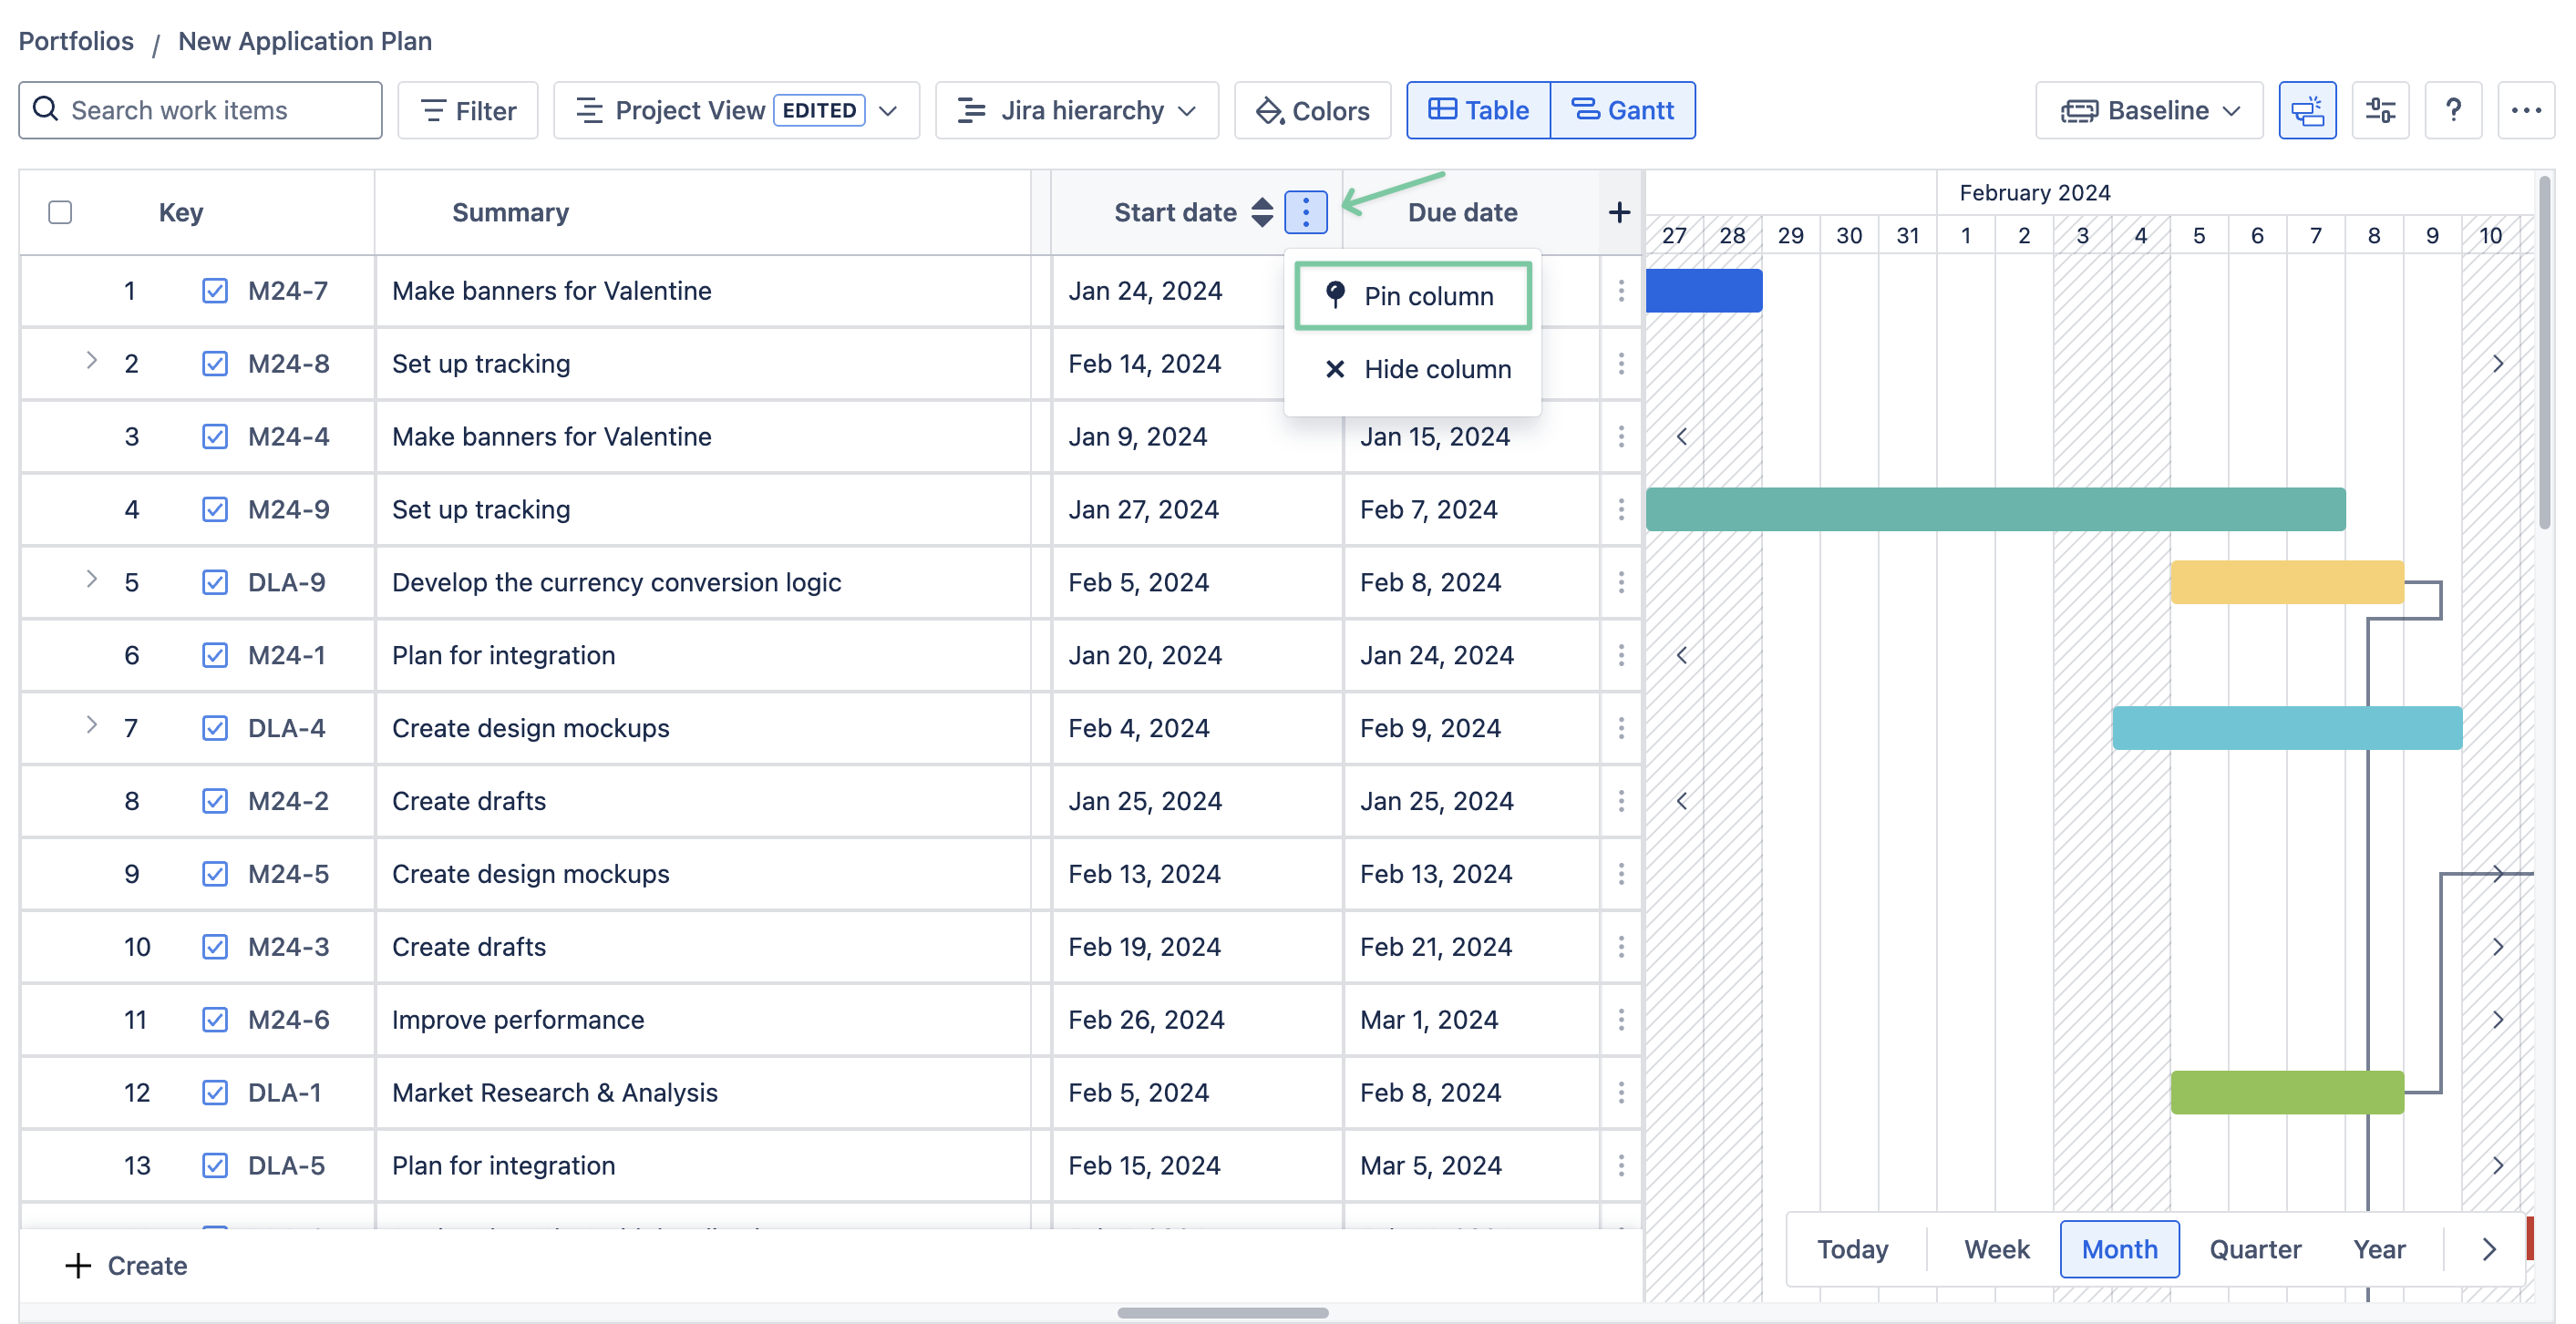
This is helpful if you want to utilize both the spreadsheet and the Gantt feature while keeping important data fields visible.
To unfreeze a column, simply hover over that column again, click the three-dot symbol, and choose Unpin column.
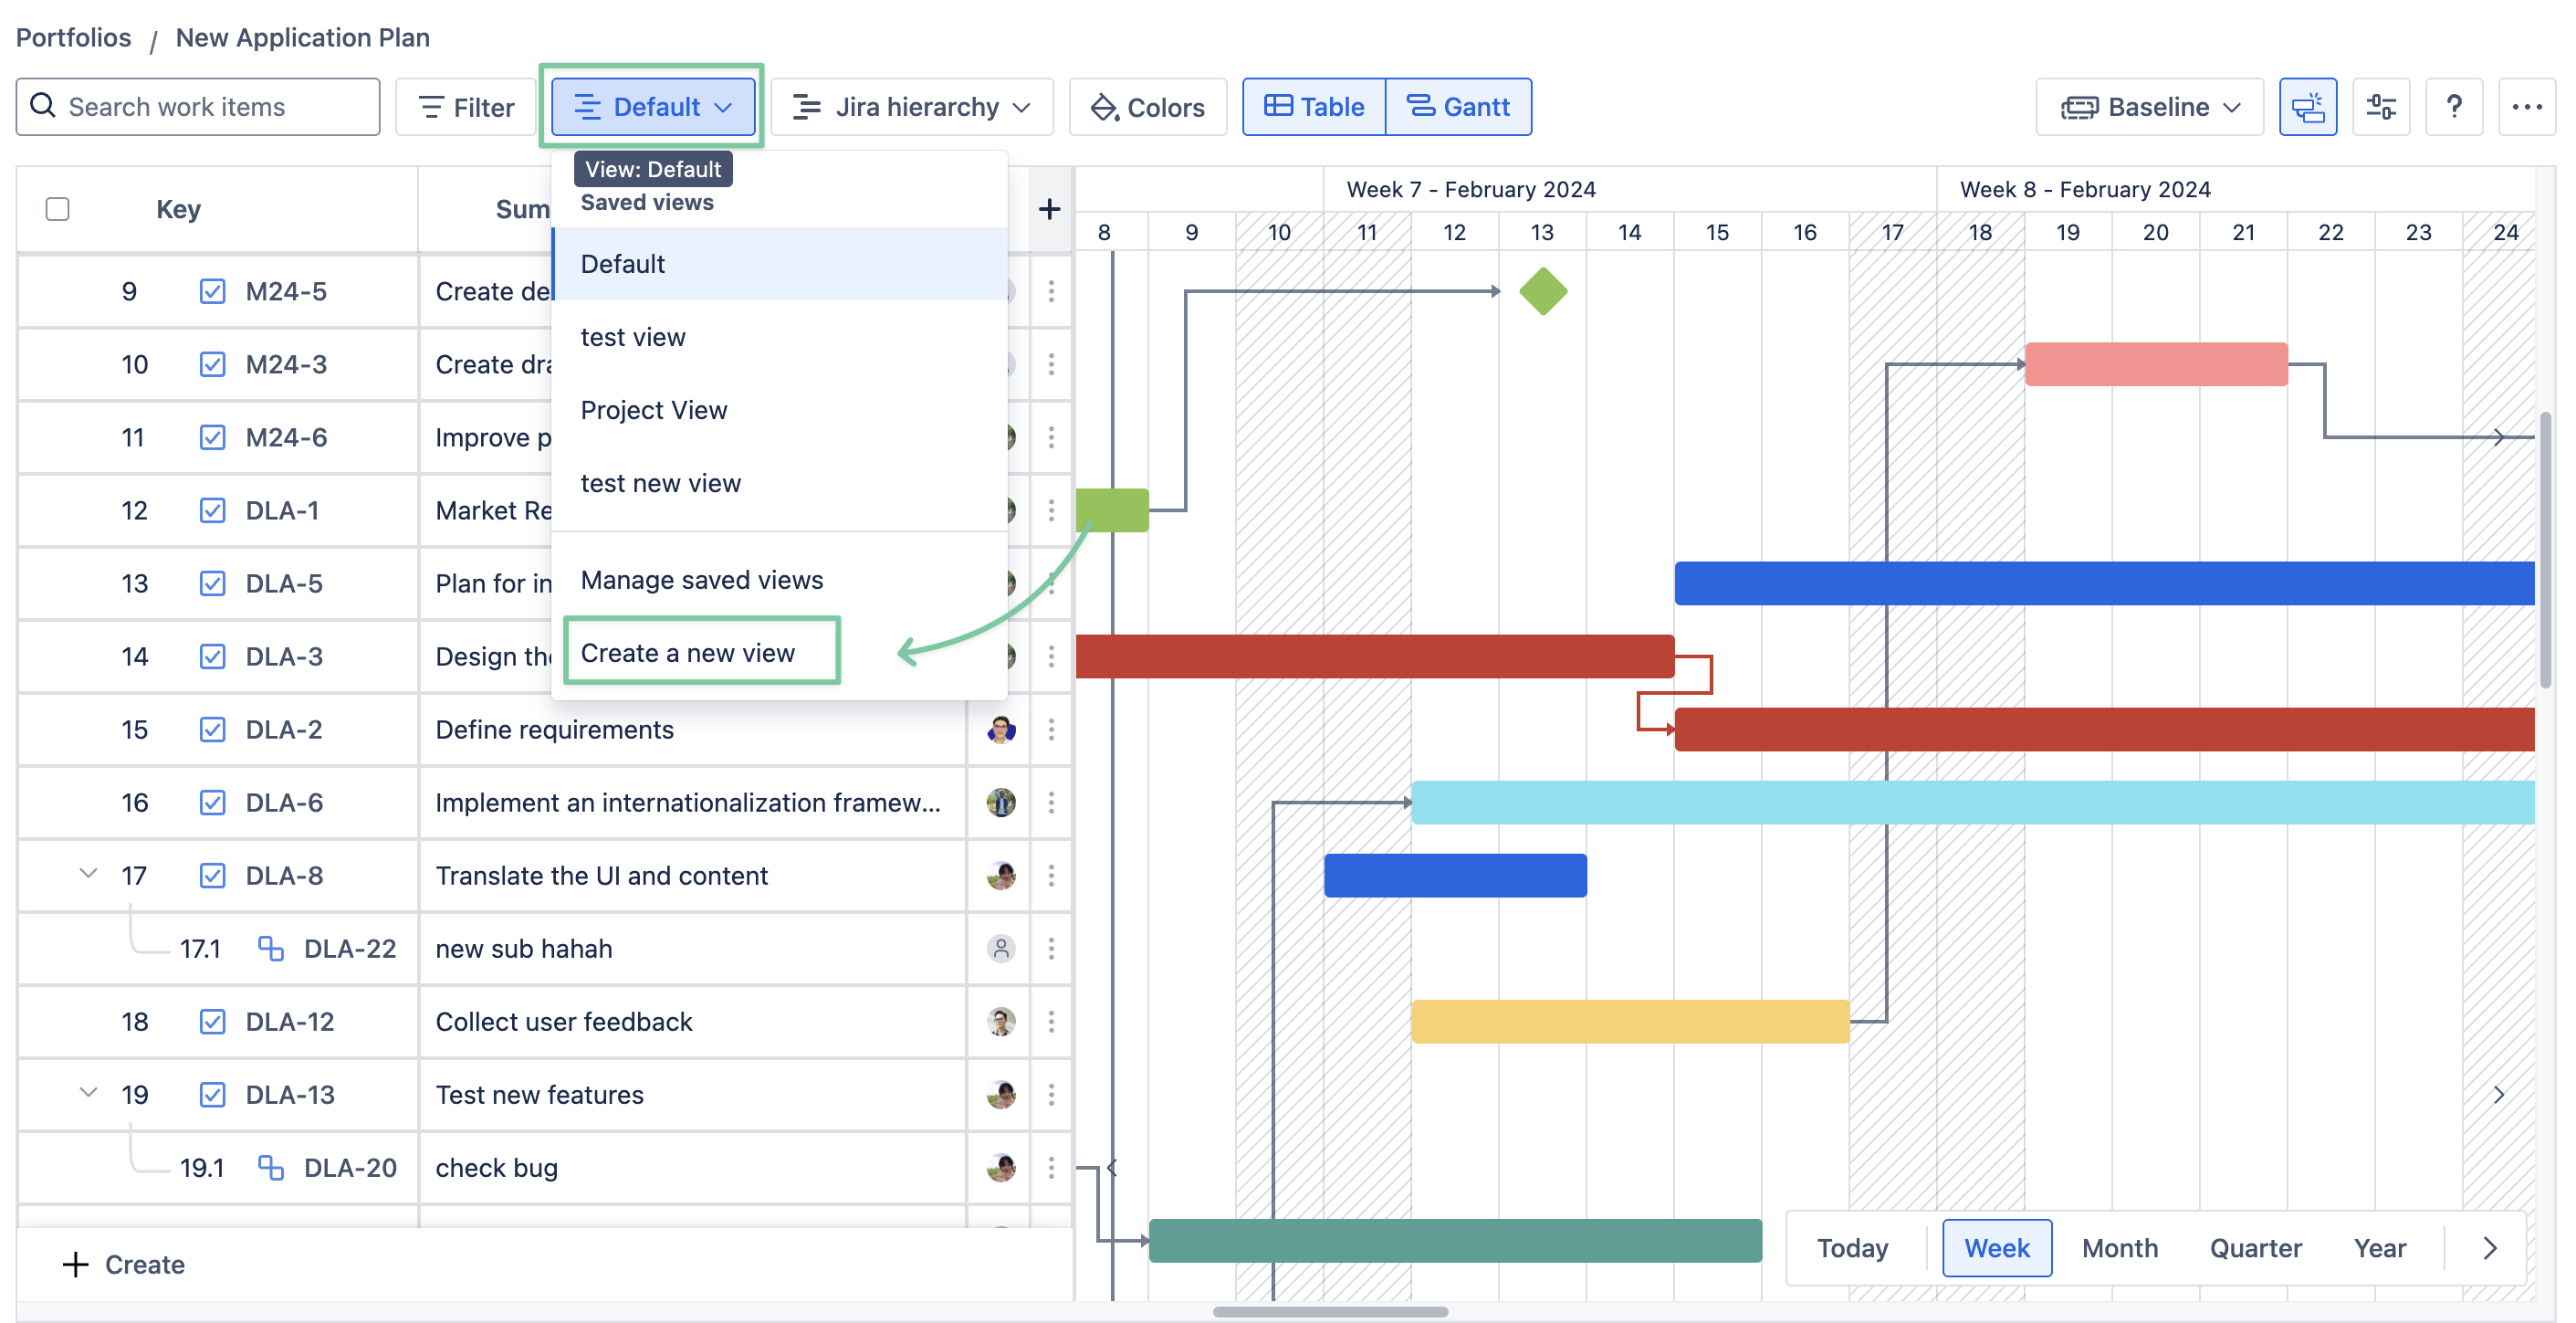
3. How to create a new view (Saved views)?
Before creating a new view, make sure that you have selected the settings and structure you desire in the table.
-
From your current view in the app, simply click the View menu dropdown → choose + Create new view.
-
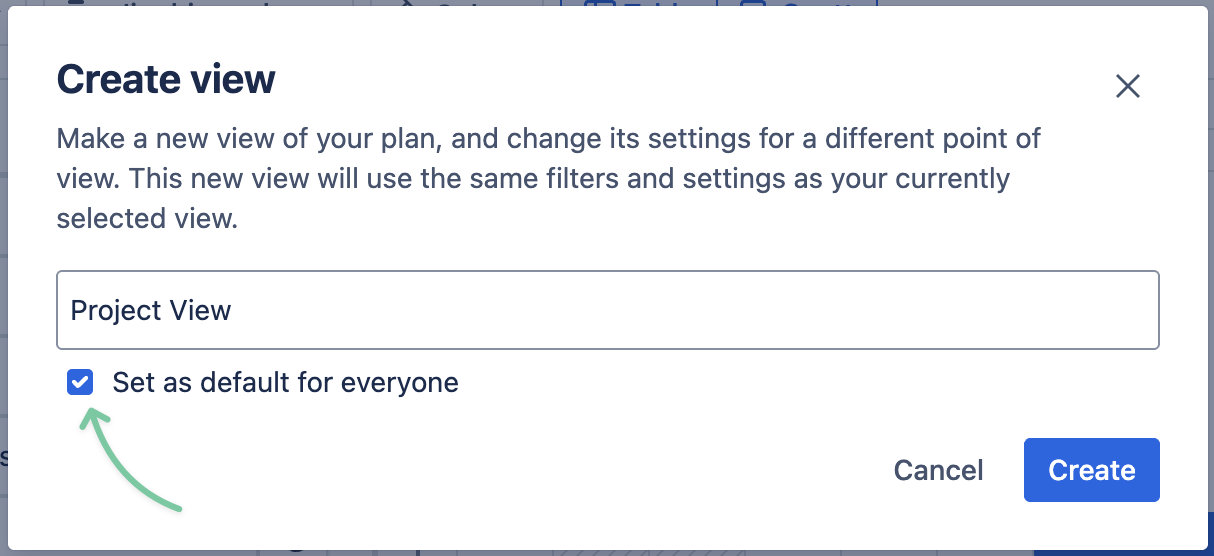
Name this view so other members can recognize it easily.
-
Check the box to set it as a default view for everyone whenever they access your portfolio.
Once done, click Create.
You can always change the default view in the portfolio settings. Additionally, you can delete your saved views here.
For more details, please visit Saved views in Settings & Preferences.
With that, you've created saved views that you can switch between for different purposes of use or different workflows.
Smart Columns v3.0.0
GanttTable also supports the Smart column feature. This allows users to add a column to the table and show calculated data depending on the Type, the Sum-up style, and the Jira fields.
In GanttTable, you can use Smart columns to display calculated or derived information of two Jira work item fields in the details. You can choose 5 prebuilt Smart columns or create and customize a new column to suit your needs.
To access this feature, click the ➕ icon to add a new column. Then, click on the Smart columns tab.
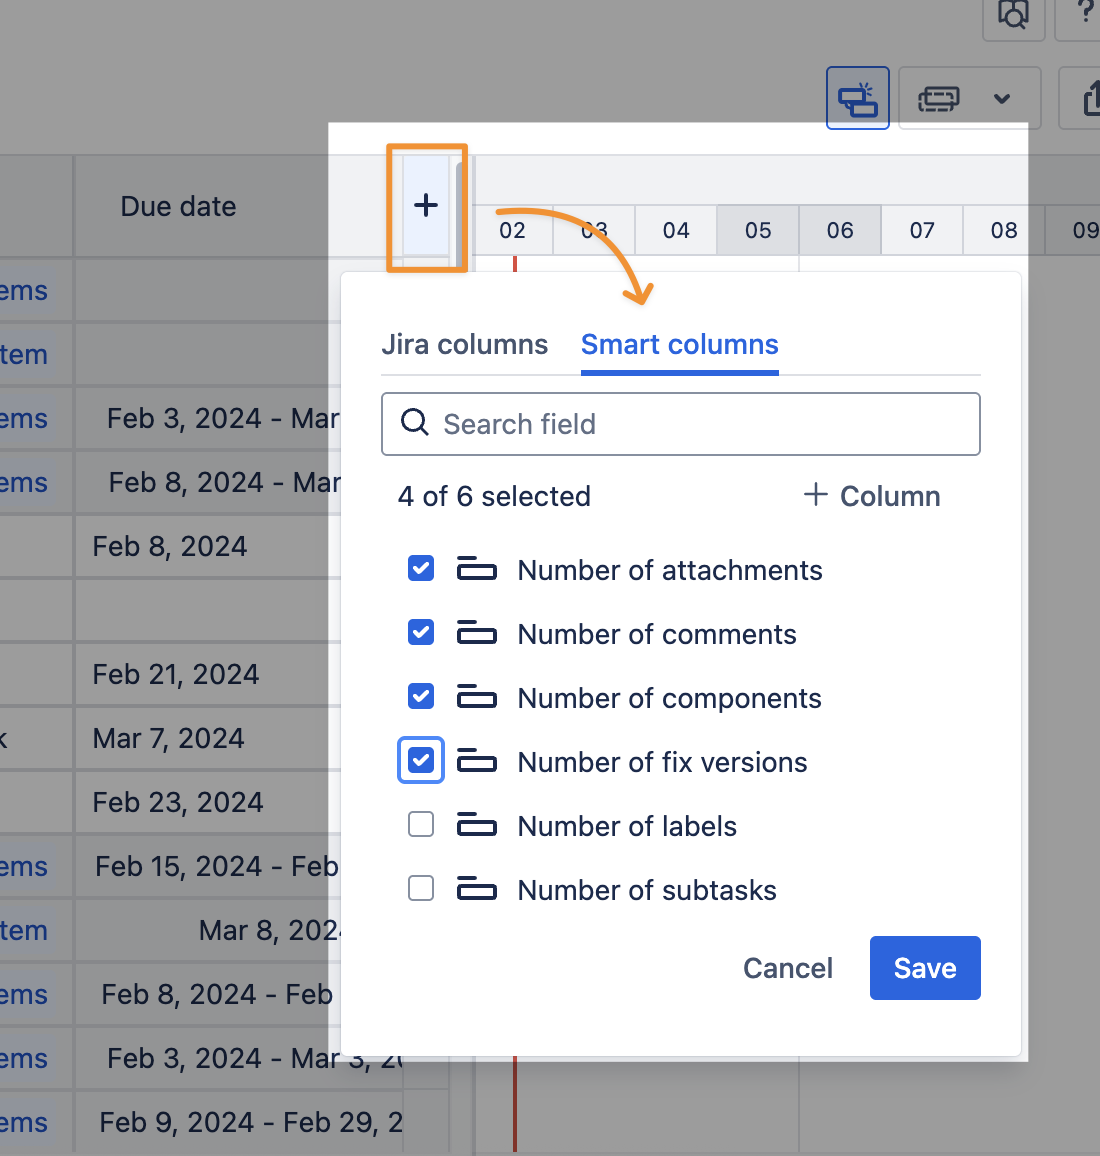
Currently, the app has already prepared 6 prebuilt Smart columns for you:
-
Number of attachments
-
Number of comments
-
Number of components
-
Number of fix versions
-
Number of labels
1. Editing the prebuilt Smart columns
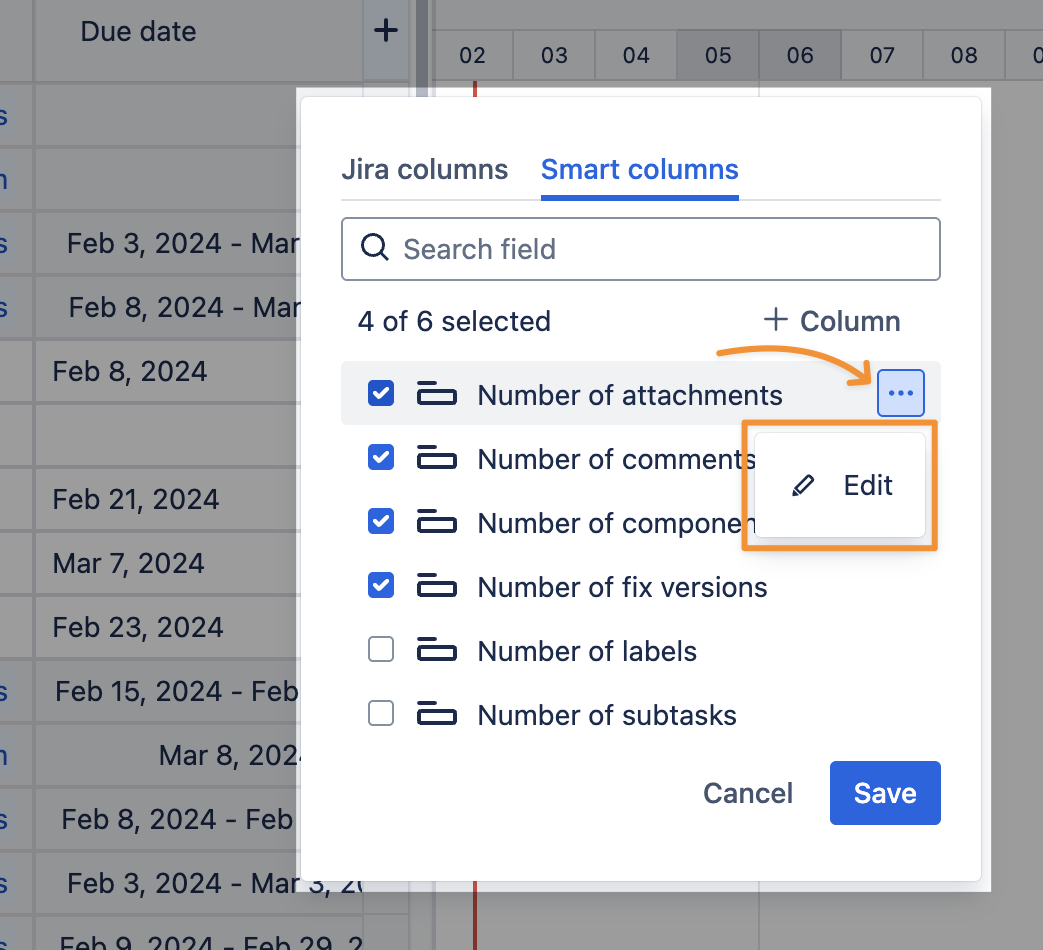
With the prebuilt columns, you cannot change their name, type, or sum-up style. Still, you can change their header formats, including the background and text colors.
To do that, hover over the Smart column you want to change → click […] → choose Edit.
In the Edit column dialog, you’ll see 2 options to change the colors of the cell background and text in the Header format section.
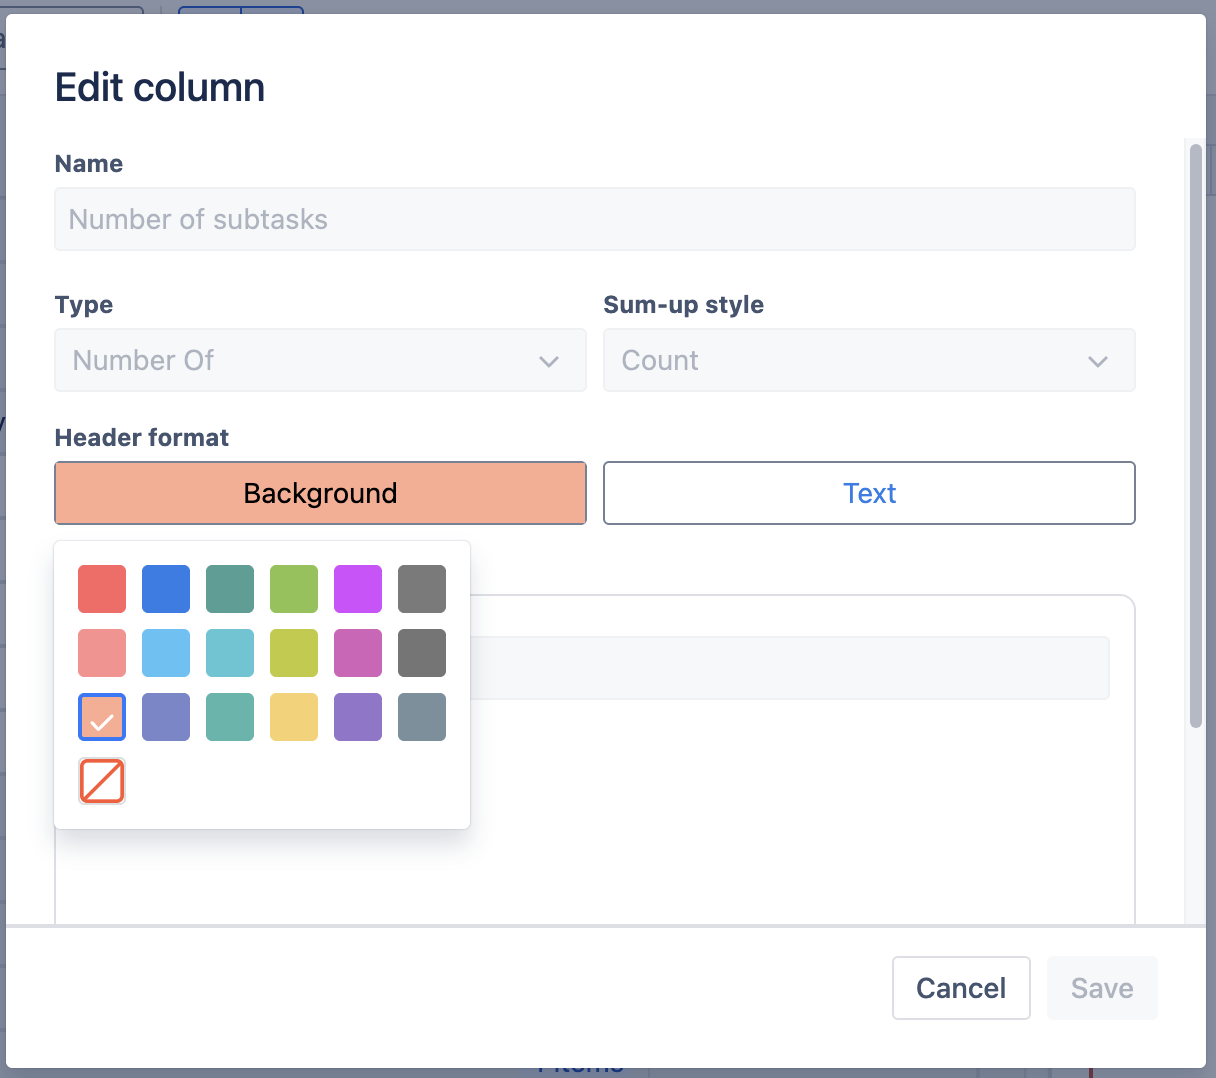
Once done, click Save.
2. Adding custom Smart columns
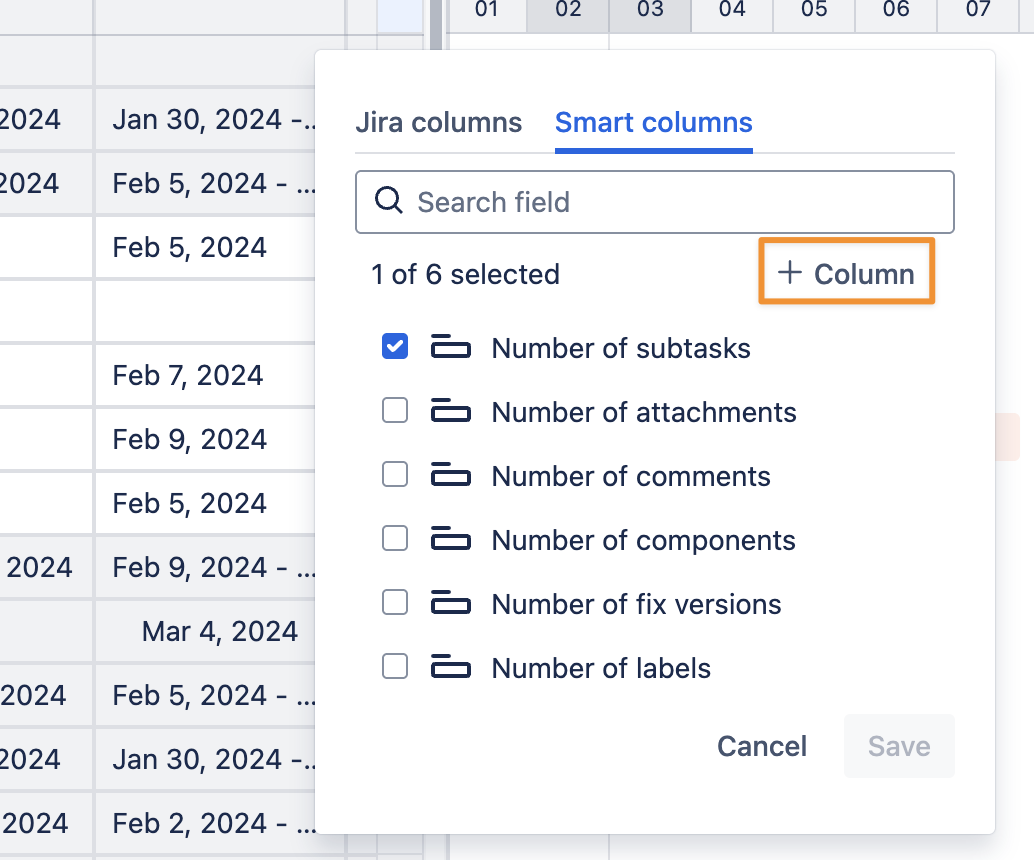
GanttTable also supports creating custom Smart columns for different needs.
To create a new Smart column, click the + Column button.
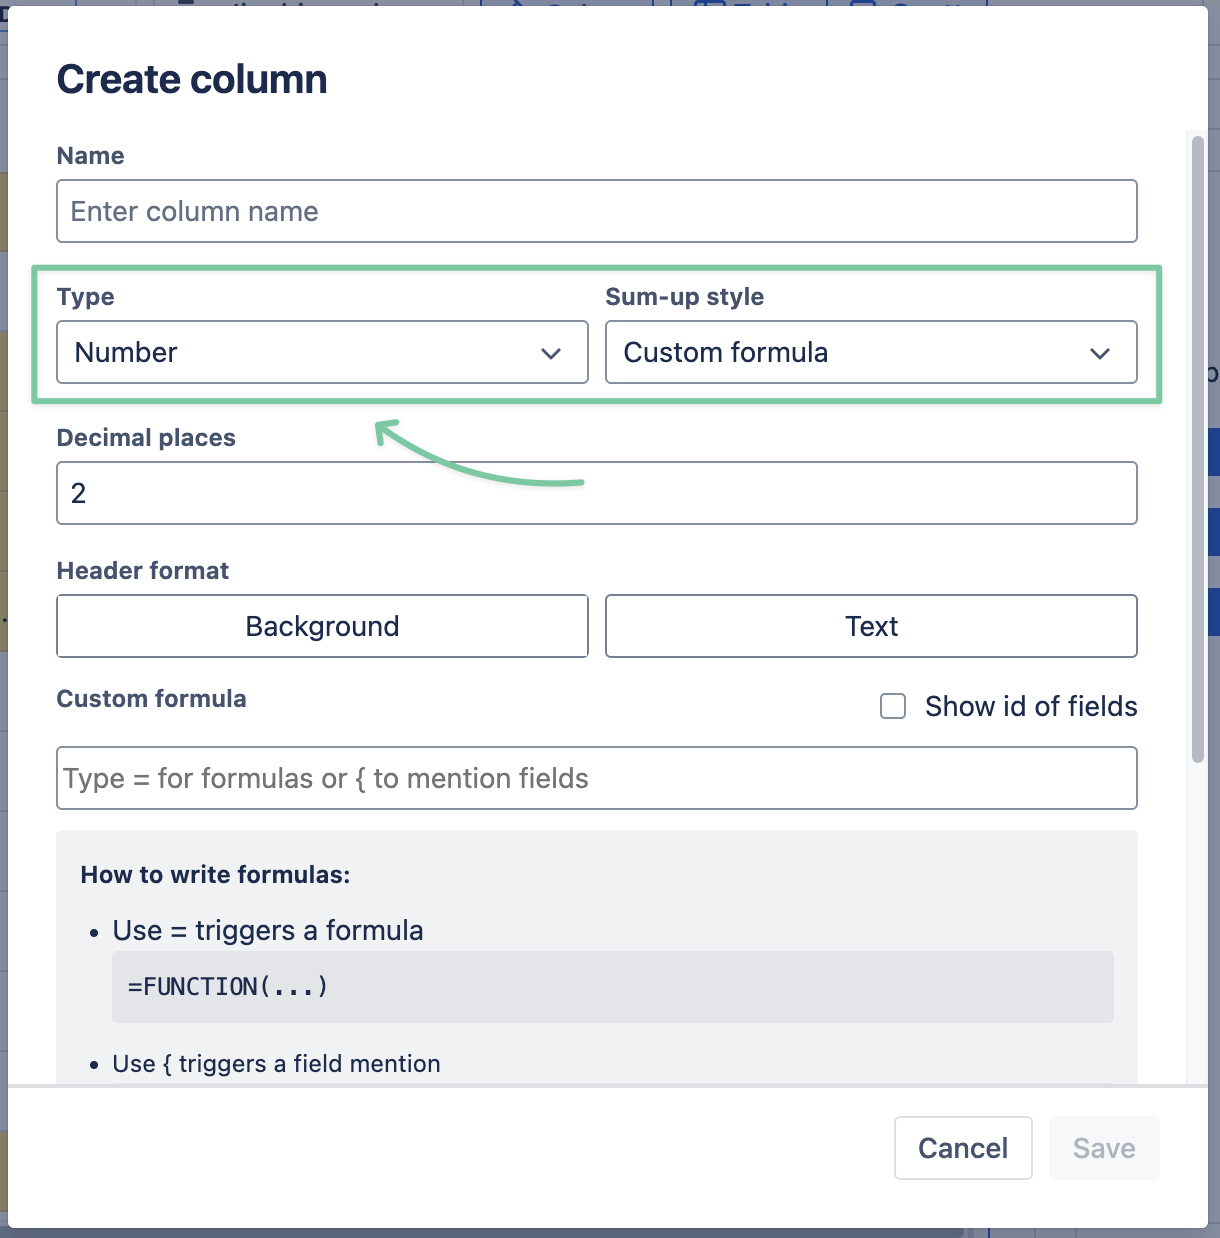
After choosing a name for this Smart column, continue to select its Type and Sum-up style.
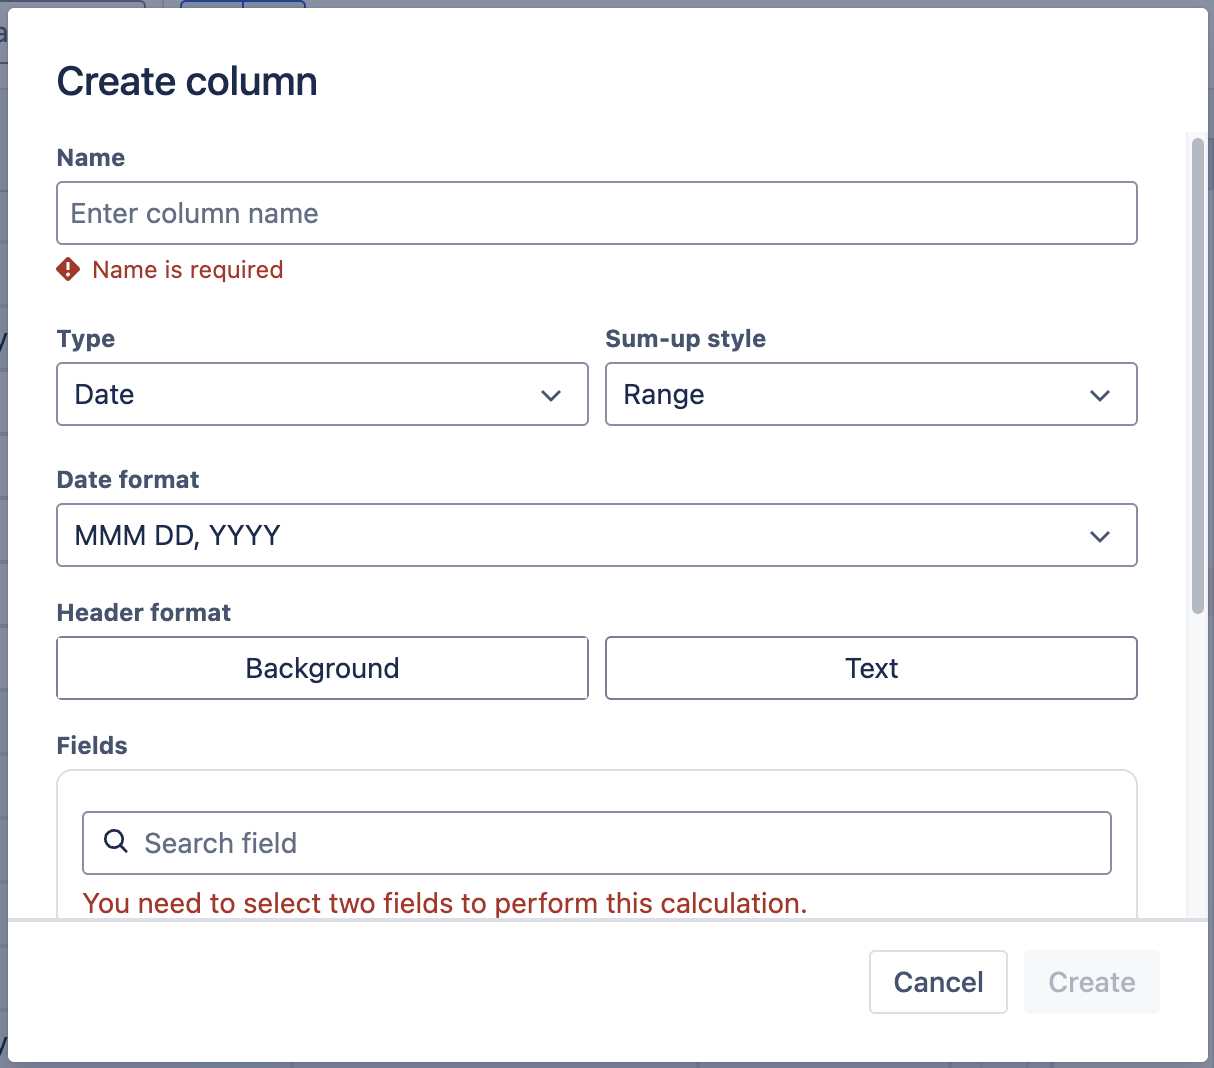
Currently, GanttTable allows creating 3 different Types: Date, Number, and Time Estimate, and each type uses a different set of Sum-up styles.
|
Type |
Sum-up style |
|---|---|
|
Date |
|
|
Number |
|
|
Time Estimate |
|
You can change the colors of the cell’s background and its text in the Header format or leave it as the default.
Next, you are required to add two date fields to perform the calculation in the Smart column. Different types of smart columns require different field values. You can learn more about each Type below.
Once done, click Create.
Date type
Selecting this type allows the Smart column to display calculated days for various tasks. When choosing fields used in the Date-type Smart column, you can pick either Jira default fields or custom fields in your instance.
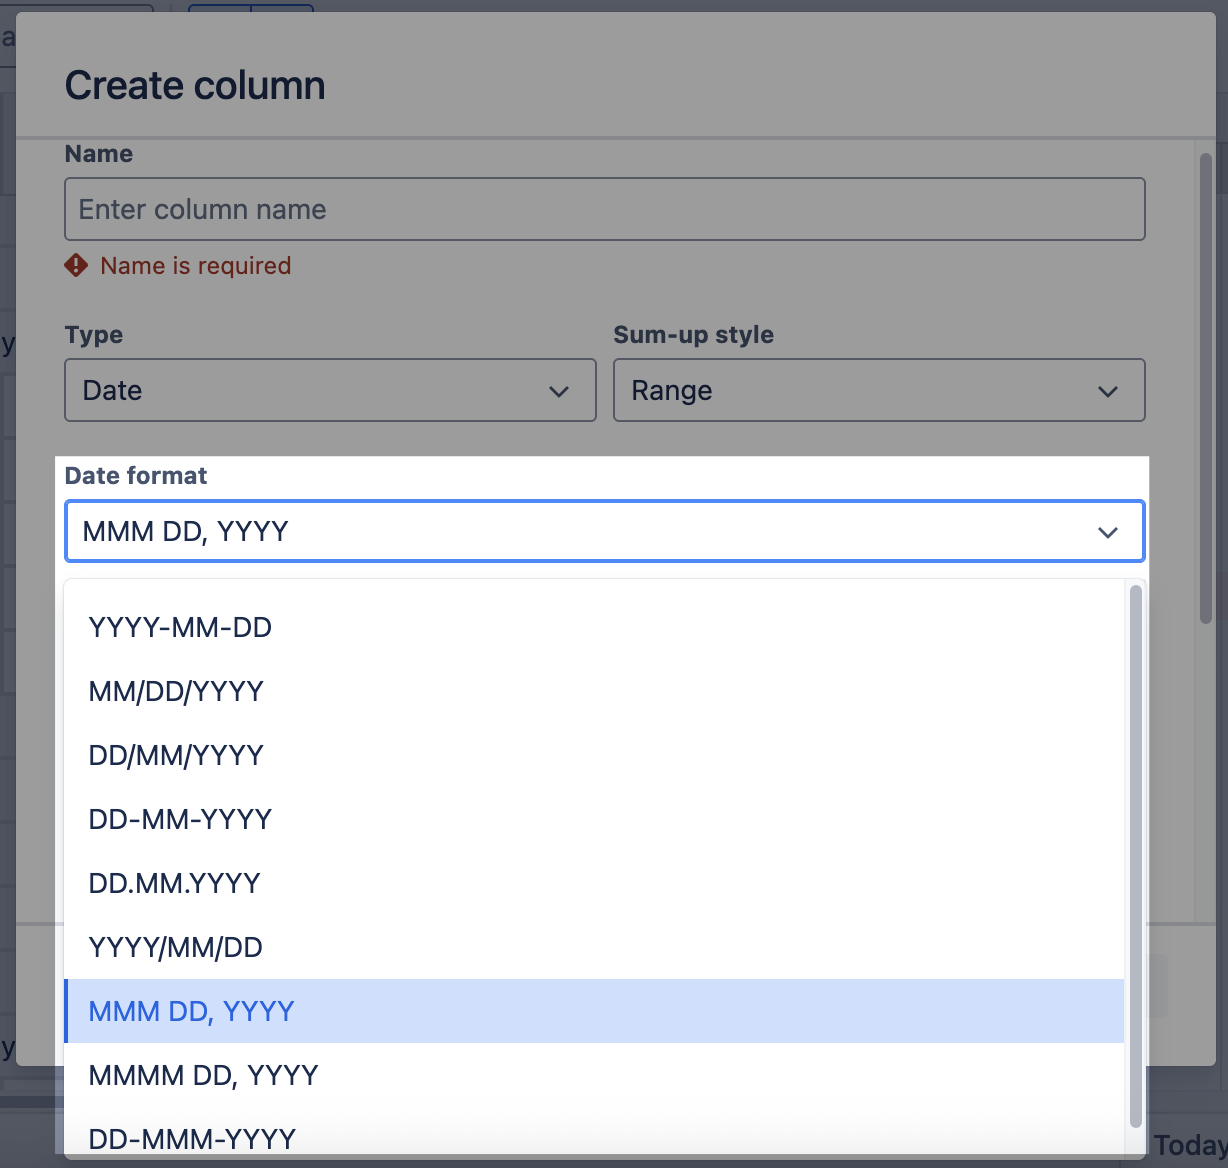
This type also supports multiple date formats.
The supported fields shown on the list depend on the mapped fields in the app’s configuration.
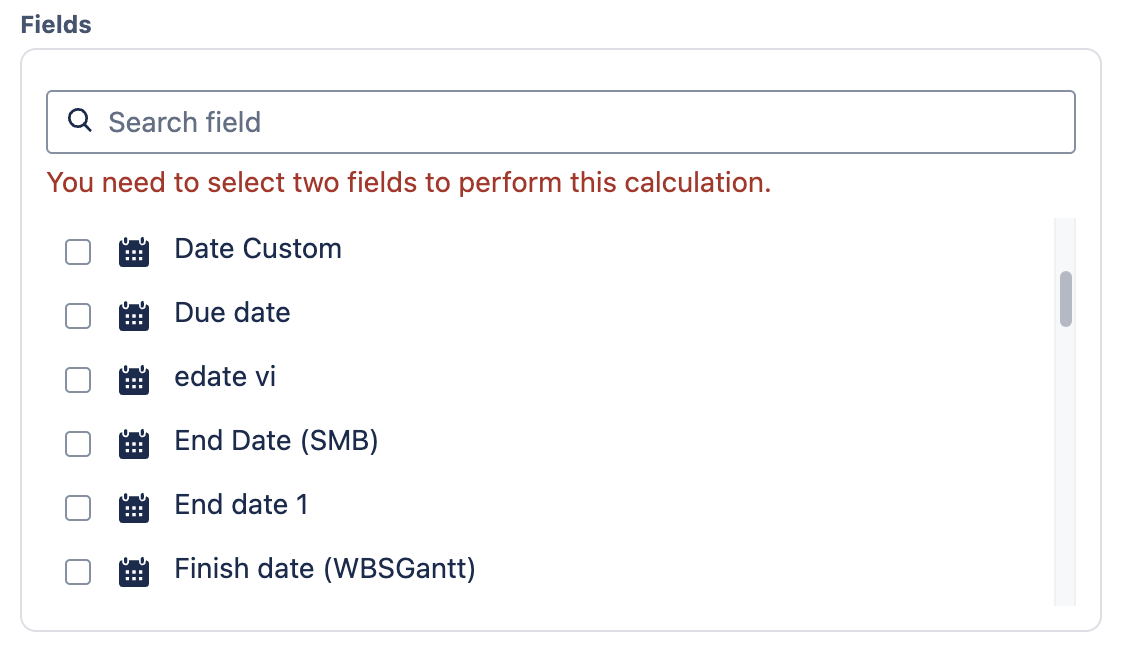
*It is recommended to use the Start and End date fields to display the correct calculation.
NOTE
Currently, GanttTable only supports custom date fields created with Date picker fields.
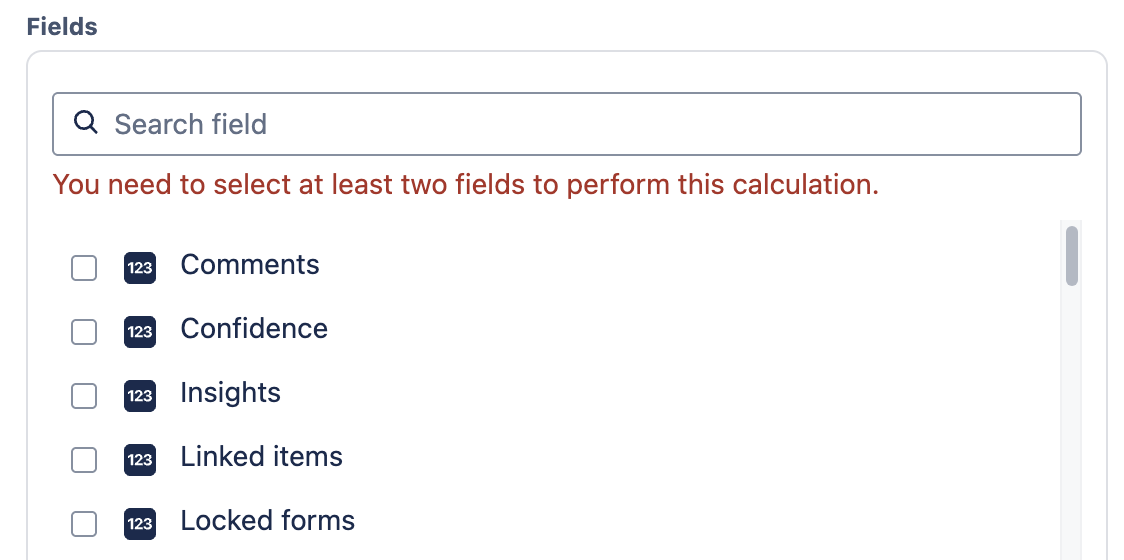
Number type
This type allows showing calculated numbers in the Smart column. It supports Jira default fields and custom fields that use the Number field.
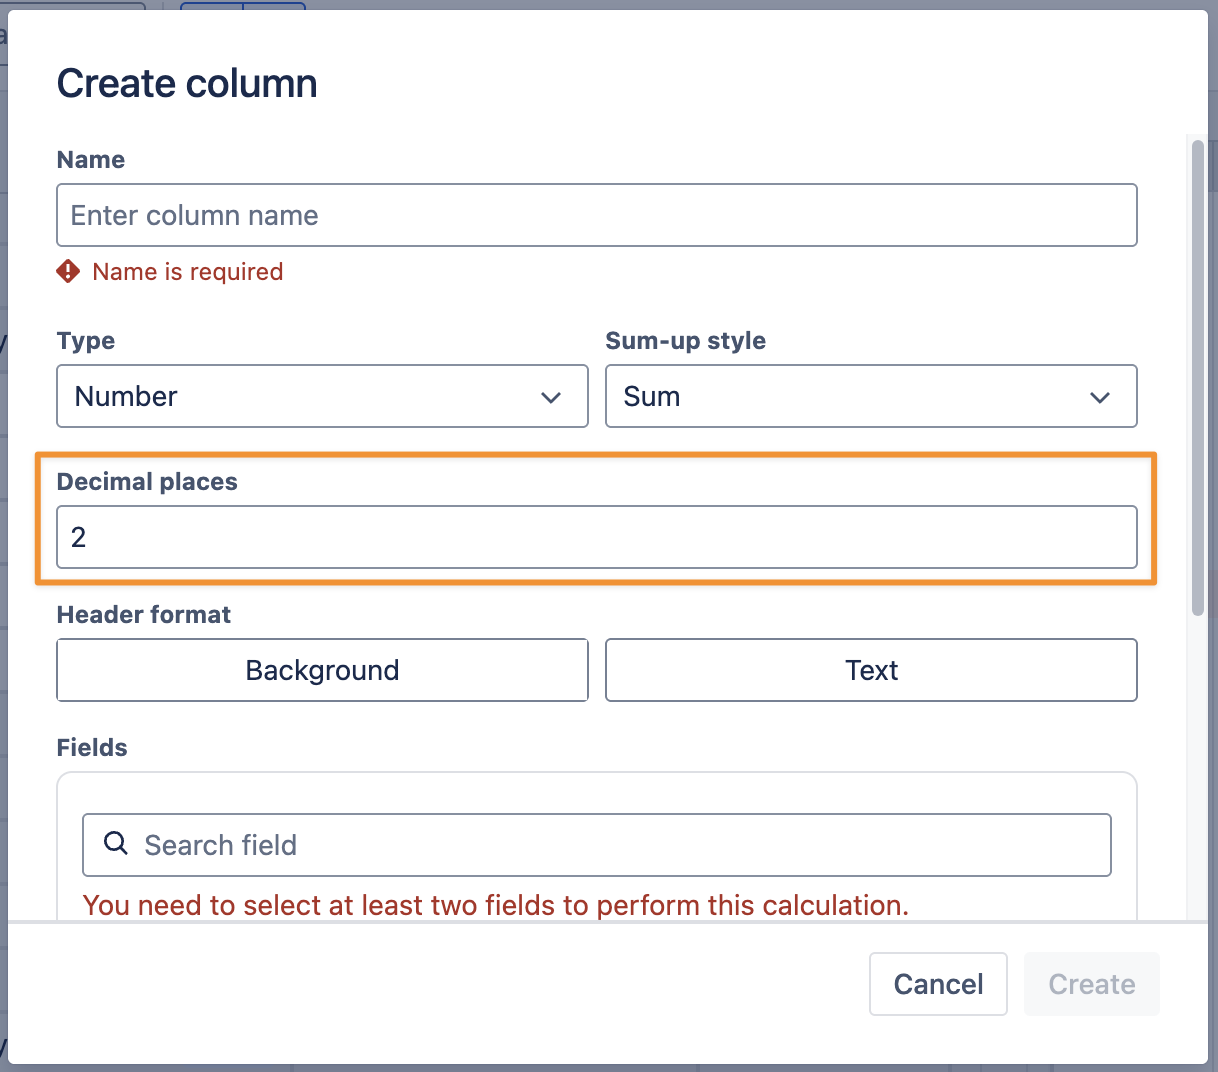
When choosing this Smart column type, there is an option to change the Decimal places in the numbers.
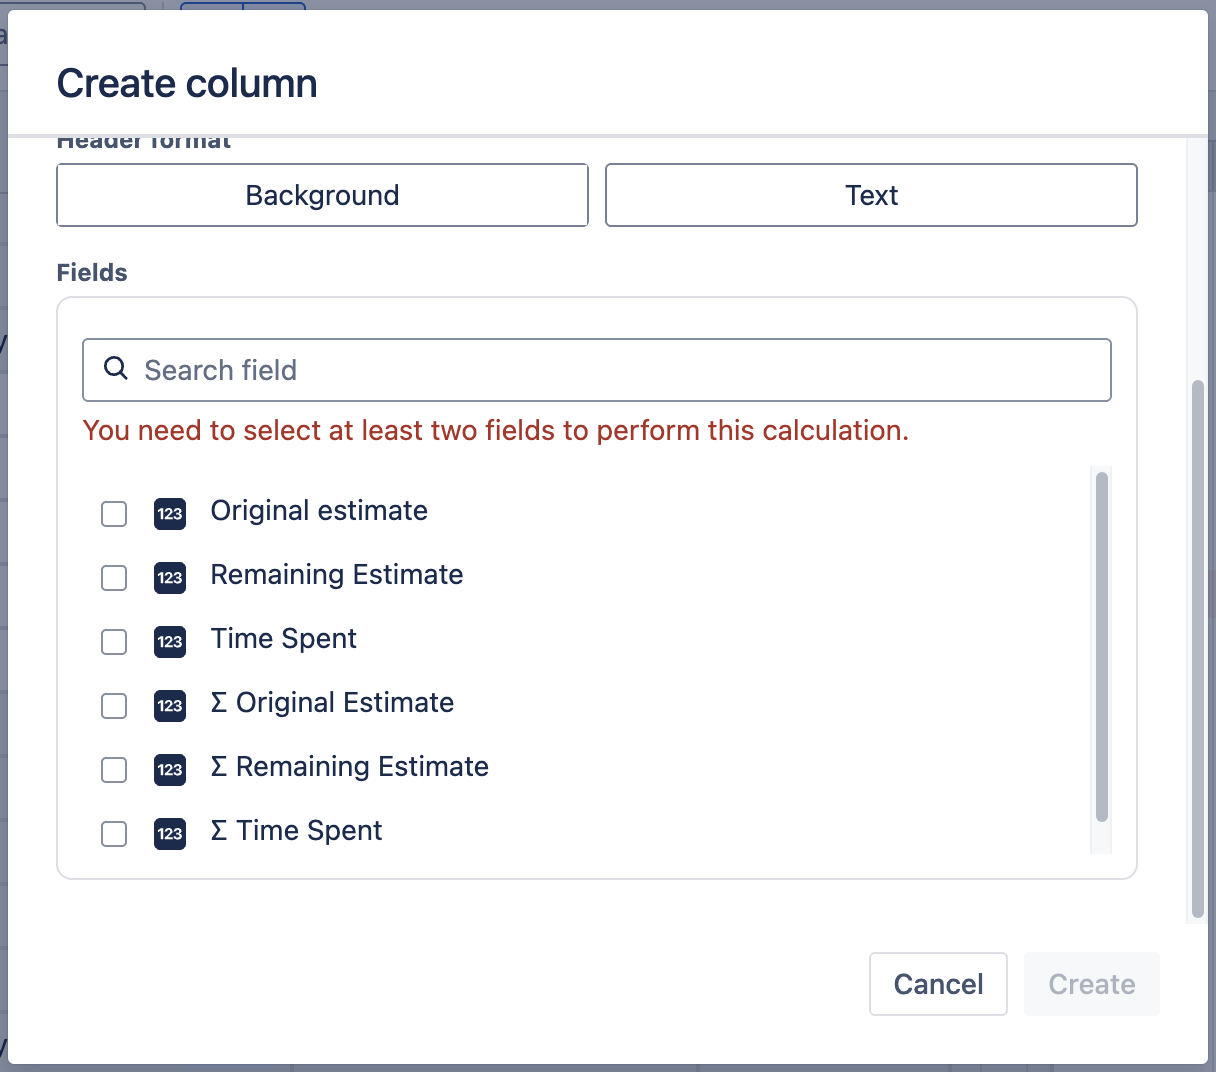
Time estimate type
This Smart column type displays the calculated time for each task.
Currently, the Time estimate type supports fields such as:
-
Original Estimate
-
Remaining Estimate
-
Time Spent
3. Custom formula
You can create custom smart columns in GanttTable by using Formulas.
The Custom Formula allows you to create custom values without having to create custom work item fields in your Jira instance.
To use this feature, select Custom formula when choosing the Sum-up style for your Smart column.
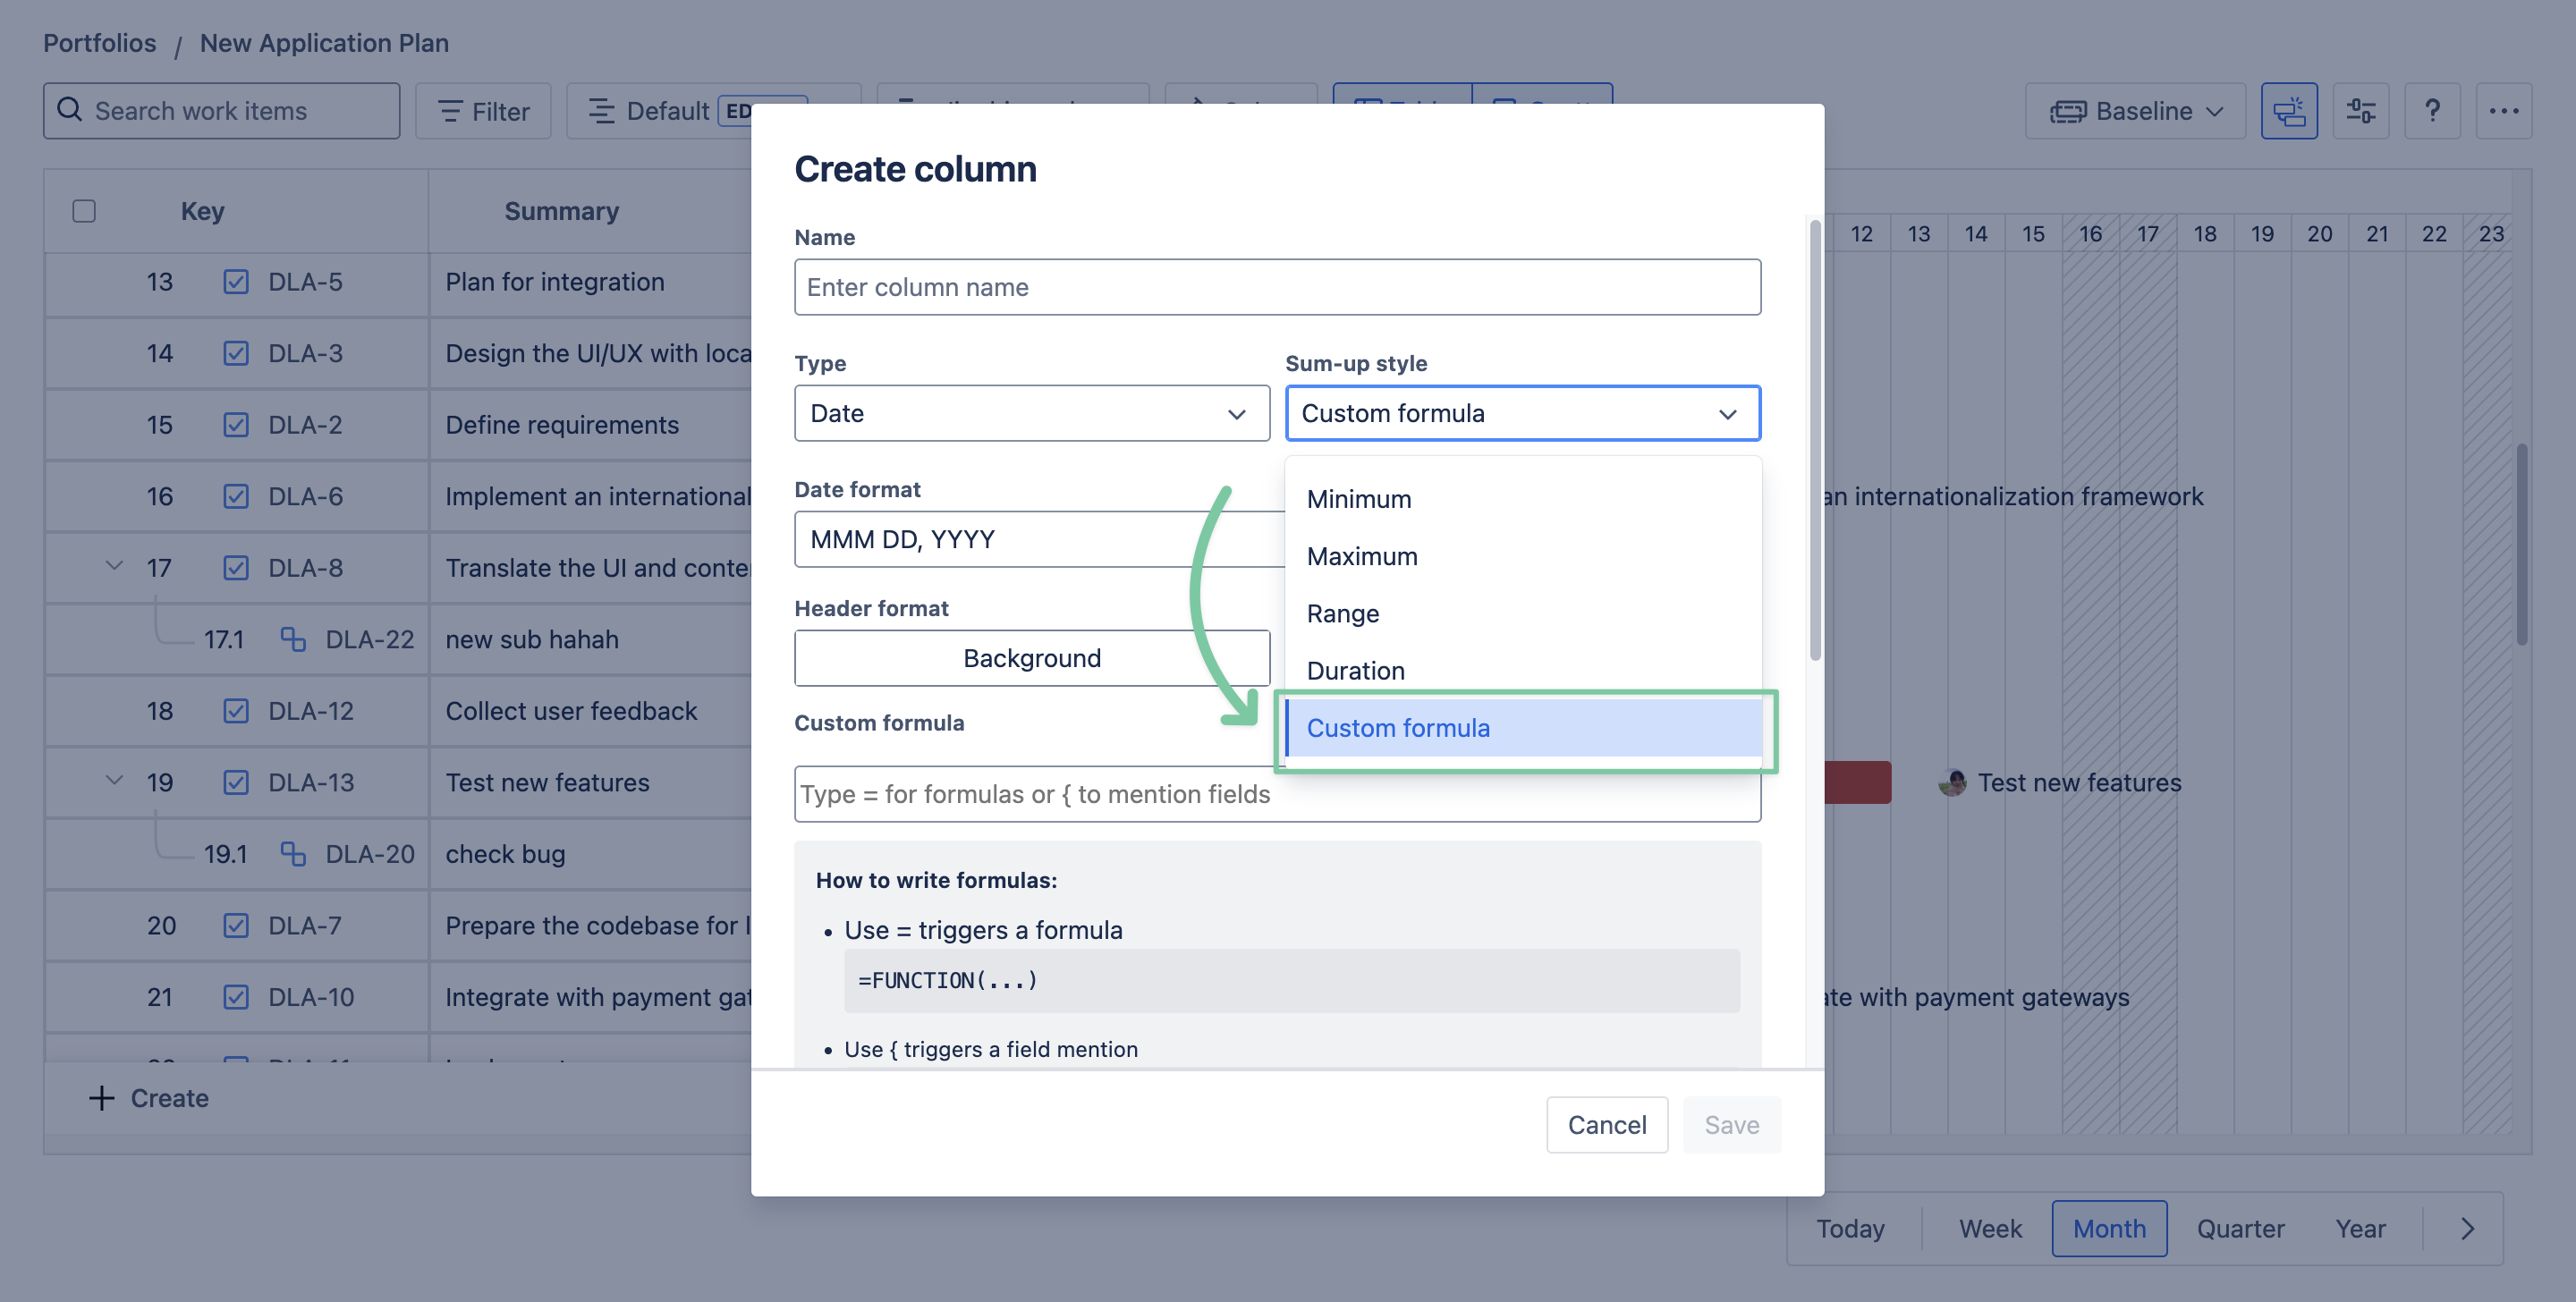
The Custom formula only works for 2 types of Smart columns, Date and Number types.
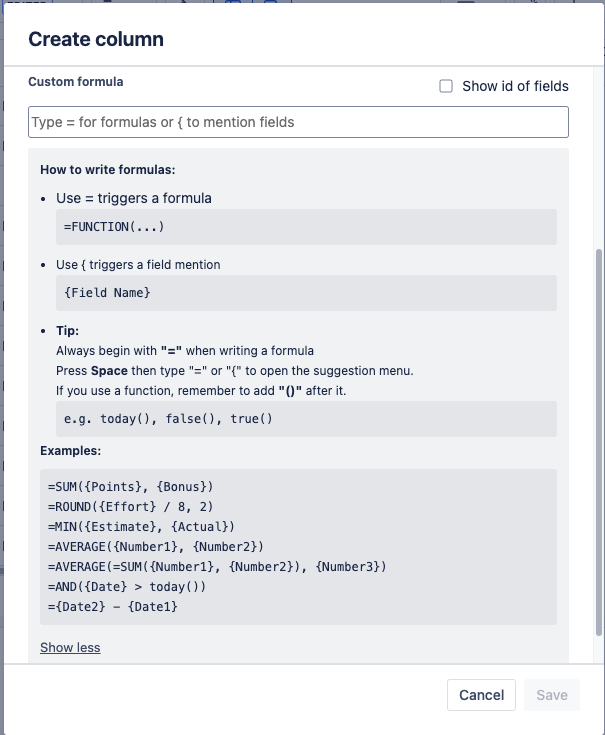
You can type in the formula you want to use. In case you don’t know how to work with it, there is a quick guide to help you go through the basics right below.
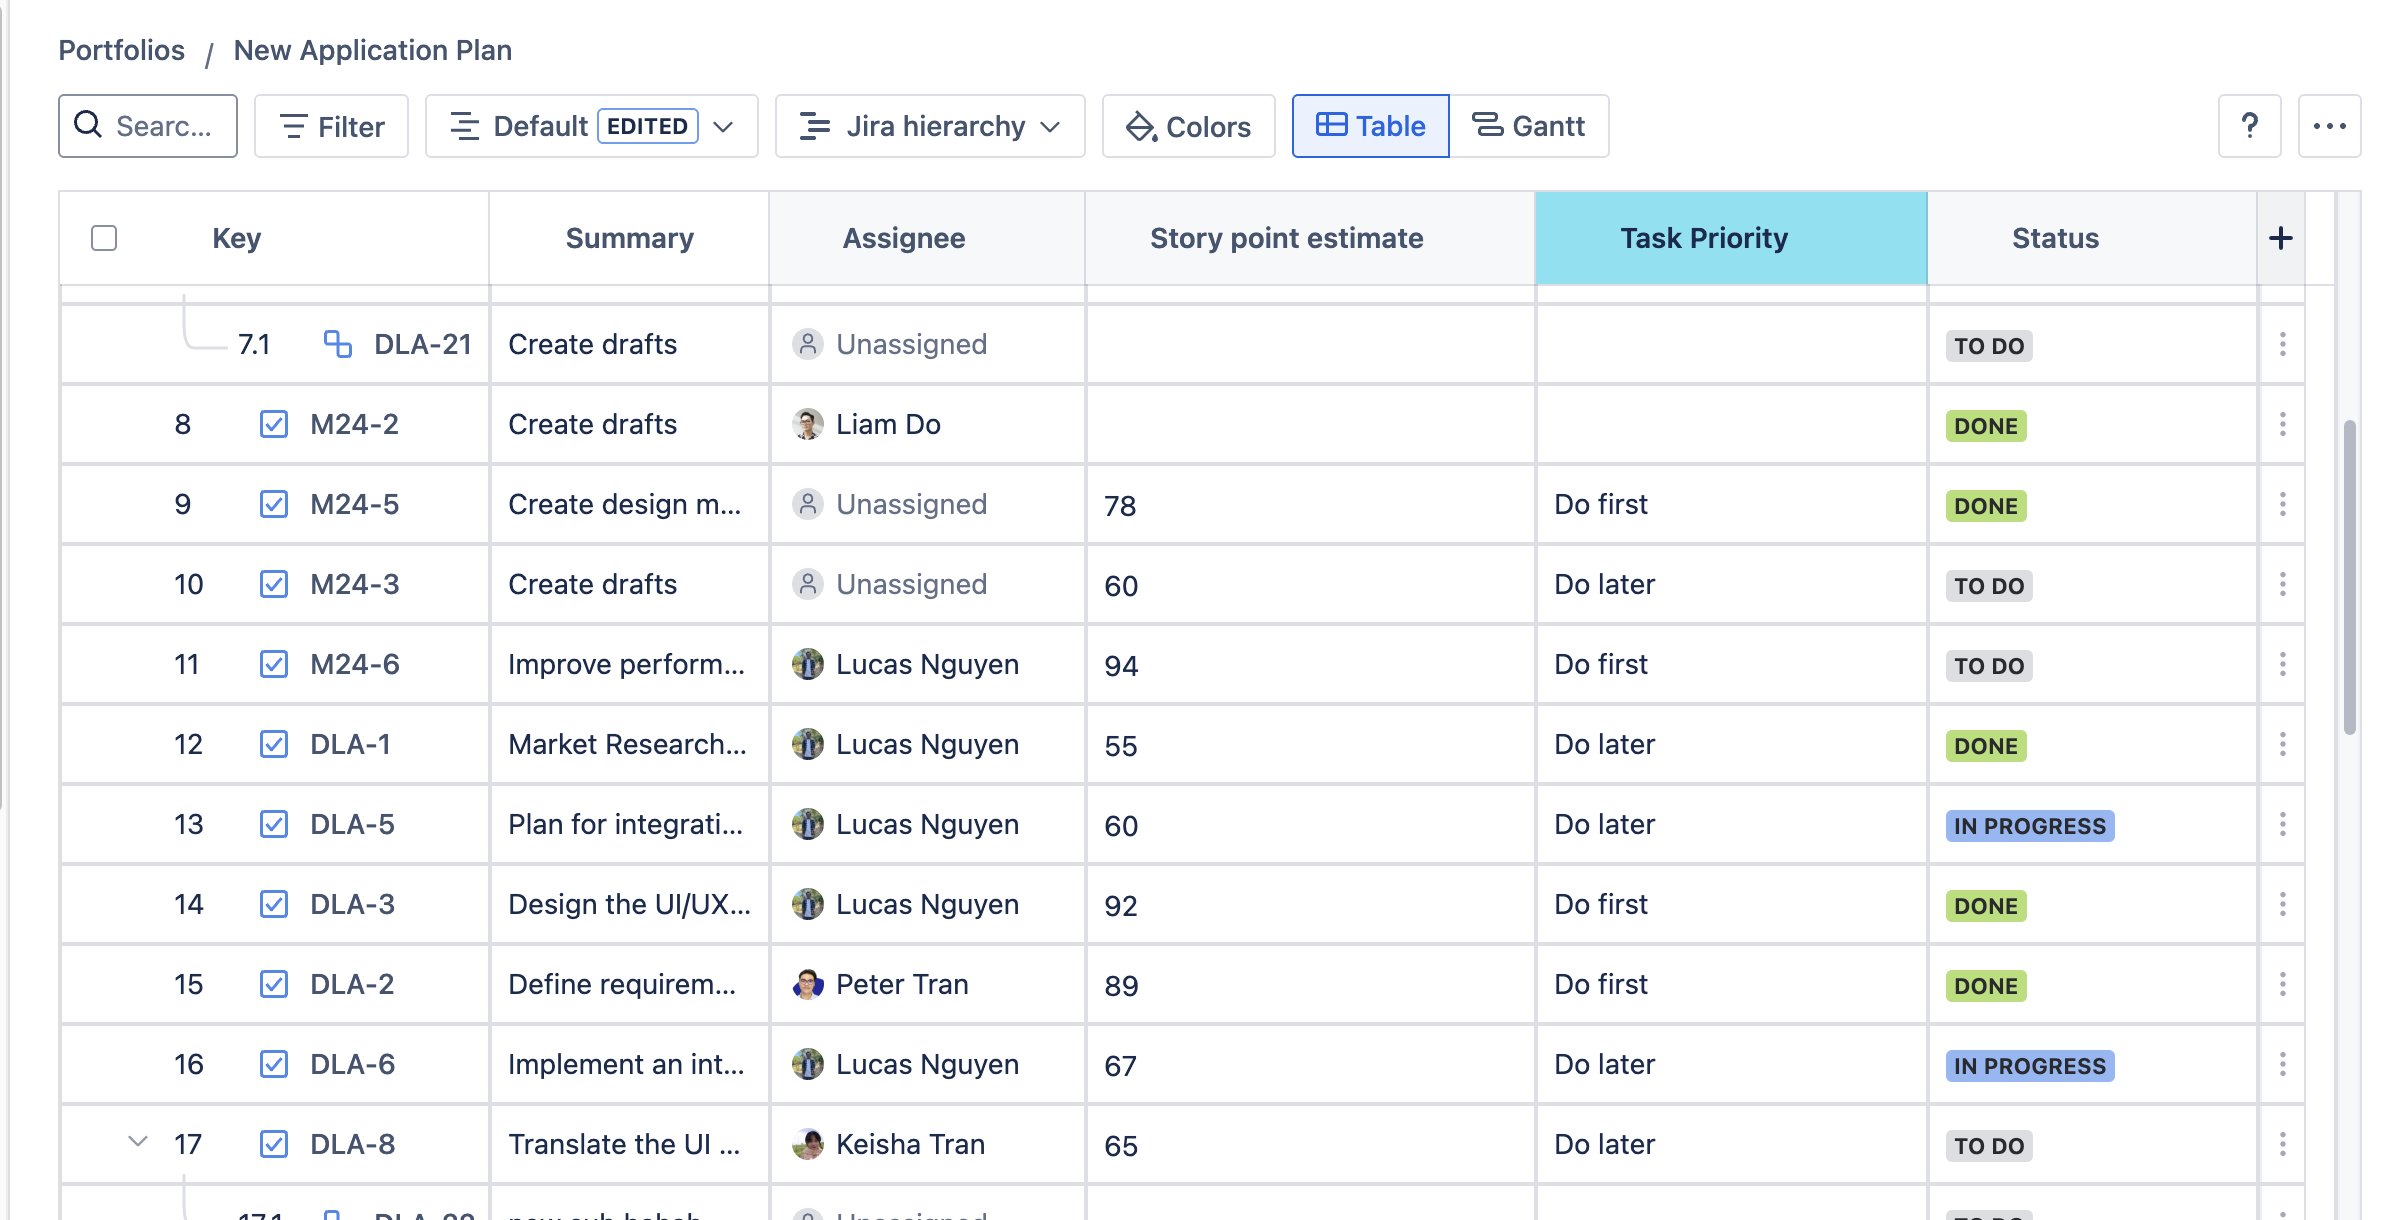
EXAMPLE
To create a Smart column to identify which tasks should be done first or later based on the Story Point Estimate field, here is the custom formula you can use:
-
=IF( {Story point estimate} >= 70, “Do first”, “Do later”)
*How to use the Custom formula and syntax
To create a smart column using a custom formula, please follow these steps:
1. Choose the right column type. The Date type only supports date fields, while the Number column type only supports number-related fields for the formula.
2. In the Custom formula box, input = to trigger the formula. You can input the first letter to find the function you want to use.
3. To trigger a field mention, you need to add a Space [ ␣ ] first, then type { to select the Jira field.
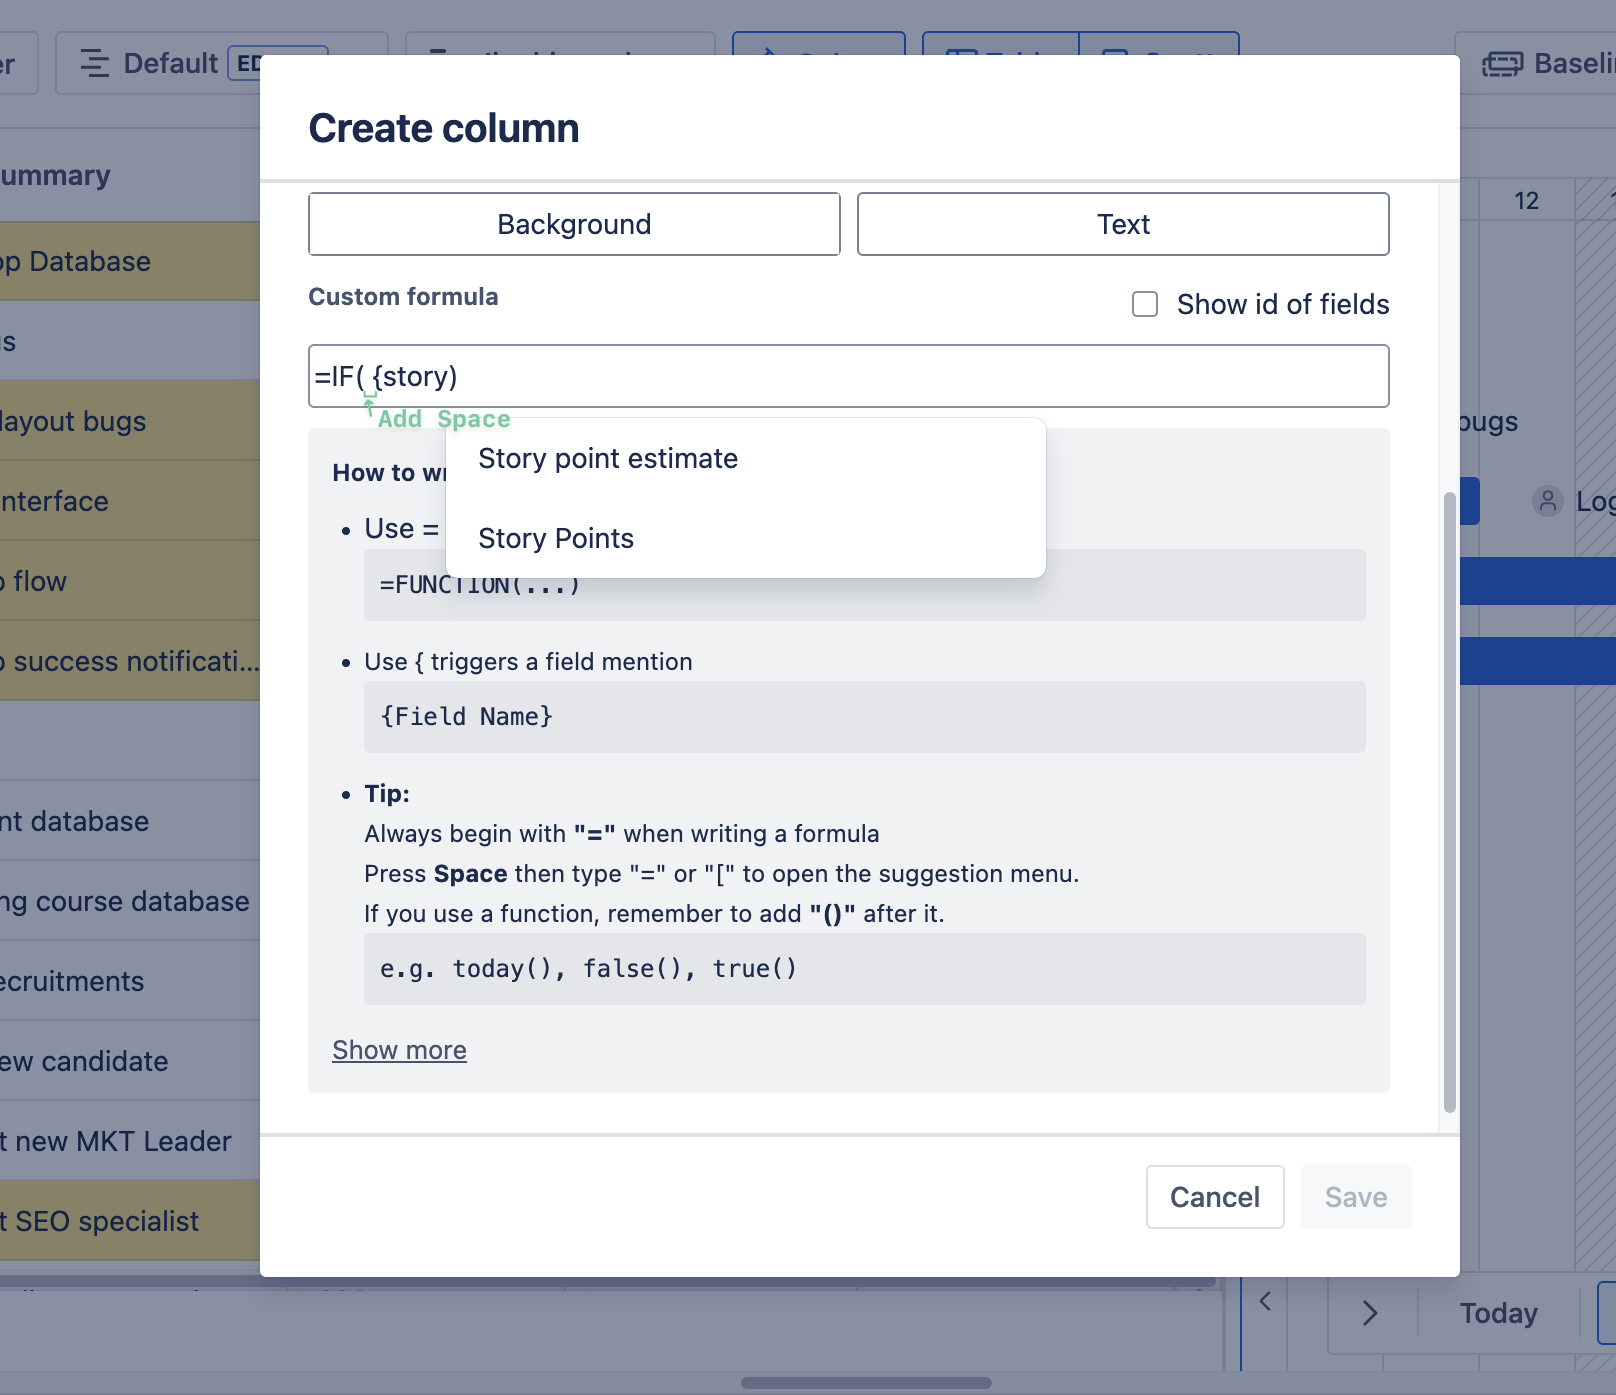
You can also use only the field triggers { } to make the custom formula.
Here is an example for a “minus” custom formula:
= {Number field 1} - {Number field 2}
or
=HF.MINUS( {Number field 1}, (Number field 2} )
*Notes for using Custom formulas
When using the Custom formula, there are a few things you need to keep in mind:
-
Always begin with 🟰.
-
If you use a function, remember to add
()after it. ( e.g. today(), false(), true() ) -
The Custom formula does not support copying and pasting syntax from other sources. You are required to add syntax manually.
-
You need to select fields DIRECTLY in the selection box.
-
If you want to edit fields in the syntax, you are required to delete {Field1}, {Field2} in it and add new fields again.
Time in status 5.0.0
GanttTable supports the Time in Status feature to reflect actual working hours and provide more accurate and meaningful reporting for its users.
The calculation for Time in Status reflects the defined working schedules (e.g., 8 working hours per day, 5 working days per week) rather than relying on continuous calendar time (24/7). That excludes non-working periods such as weekends or lunch breaks.
To make the calculation more realistic and aligned with actual working time, GanttTable also supports configurable working days, working hours, and break hours in the Work schedule settings.
To add a Time in status column, click the ➕ icon to add a new column. Then, click on the Time in Status tab.
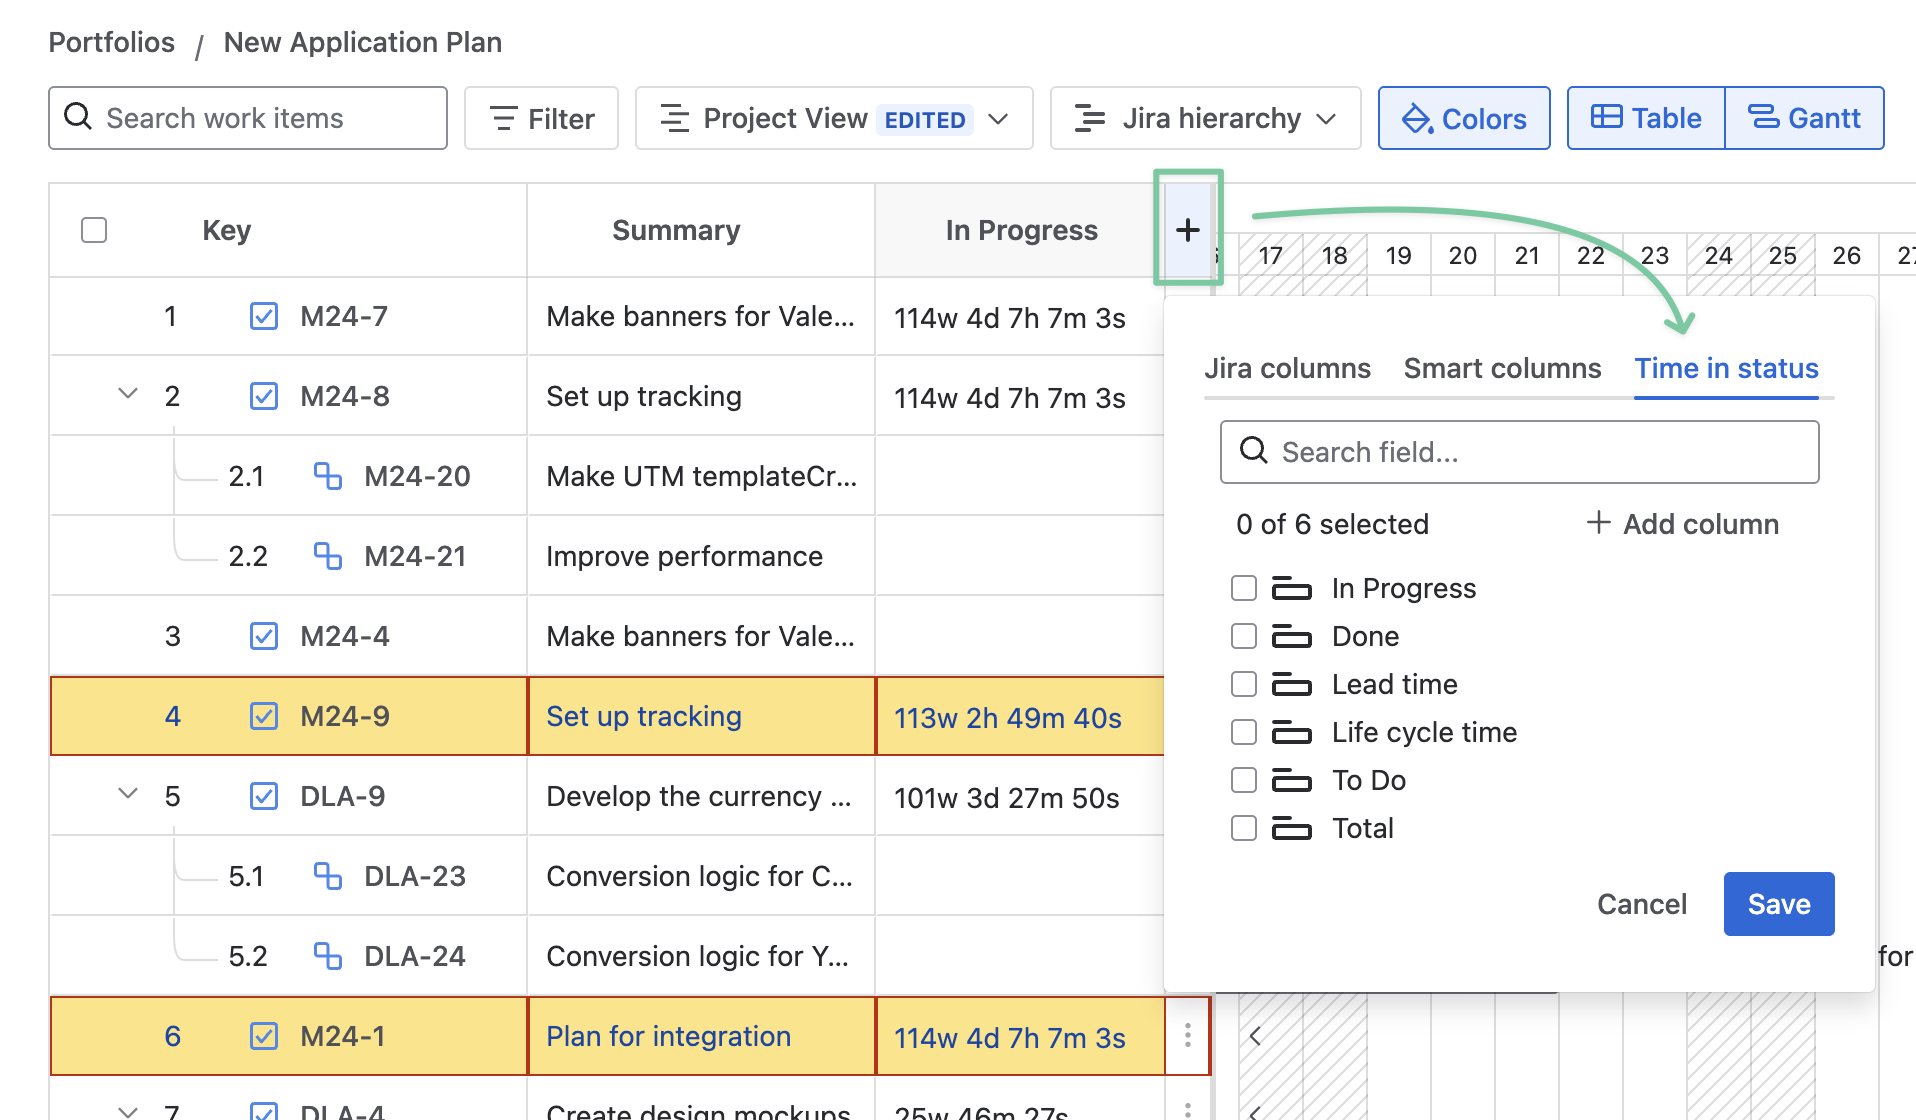
By default, the Time in status refers to calculating the time spent on each work item for each status in the user’s Jira space:
-
To do
-
In progress
-
Done
-
Other custom statuses created in the Jira space
GanttTable also supports 3 other calculations to analyze their efficiency:
|
Time in status type |
Description |
|---|---|
|
Lead time |
Calculate the total time that a work item spends before and during active work |
|
Life cycle time |
Calculate the total time that a work item takes to complete when work has started. |
|
Total |
Calculate the total time that a work item spends across all statuses. |
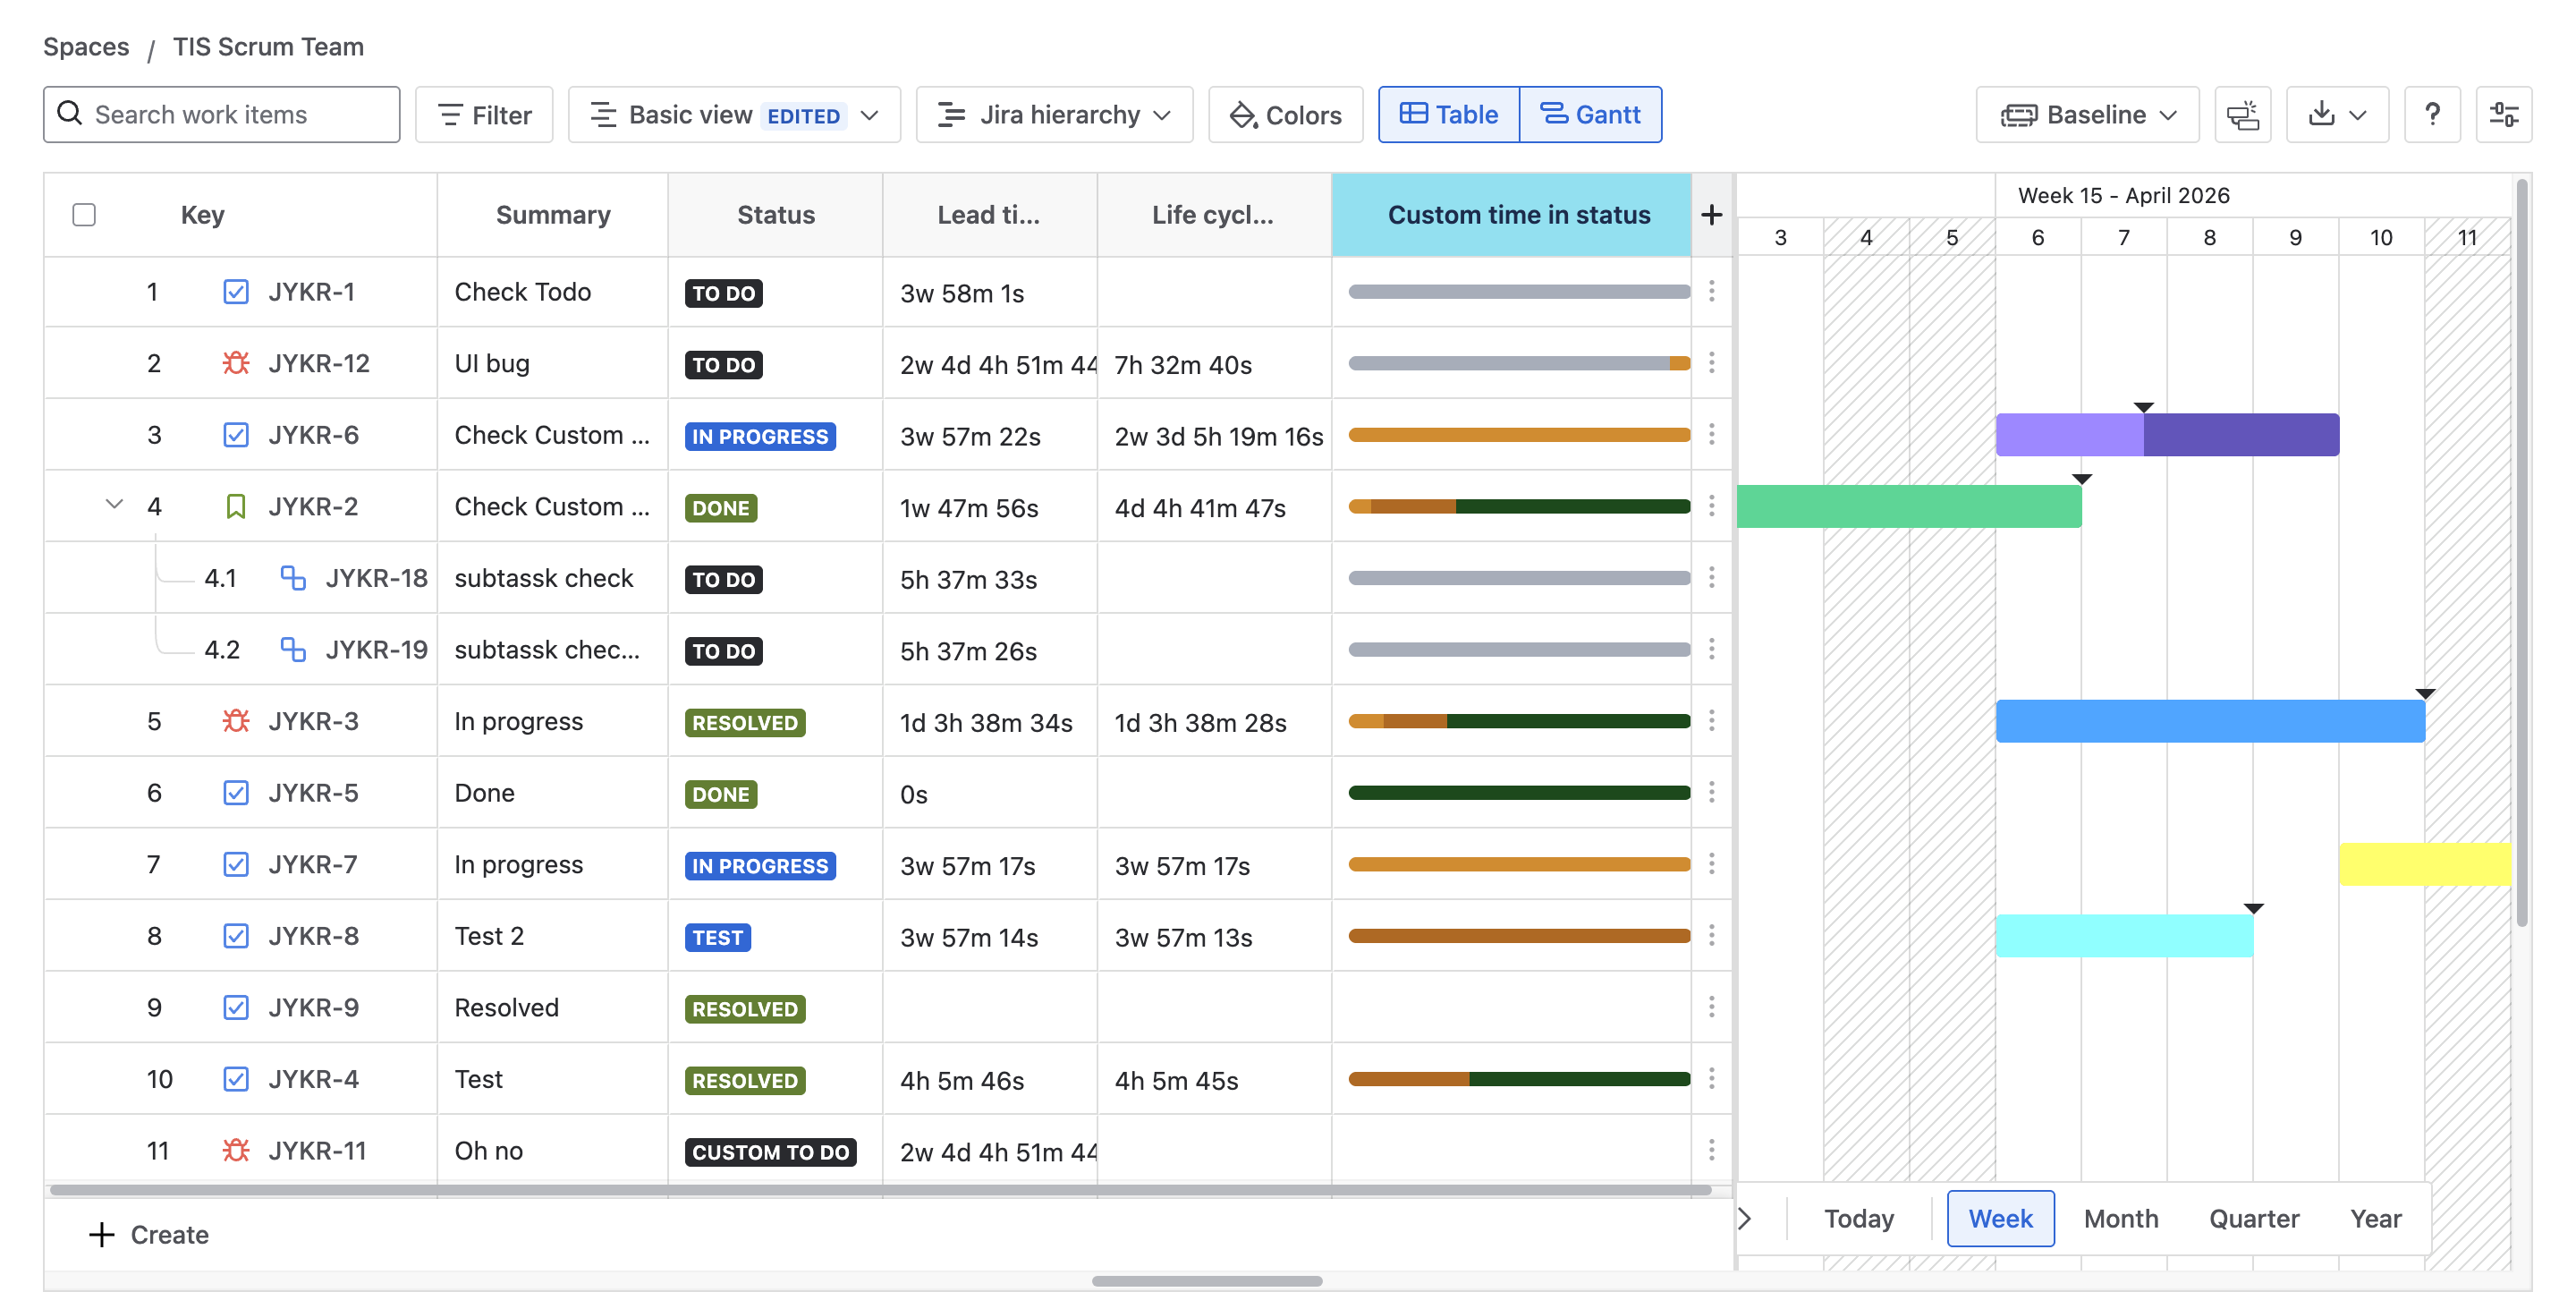
1. Custom Time in status column
Users can add a custom Time in status column to GanttTable to calculate the total time for a work item across all included statuses.
To create a custom column, click + Add column in the Time in status tab.
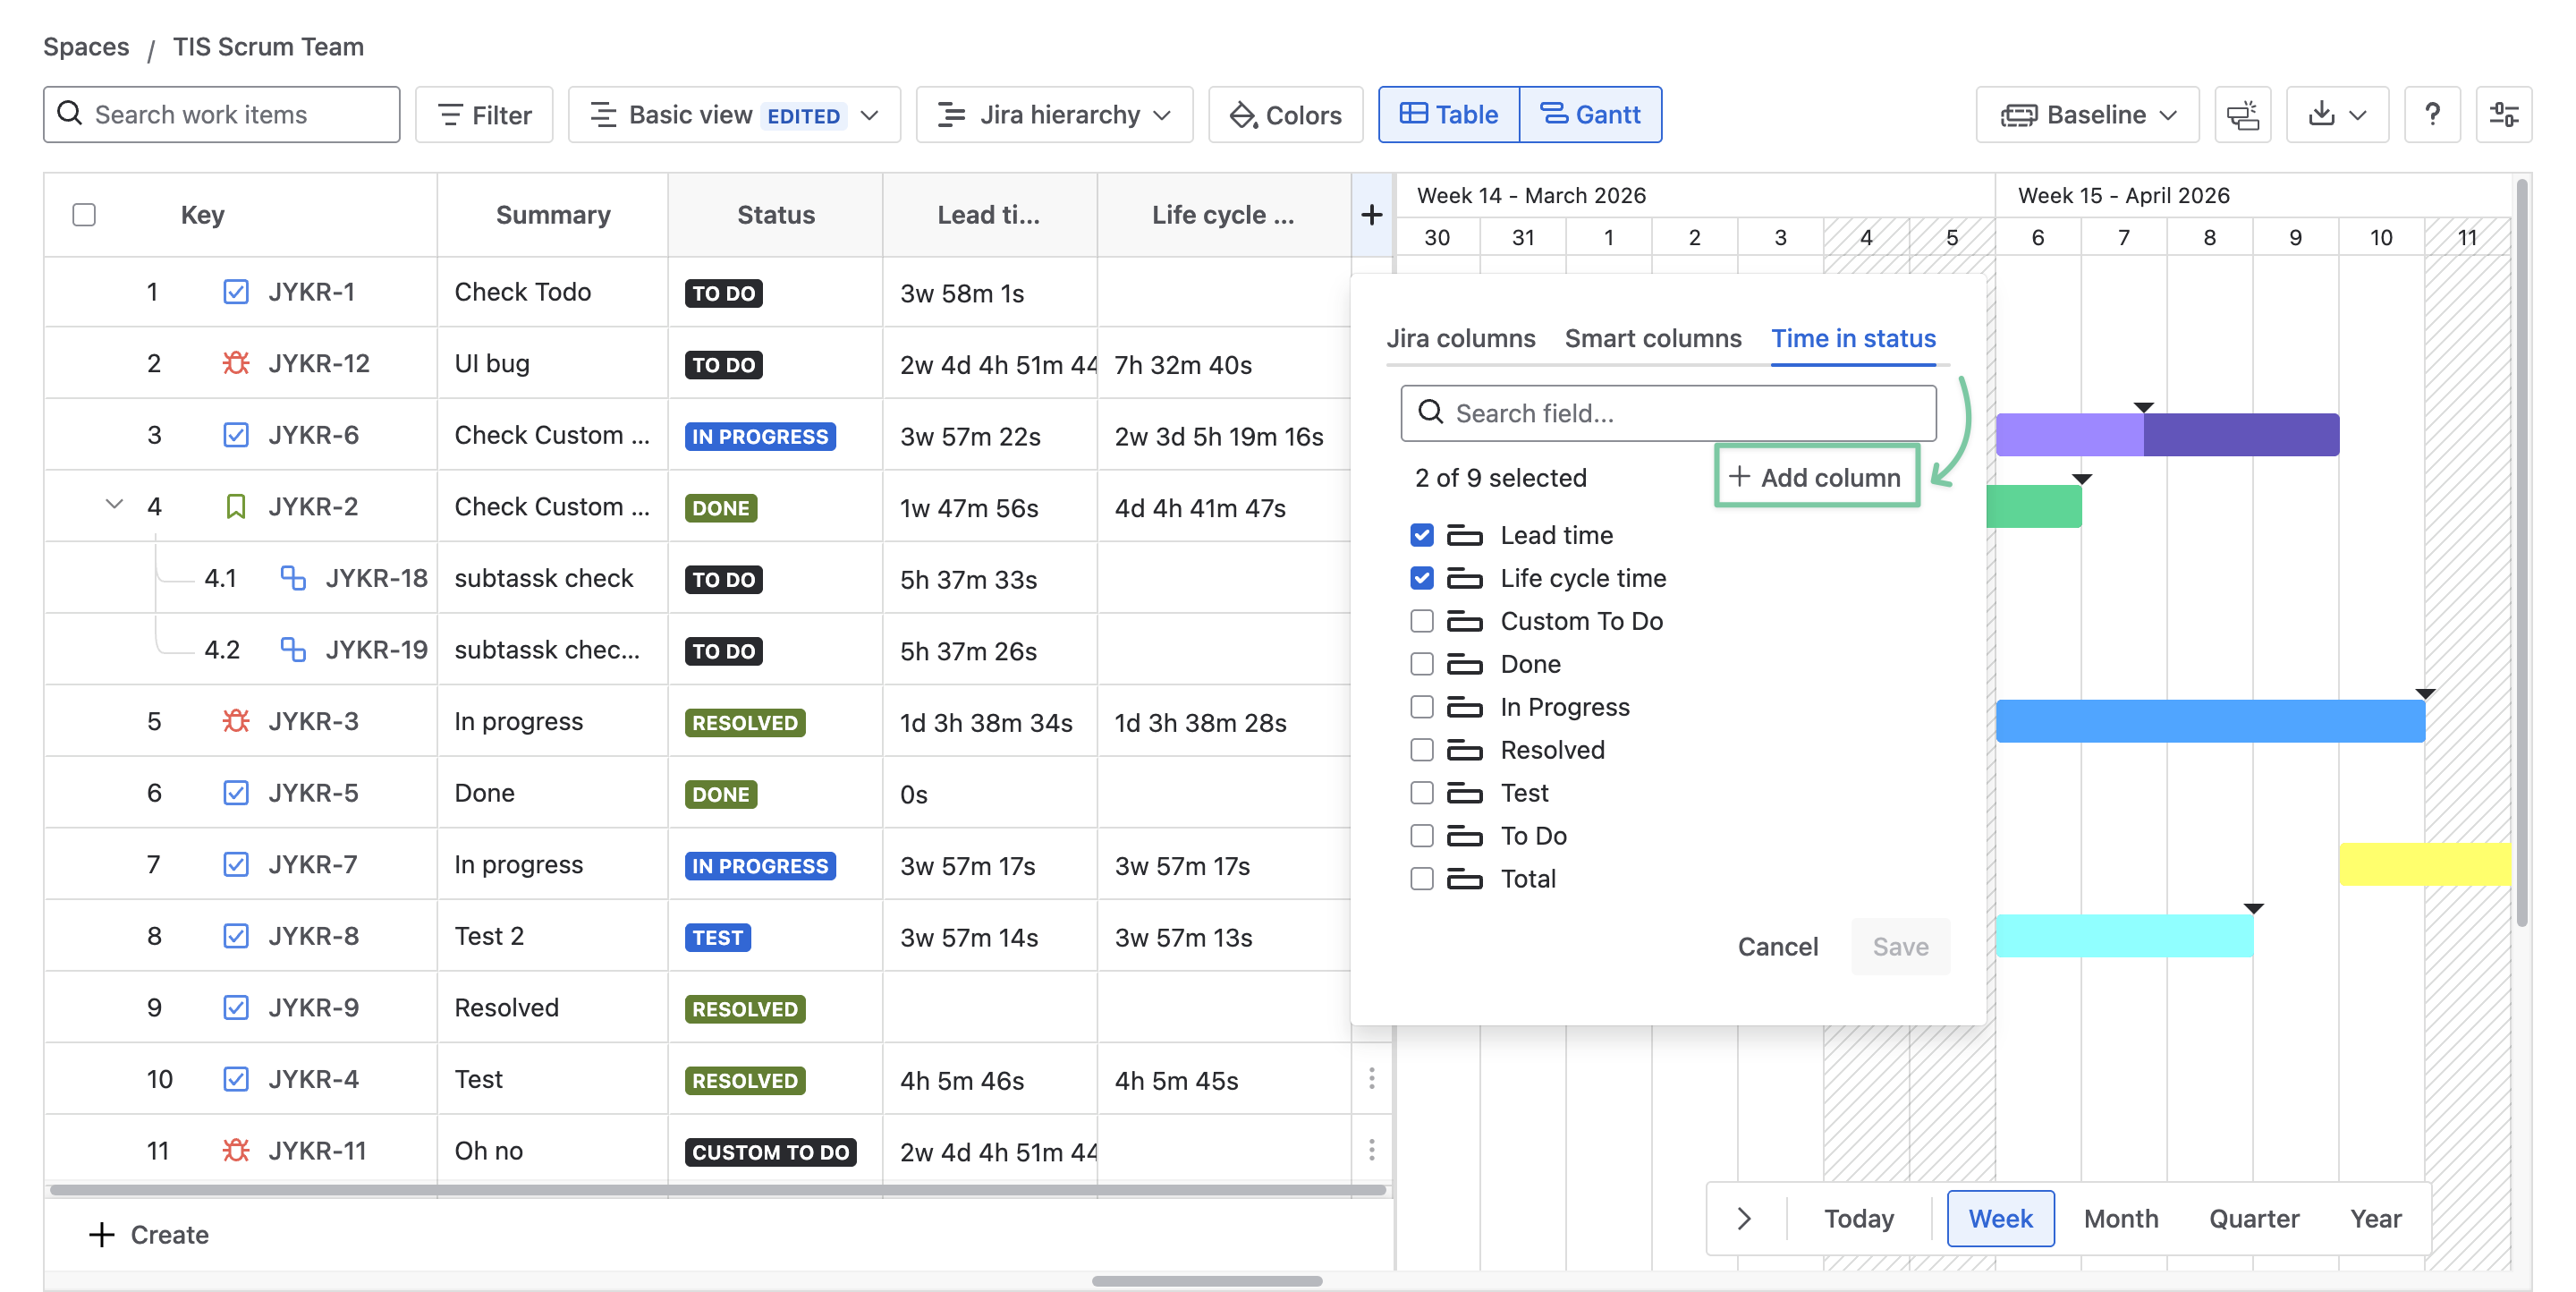
In the dialog, users can name this custom Time in status column and choose the View format.
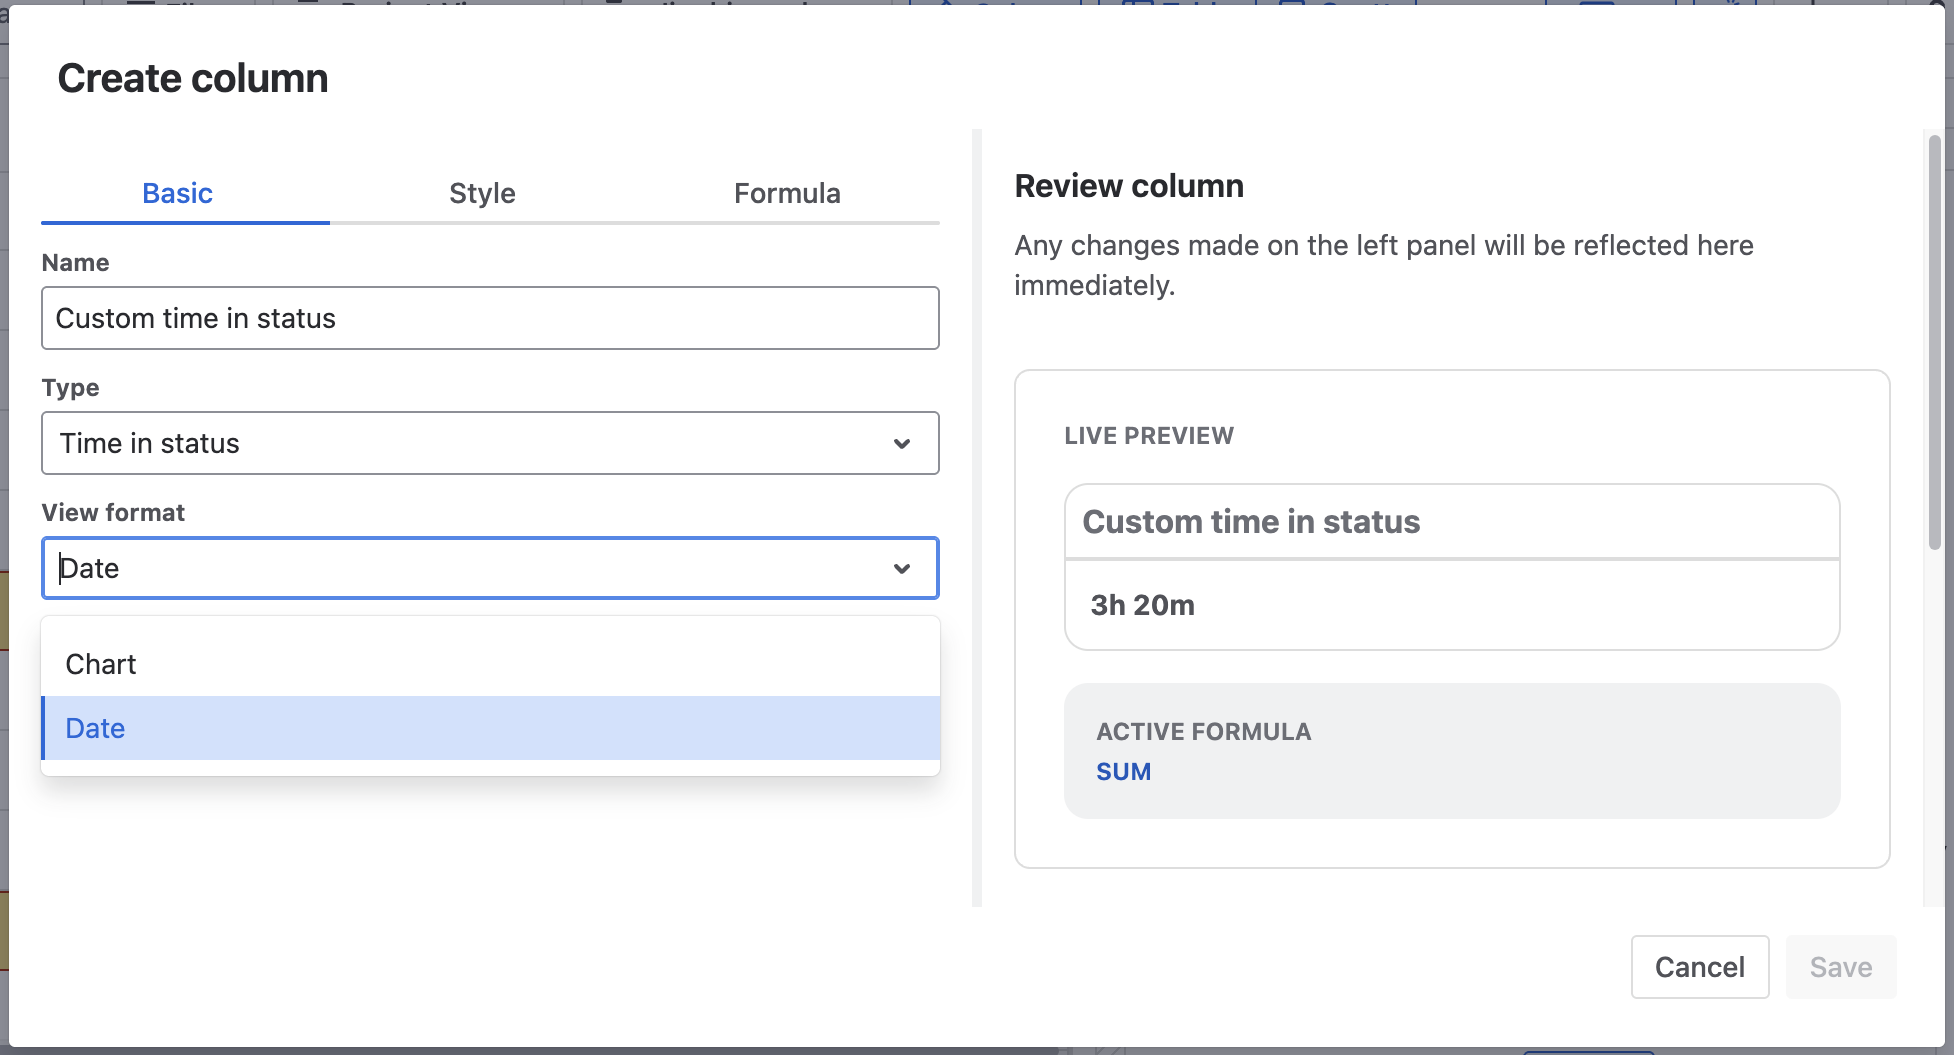
Currently, GanttTable supports 2 view formats:
-
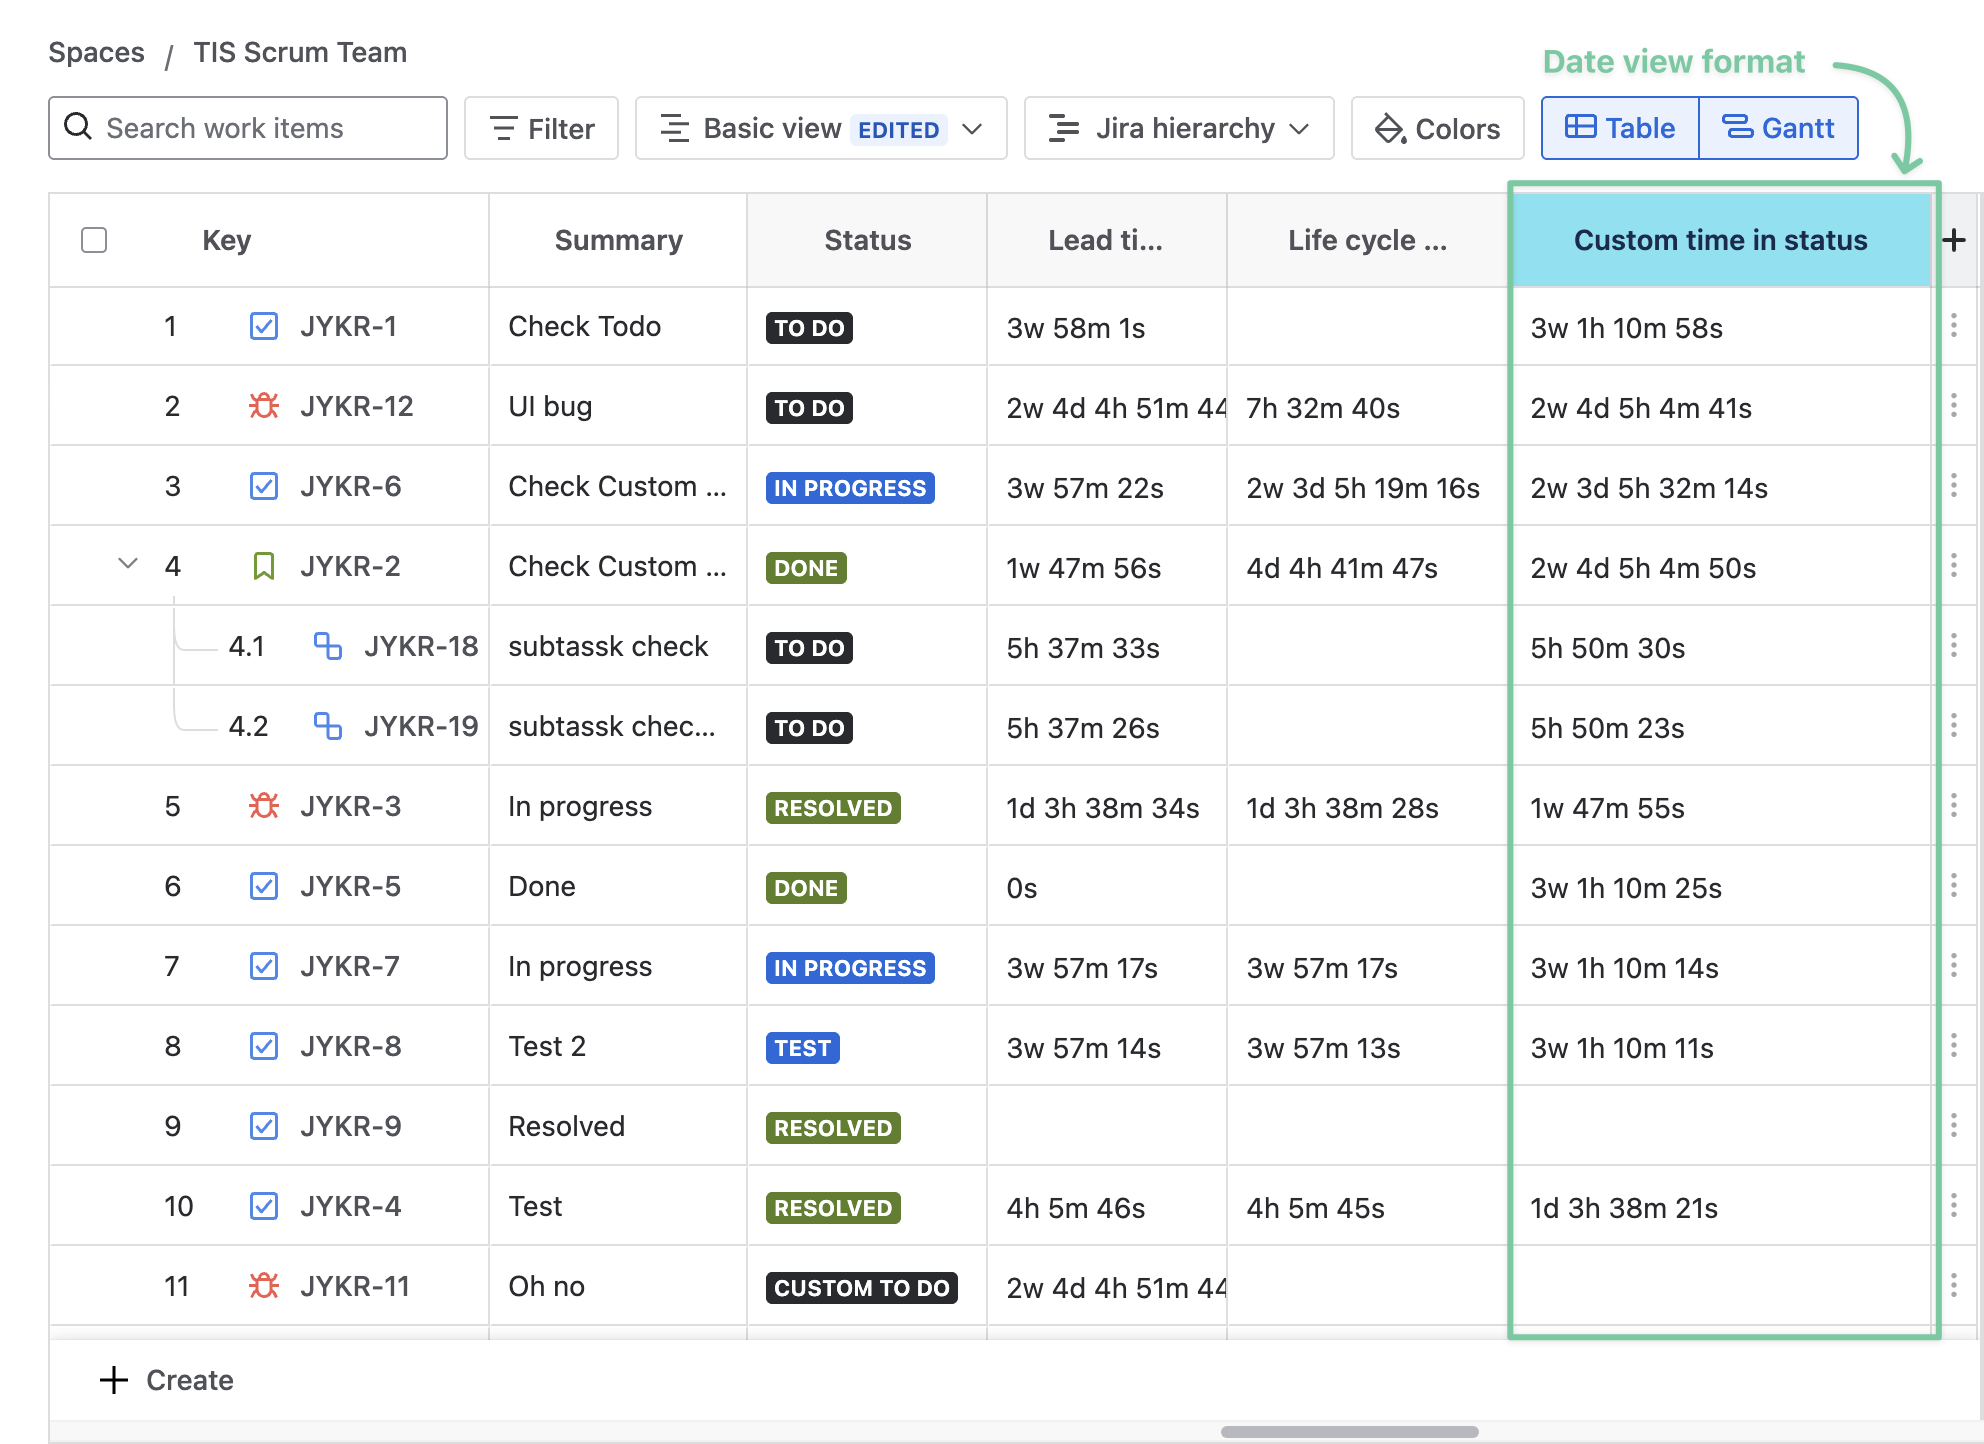
Date view: Display time as a formatted duration based on the selected statuses
-
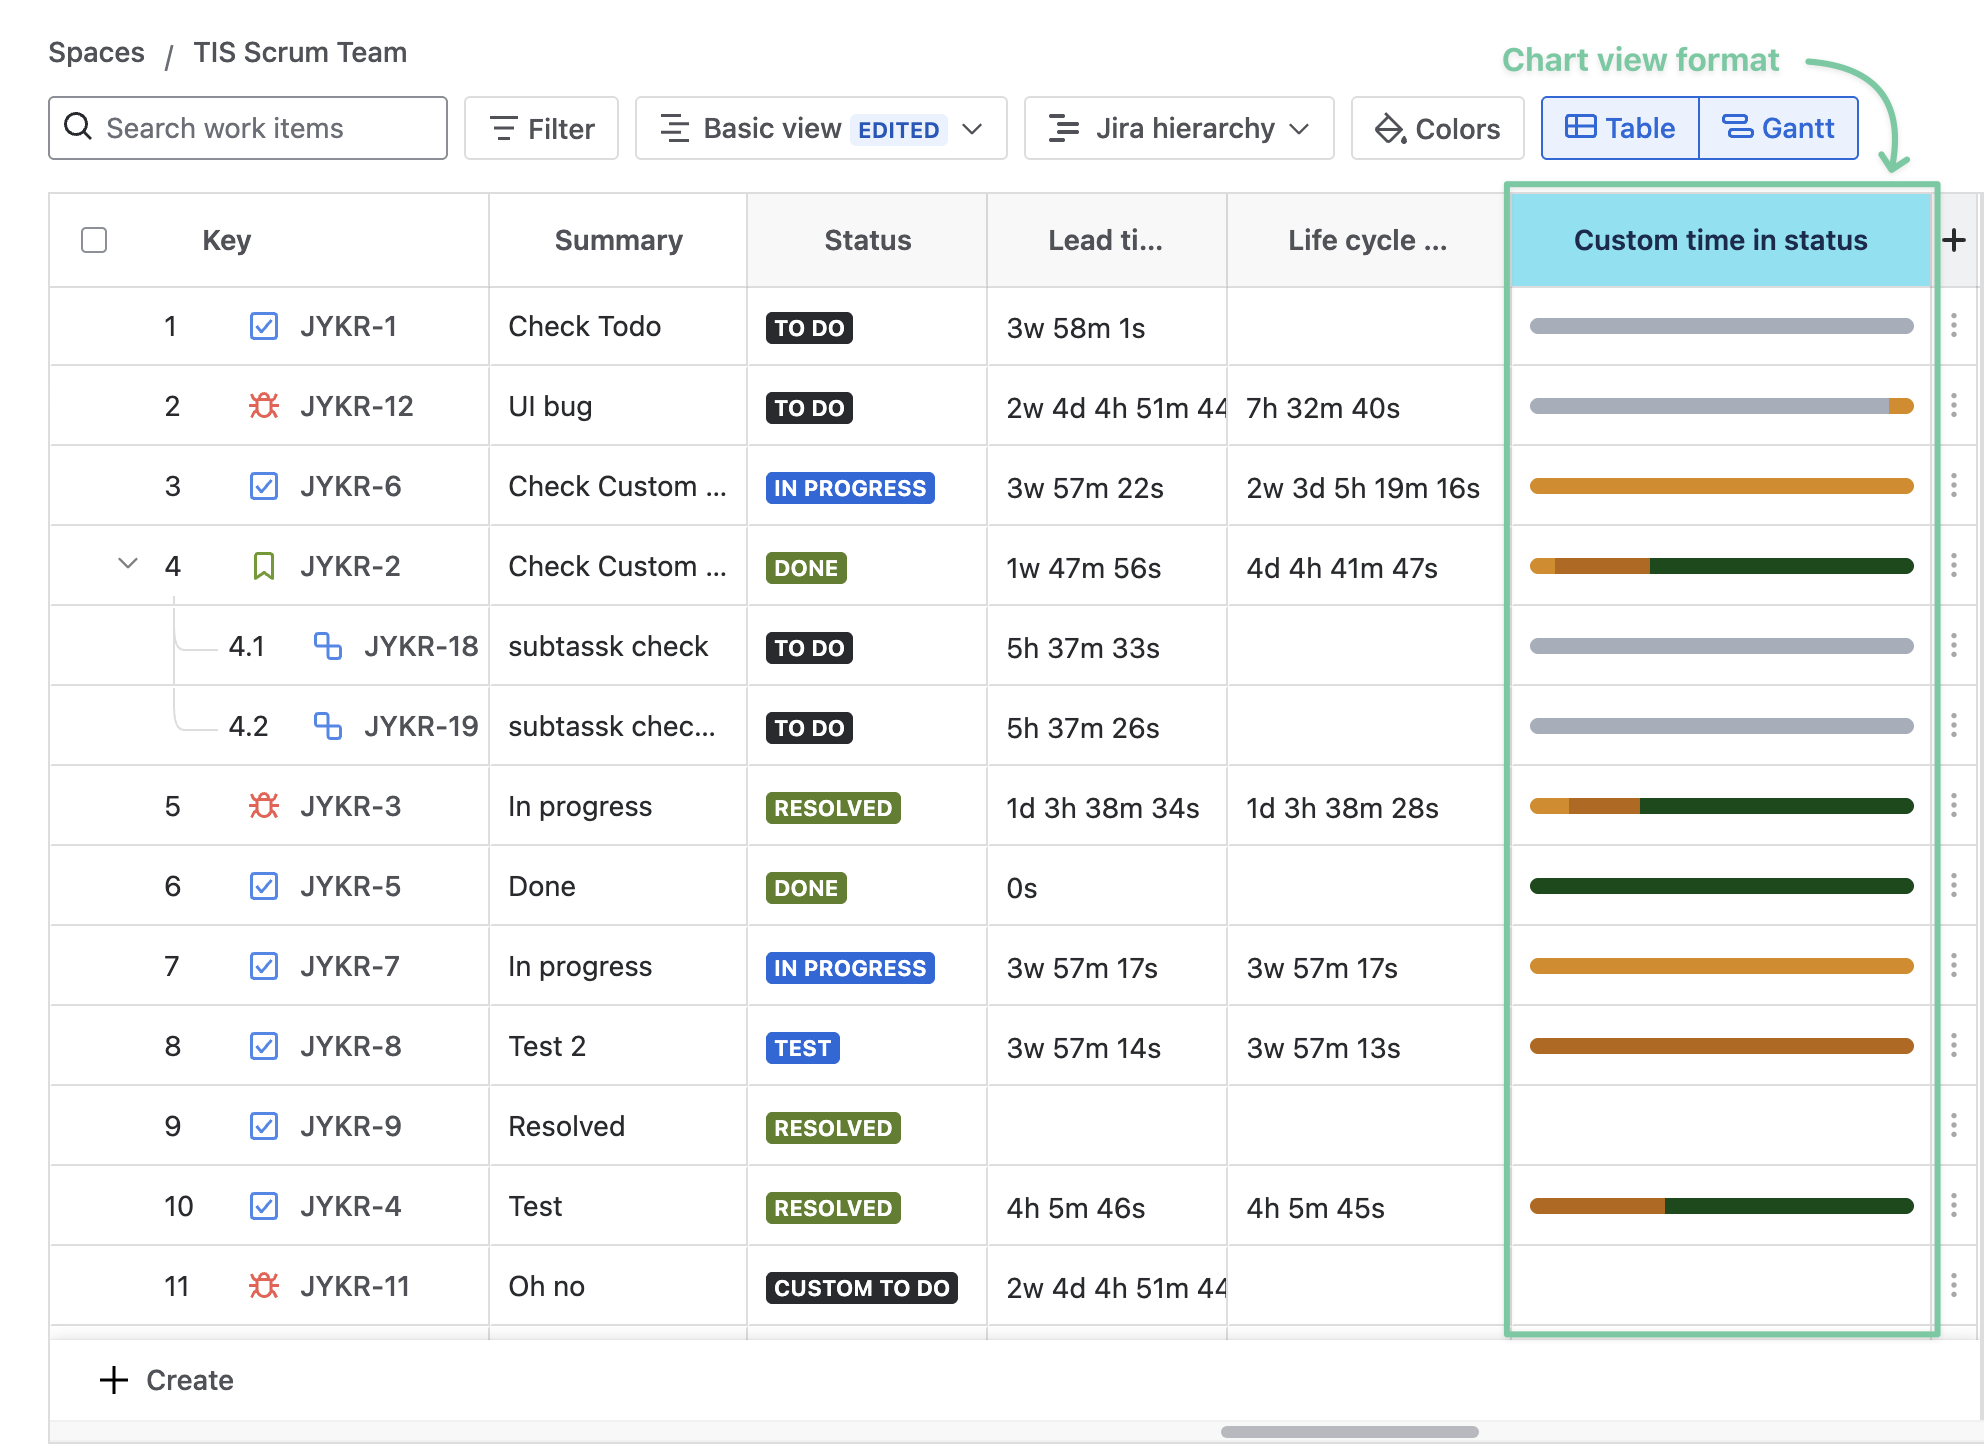
Chart view: Display time as a progress bar based on the selected statuses.
There is also a live preview to help you decide which format suits your needs.
TIP
By using custom time in status, users can use the Date view to calculate the total time a work item spends in selected statuses, while the Chart view can be used to compare the time spent across different statuses for an overview of how work progressed.
*When using the Date view:
*When using the Chart view:
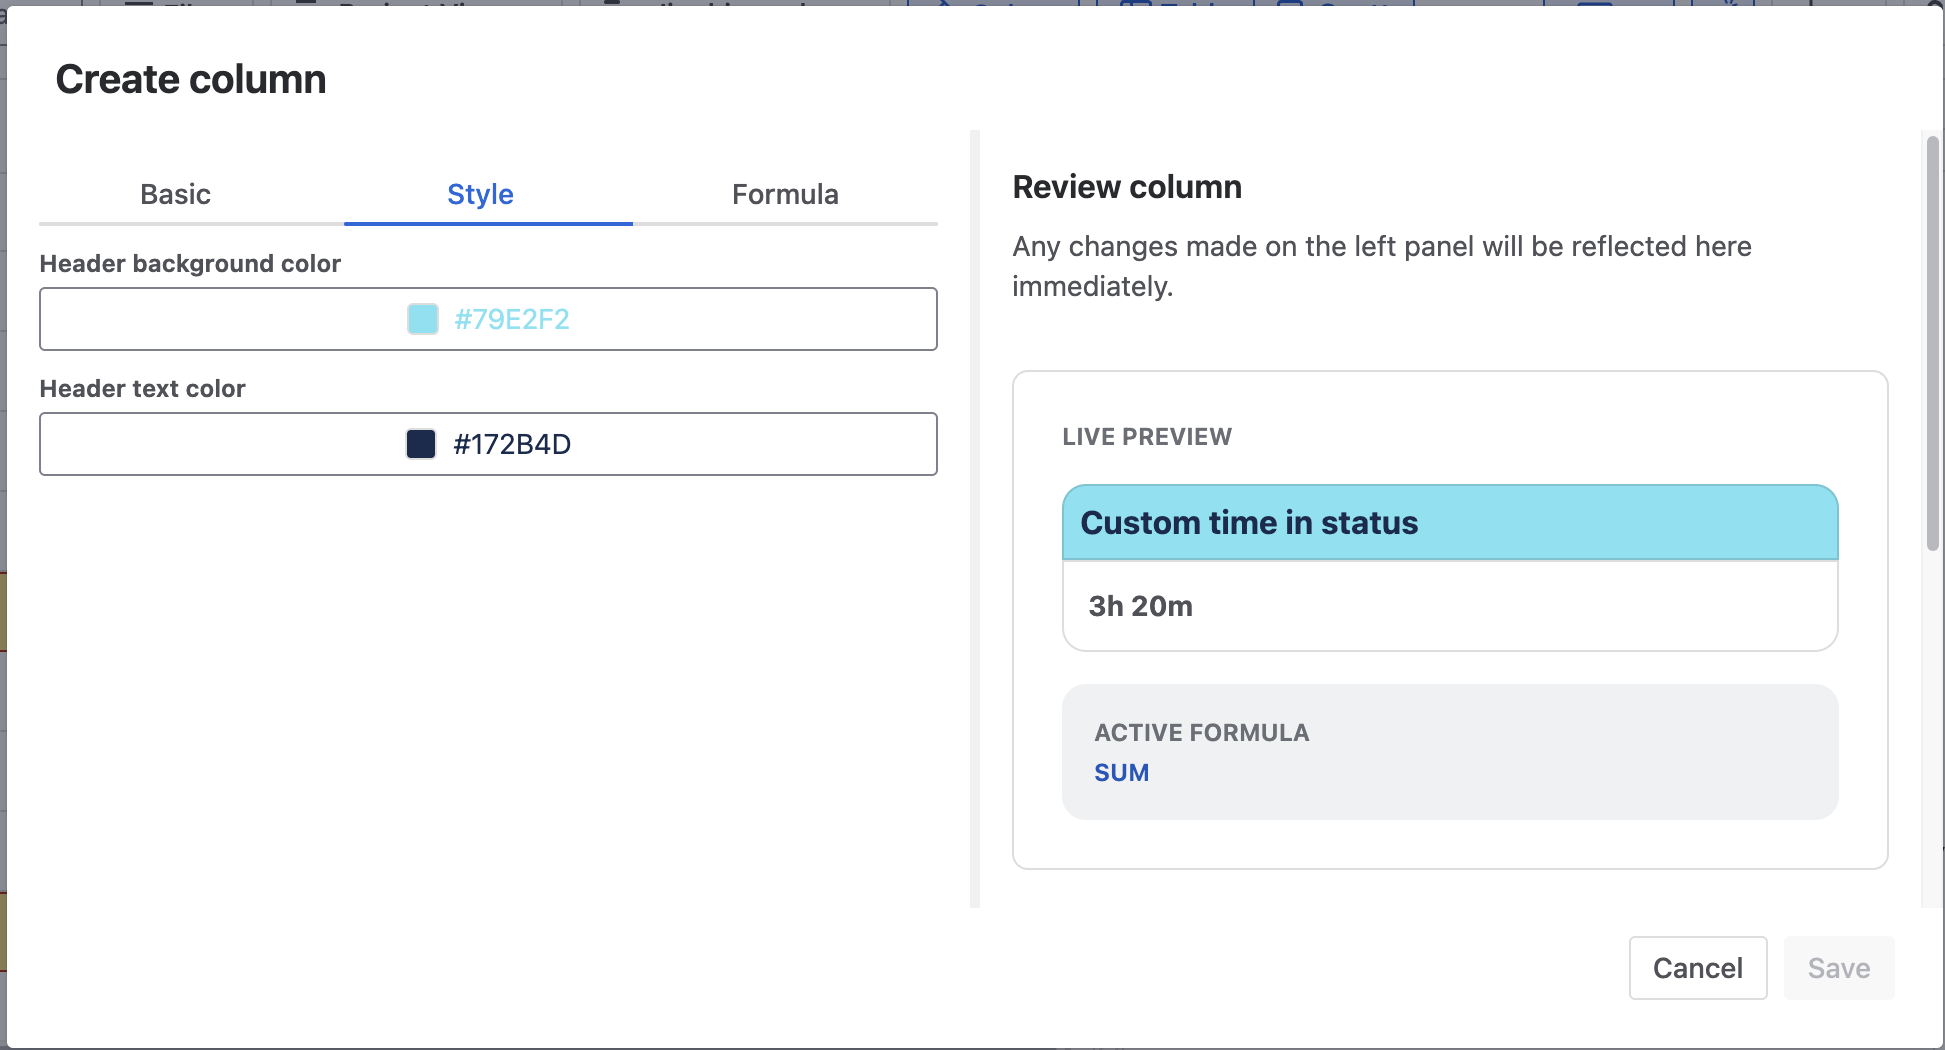
Next, users can decide on a style for this column by choosing:
-
Header background color
-
Heder text color
In Formula, users can select which field statuses to use in this column.
It requires at least 2 fields to perform the calculation.
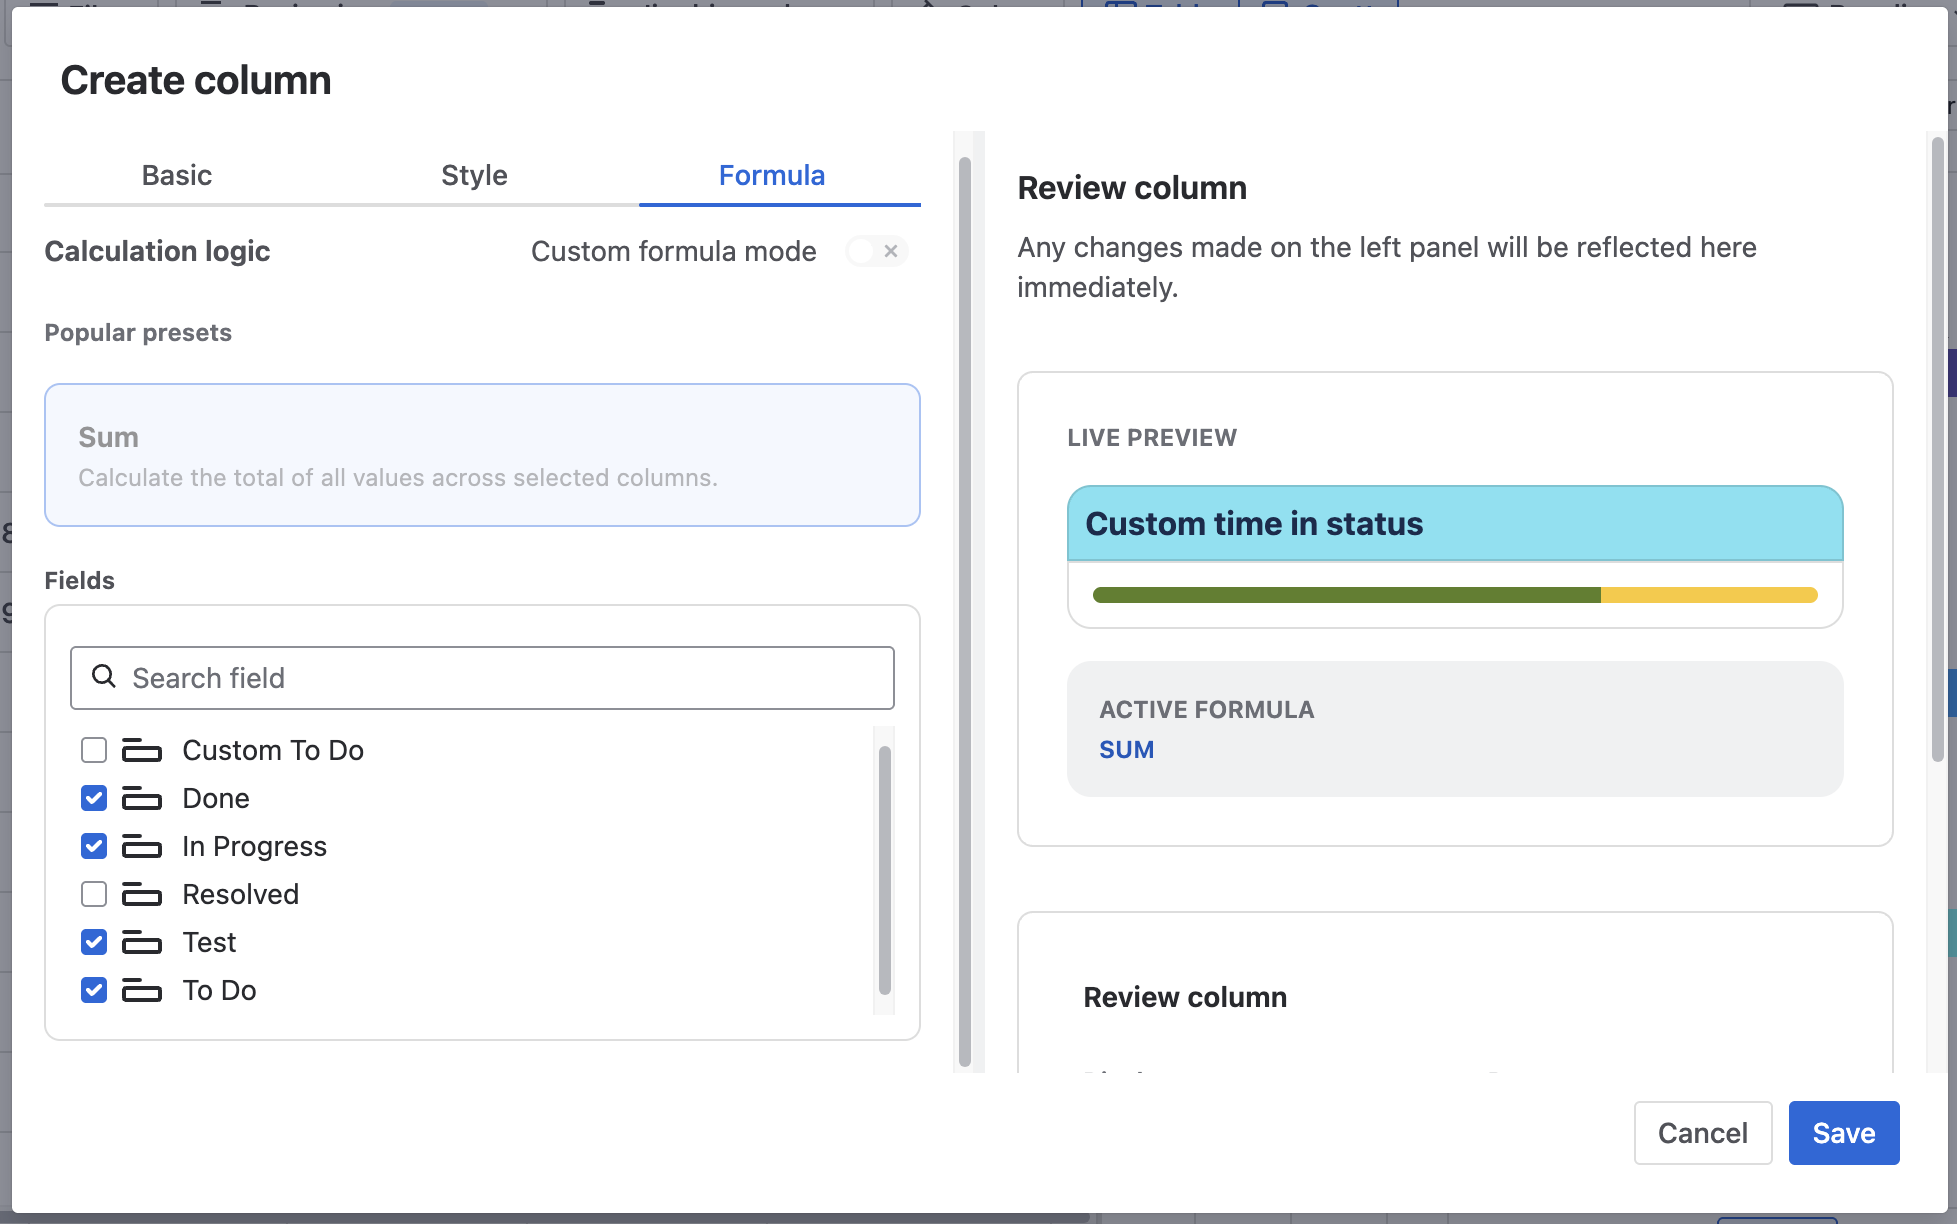
Once done, click Save to add this custom column to the table.
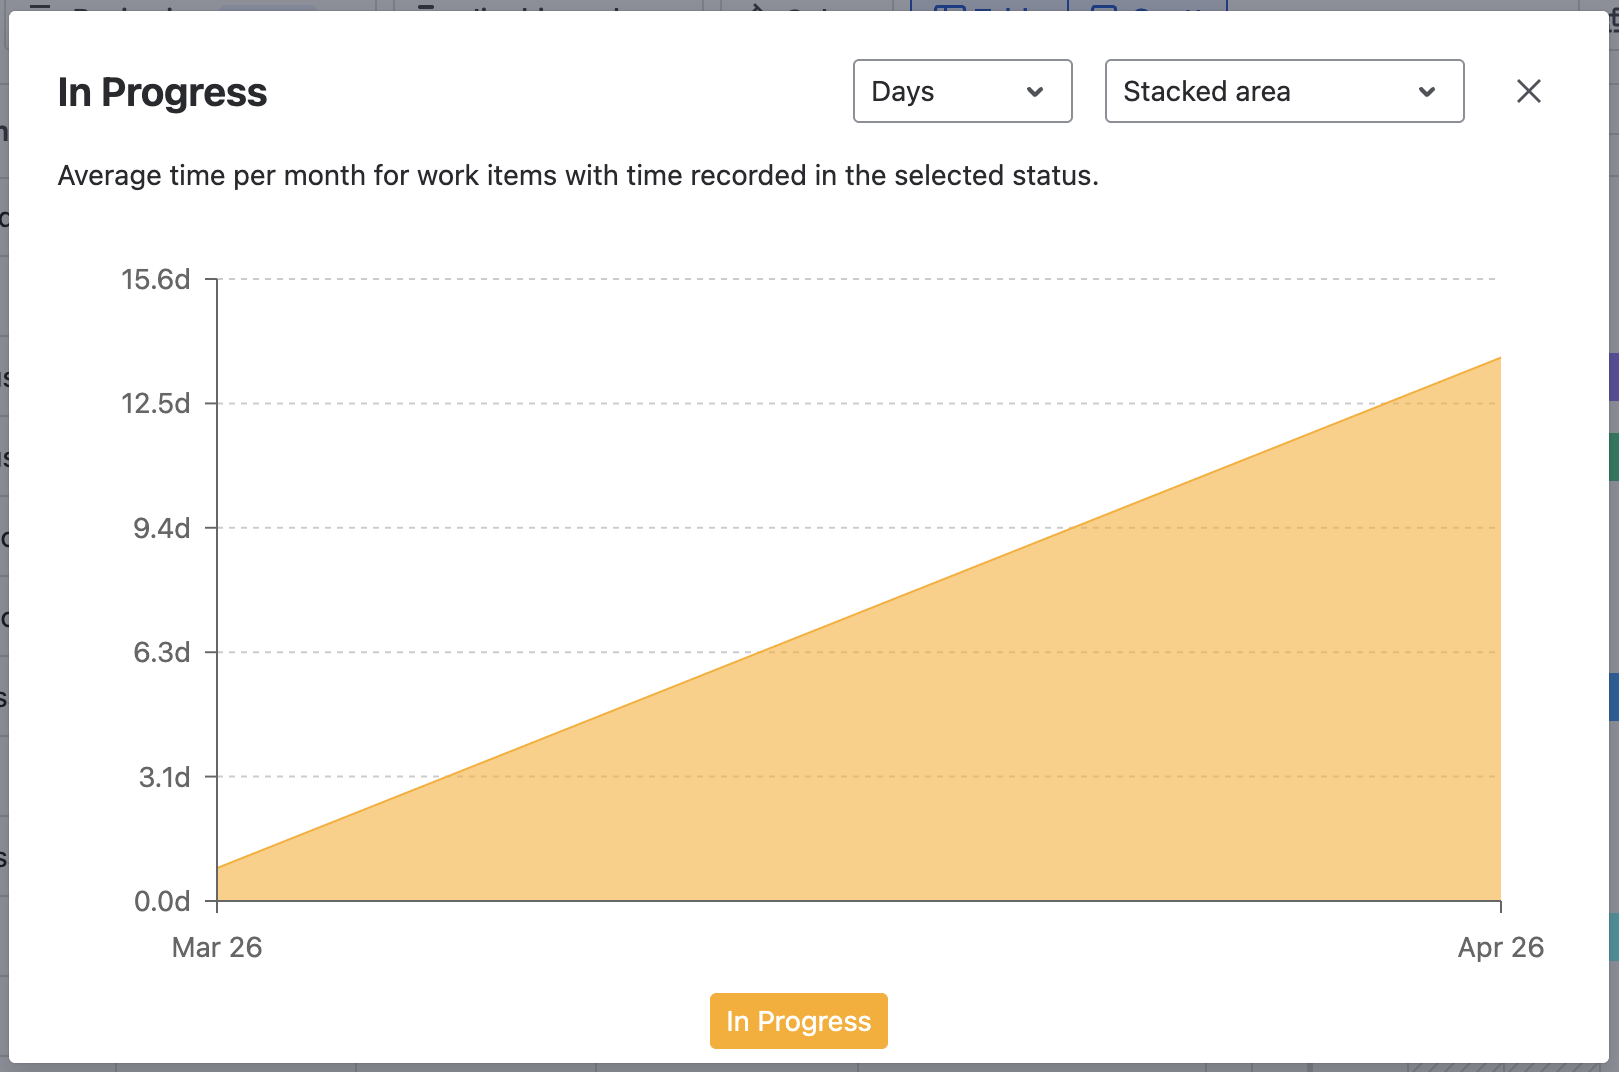
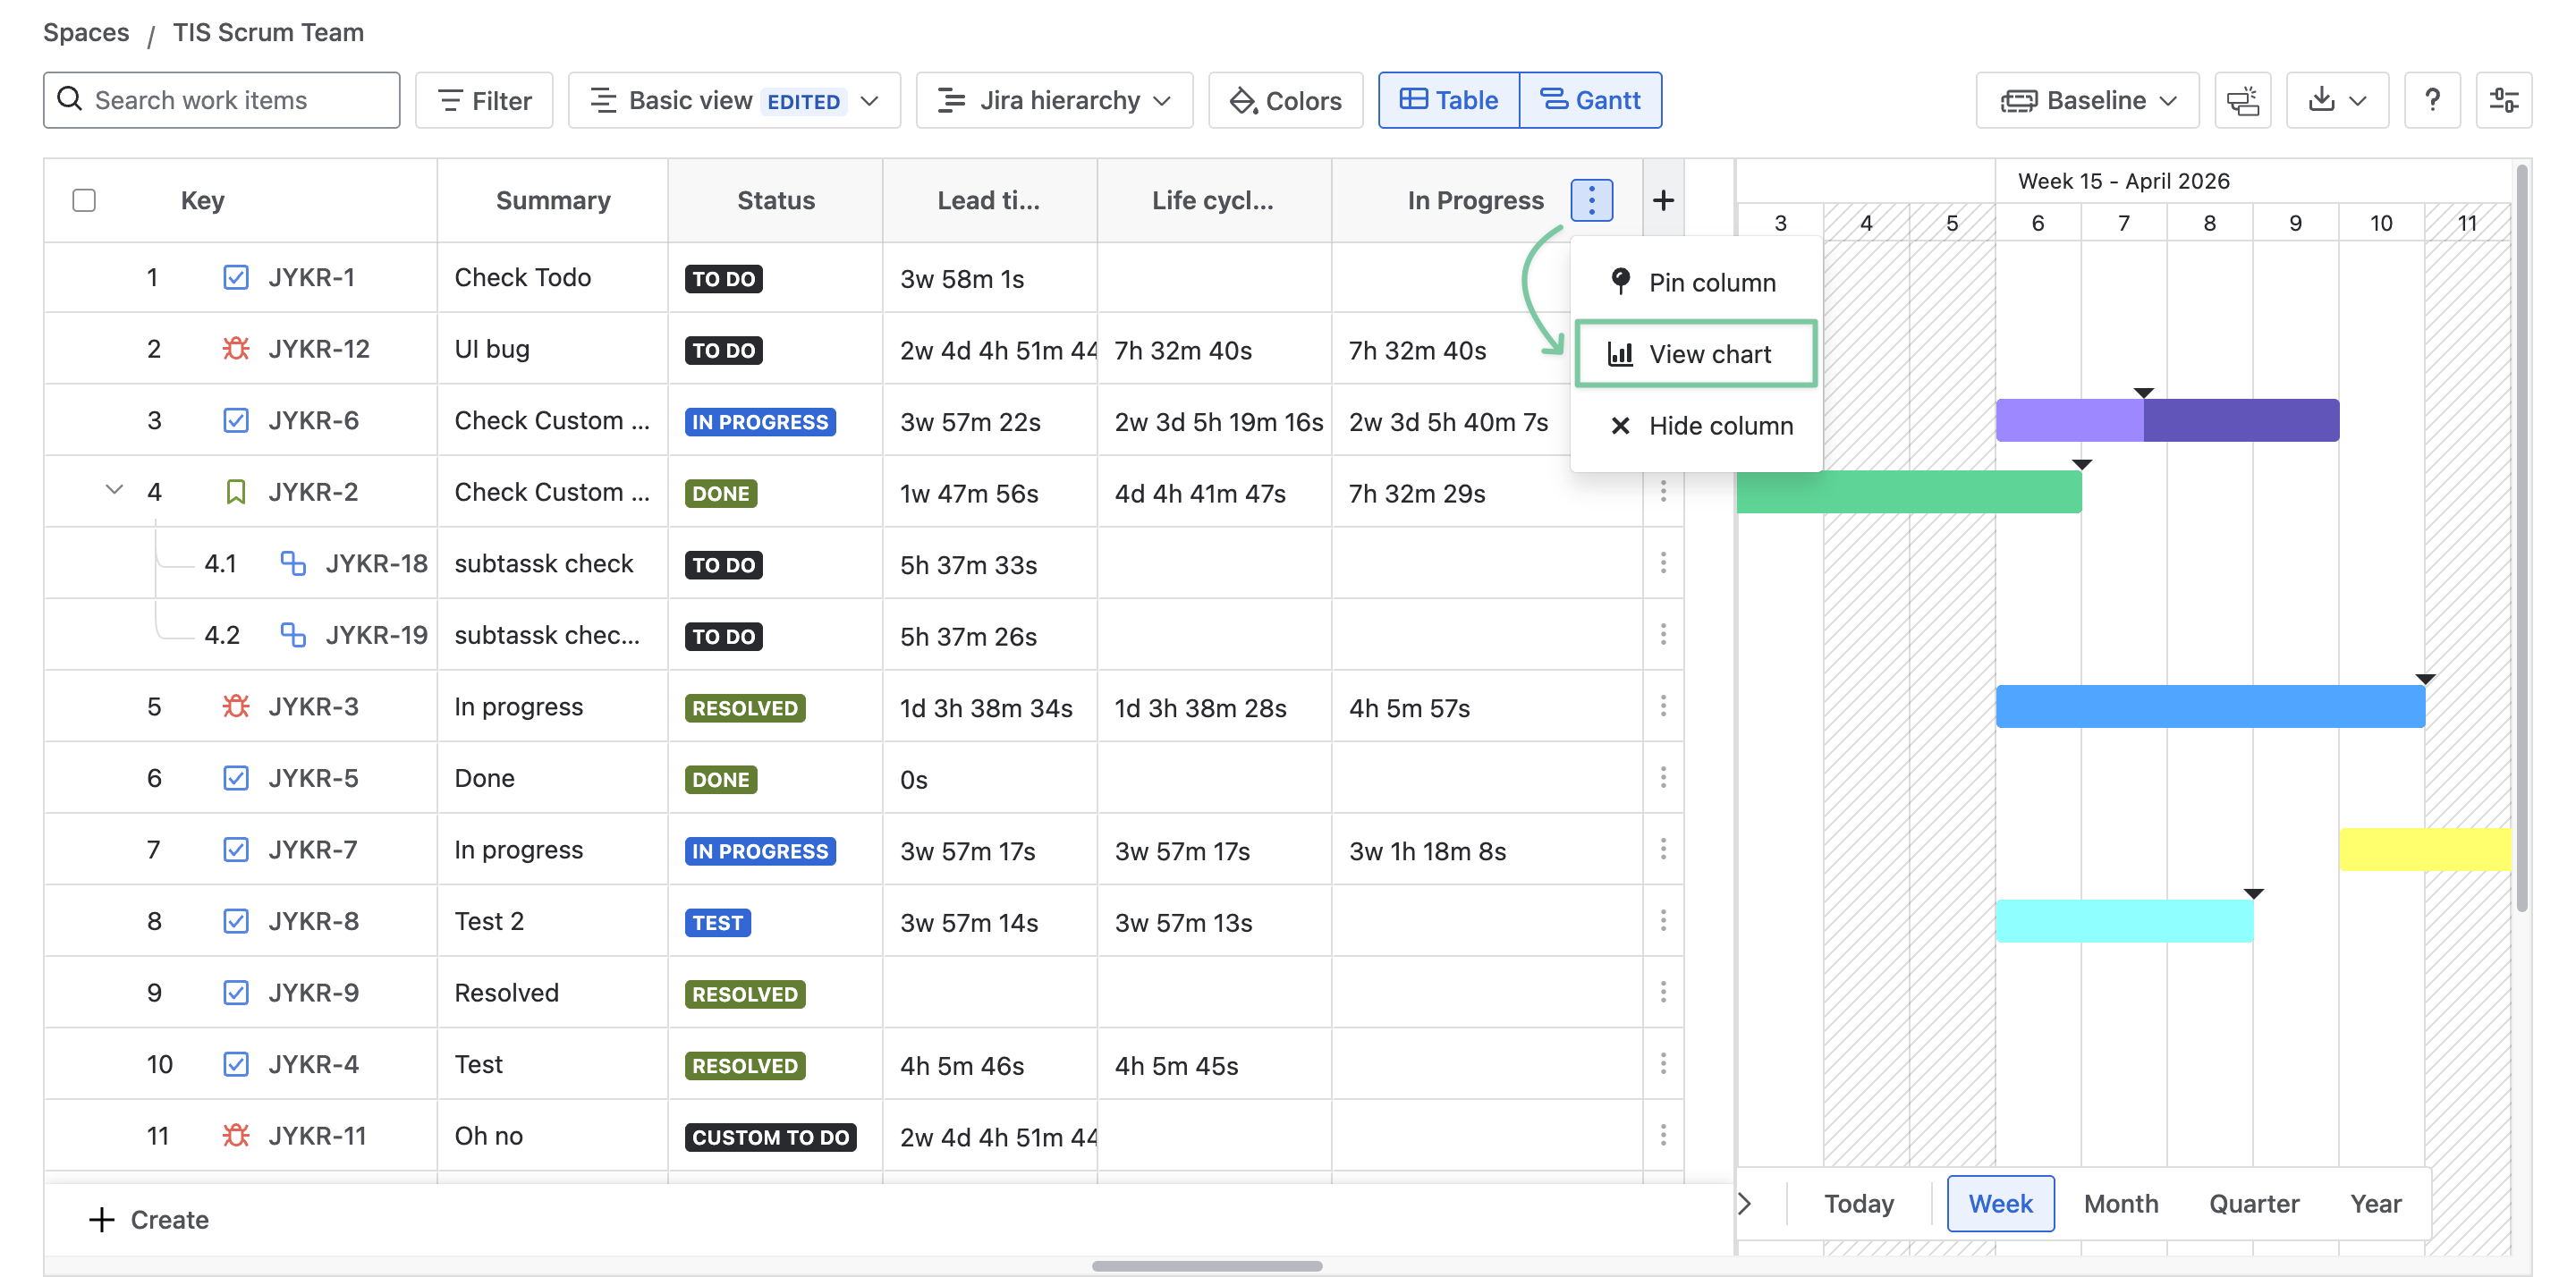
2. View chart
In the Time in status columns, GanttTable supports different chart views, allowing users to visualize the average time spent per month in a specific status category.
To open the view chart, locate the three-dot symbol on the time in status column. Click it and choose View chart.
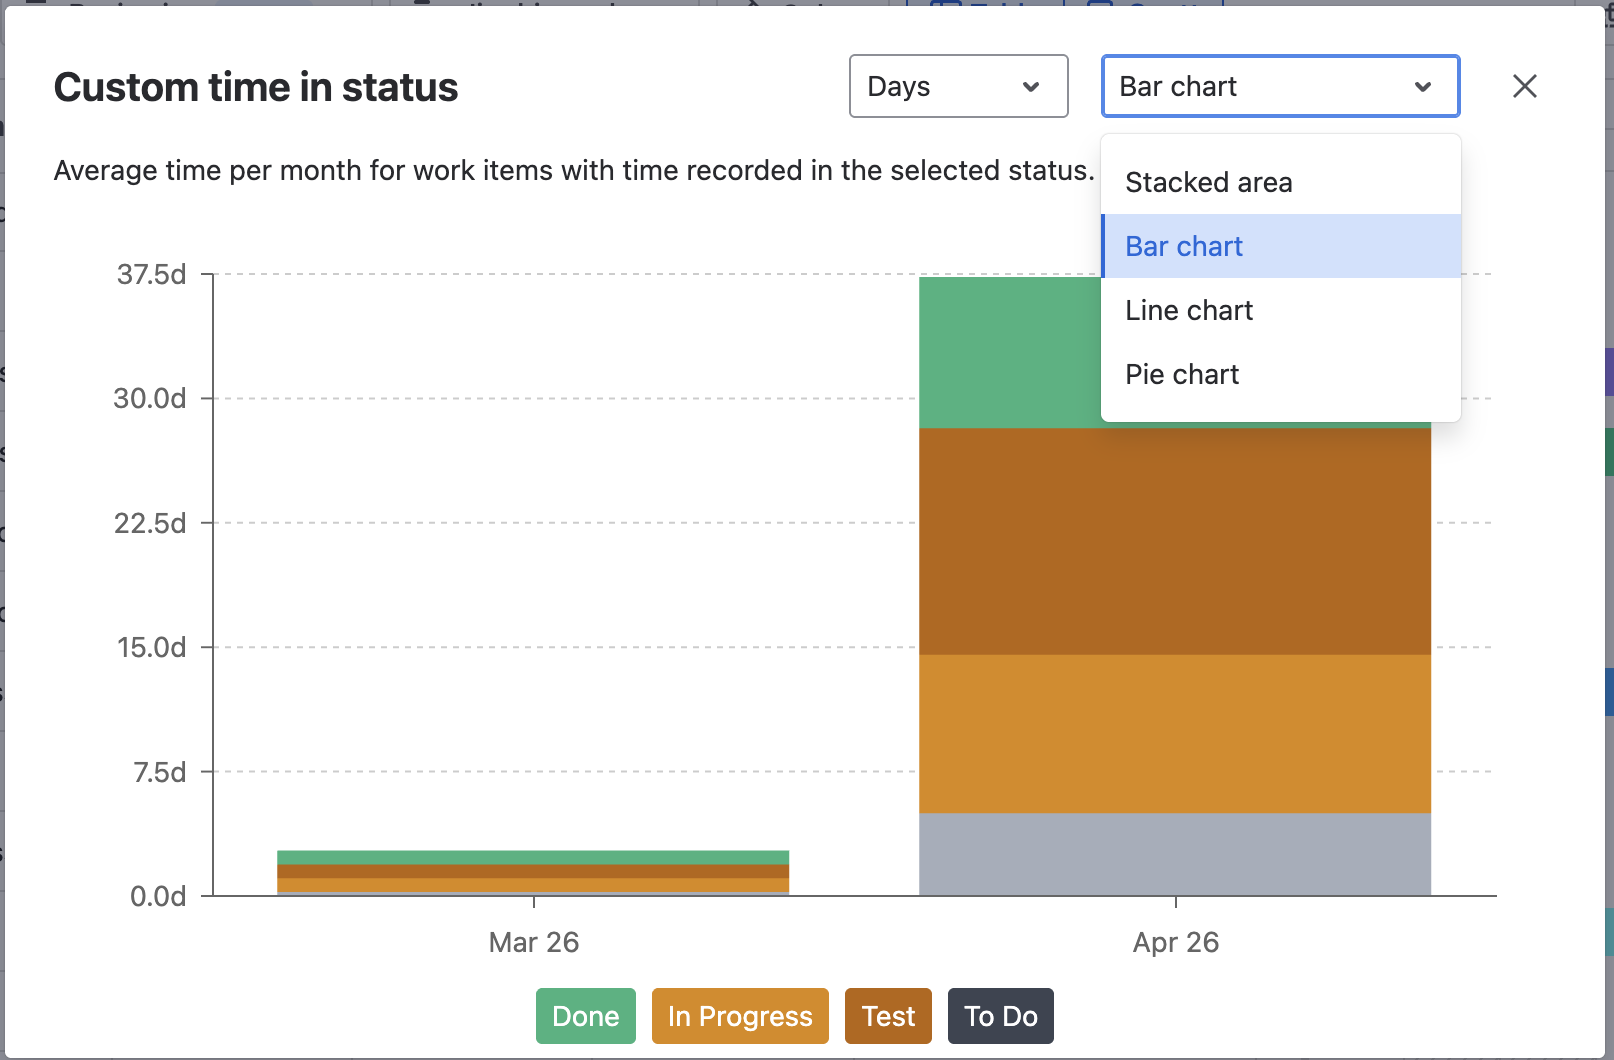
Currently, users can view the time in status in 4 different charts:
-
Stacked area
-
Bar chart
-
Line chart
-
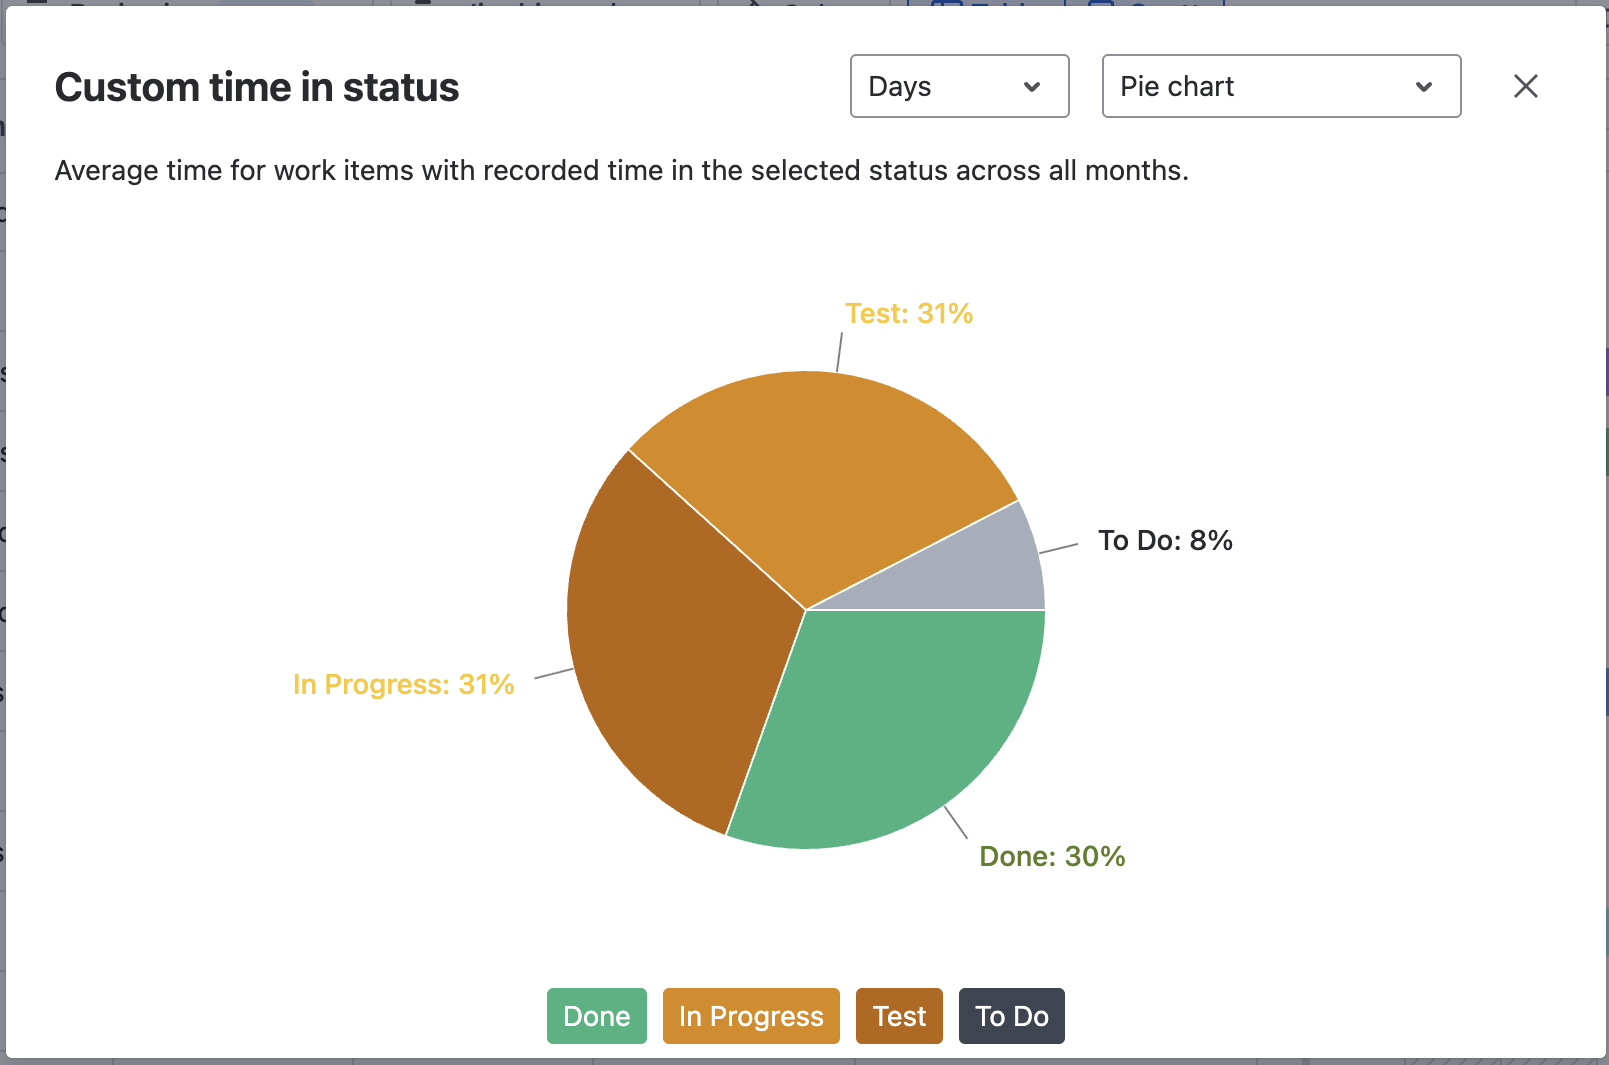
Pie chart
While in the chart views, users can switch among 3 time settings for the visualization:
-
Days
-
Hours
-
Minutes
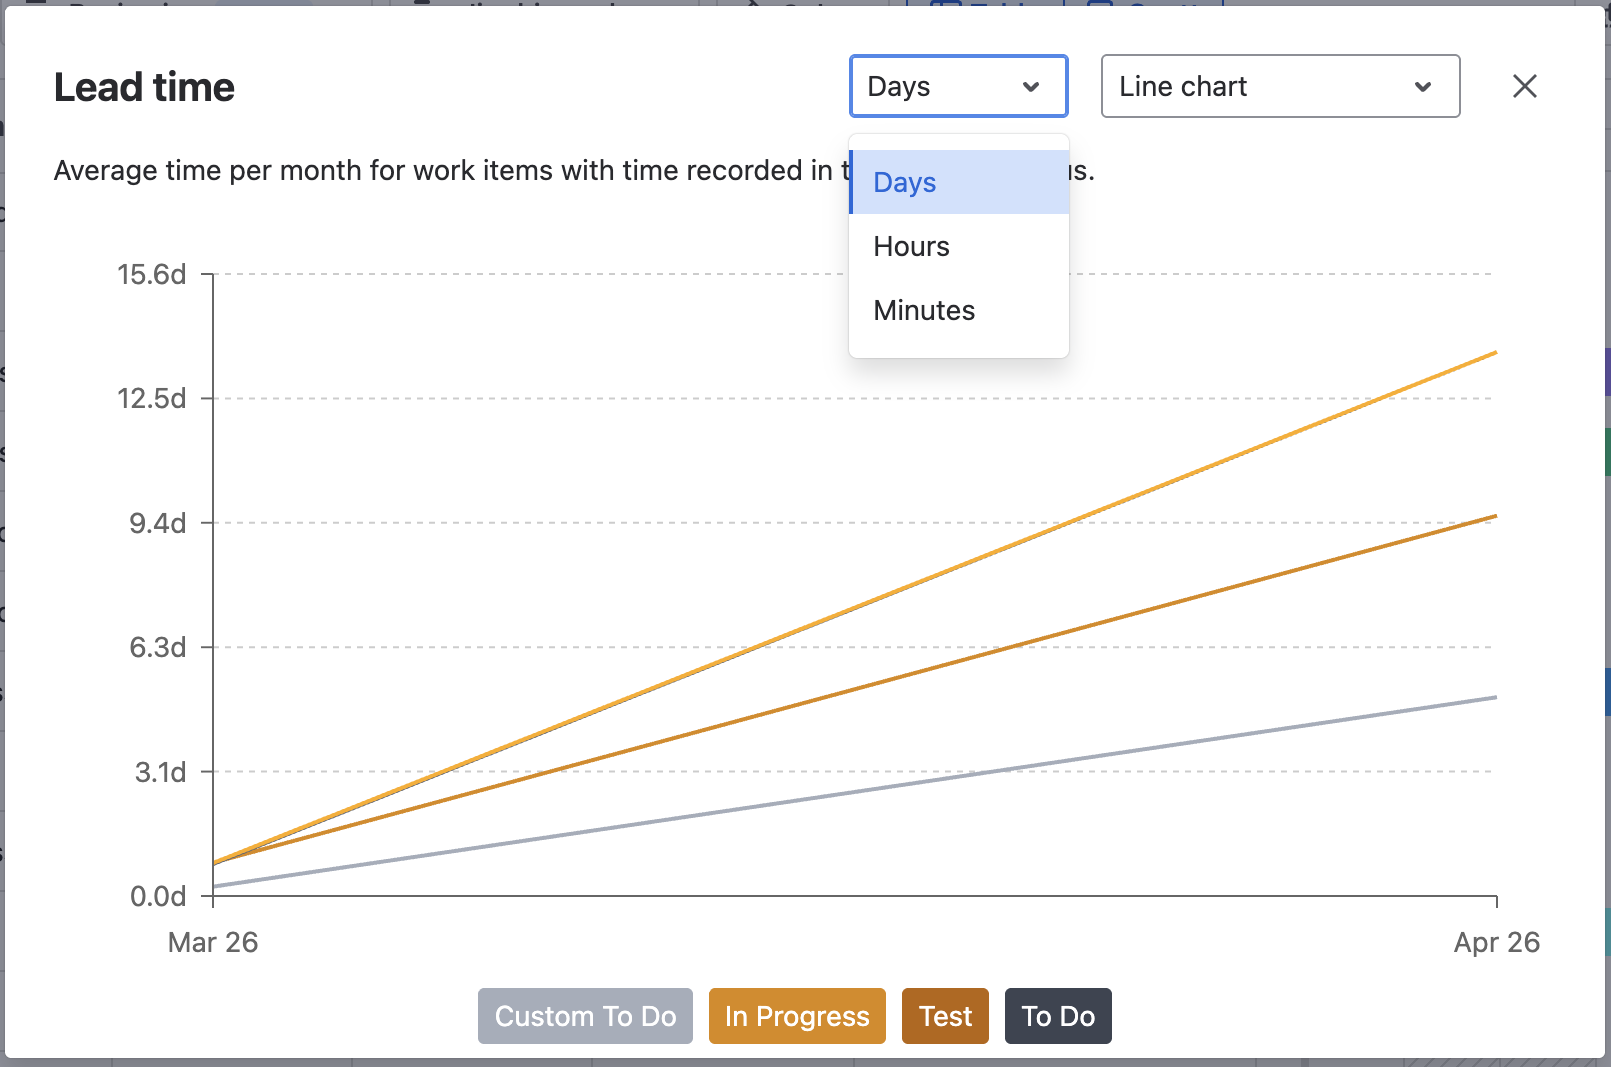
When used in Lead time, Life cycle time, Total, or custom time in status, chart views can provide a bigger picture, comparing how time is spent on different statuses on average.
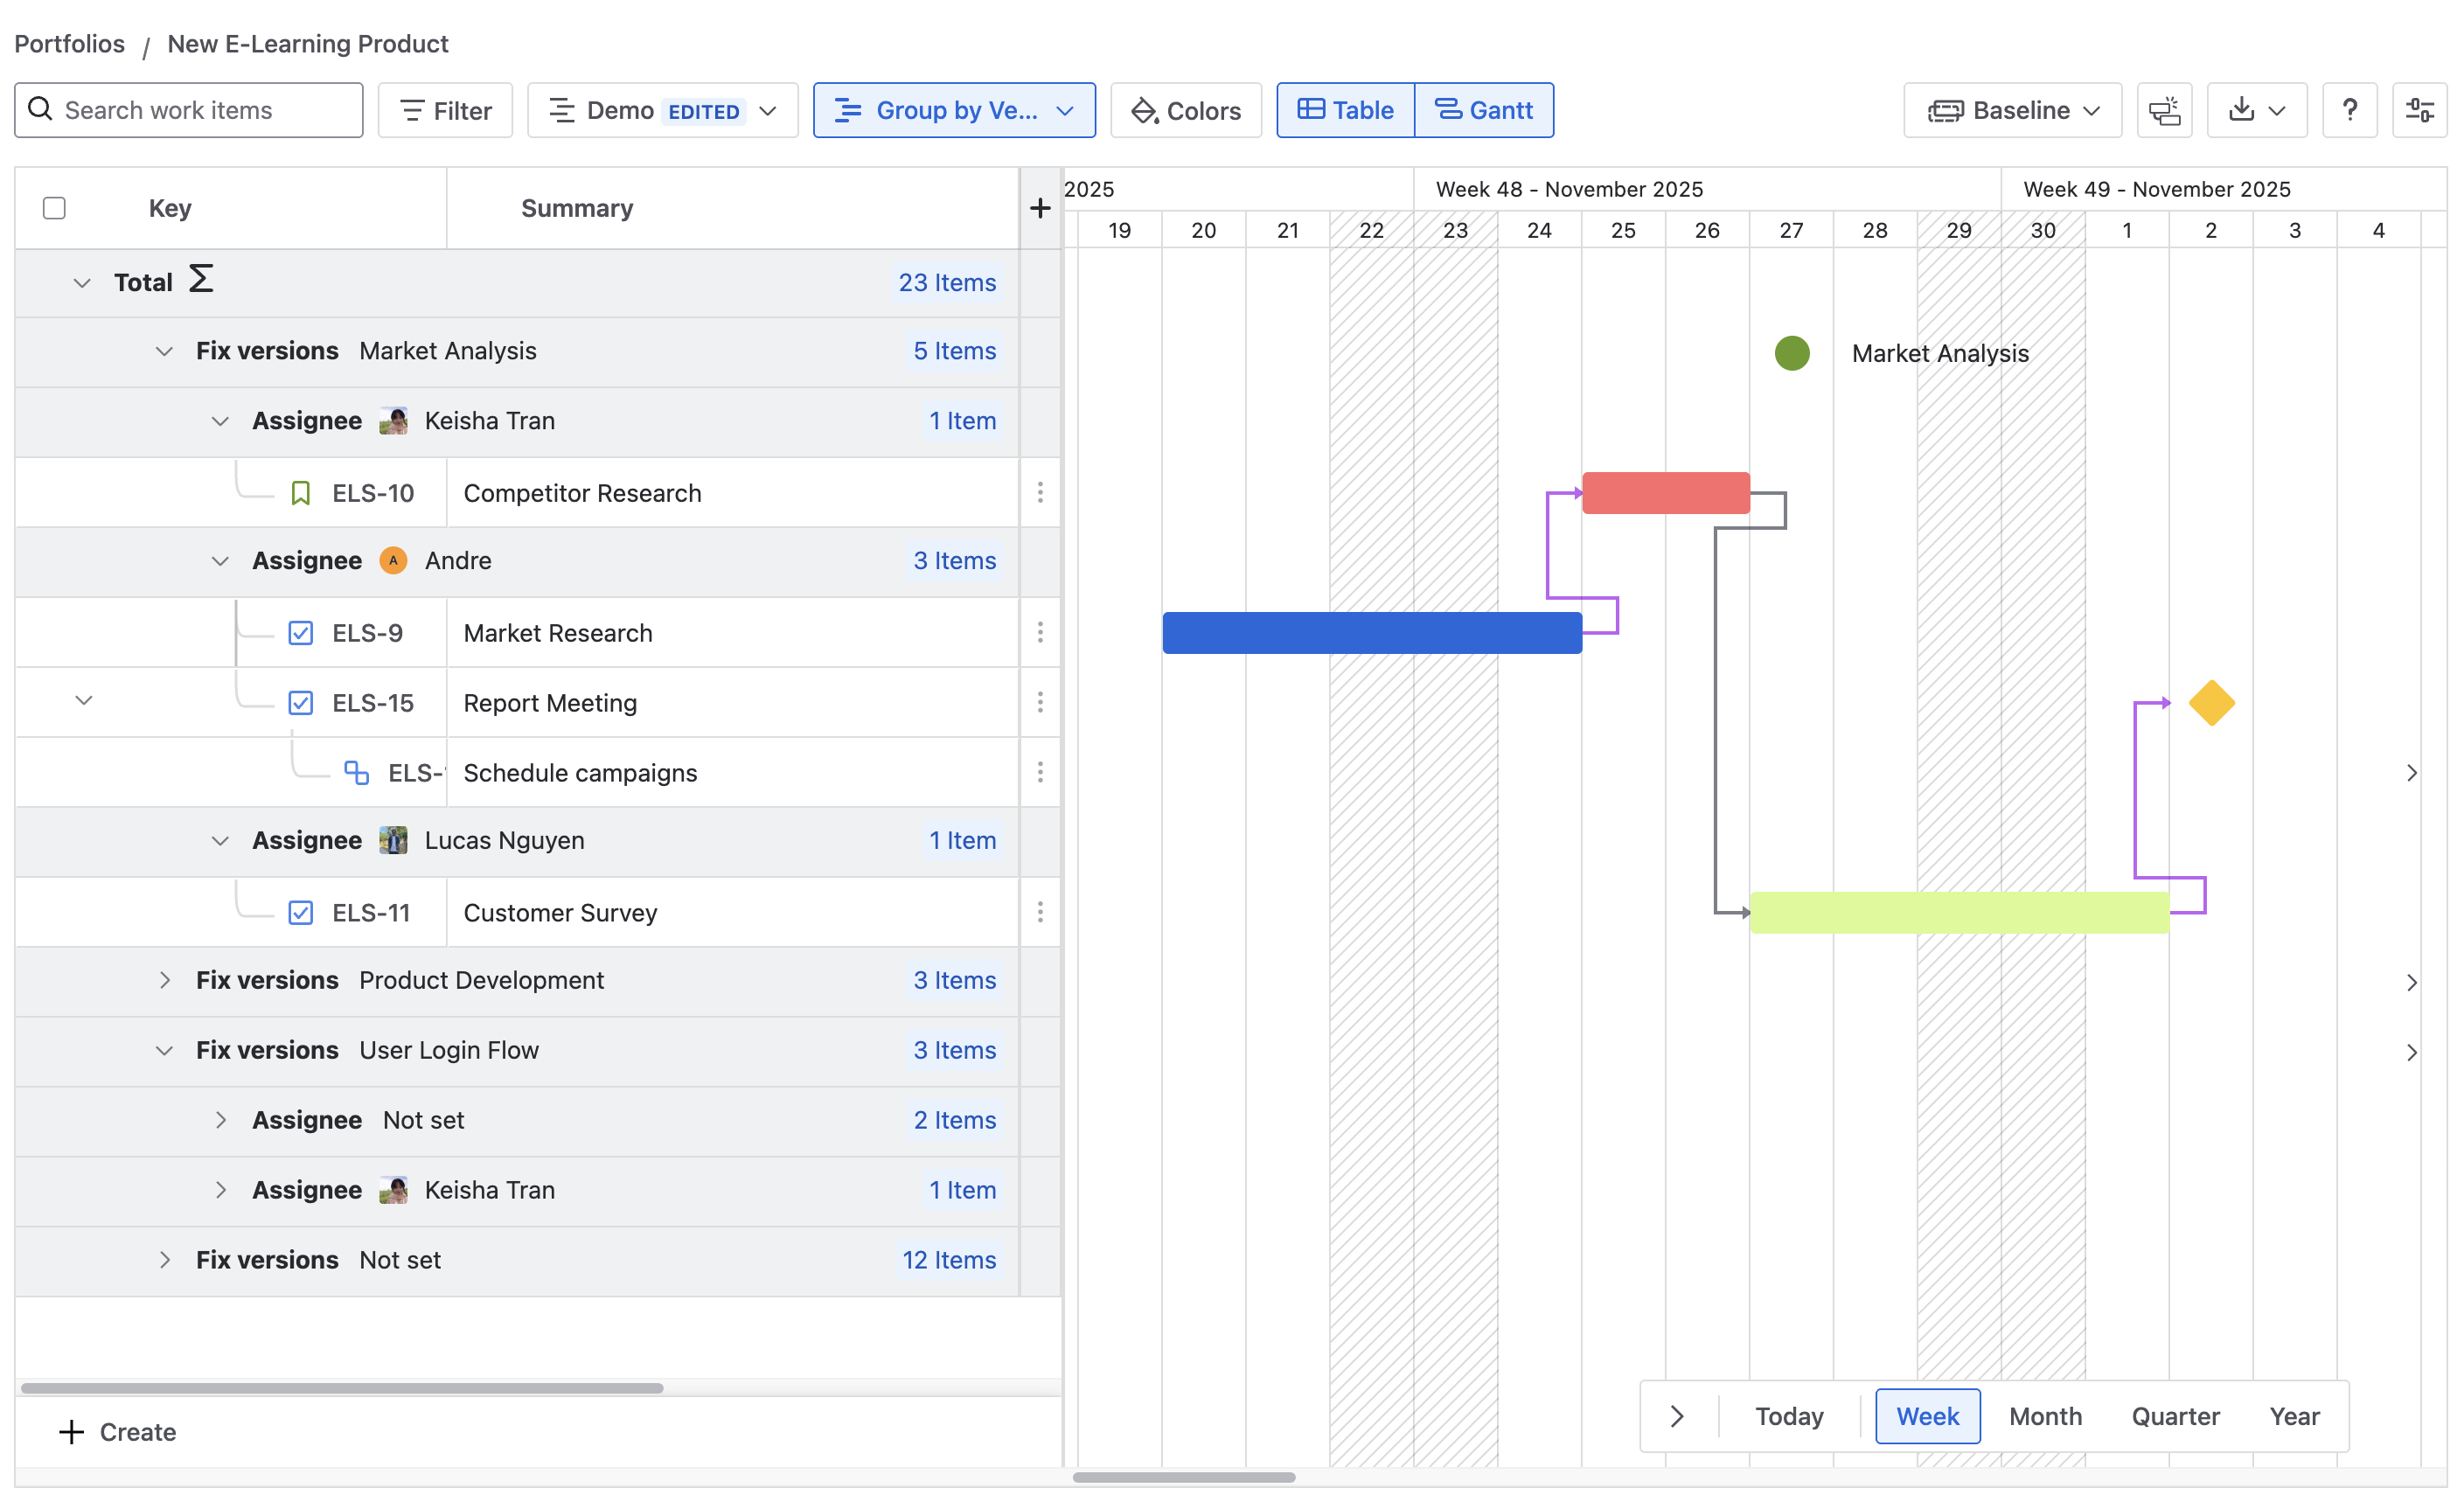
Group Hierarchy
1. What is Group in GanttTable?
The Group feature provides a unique way for you to visualize and manage your tasks, sprints, and projects in the most convenient way possible.
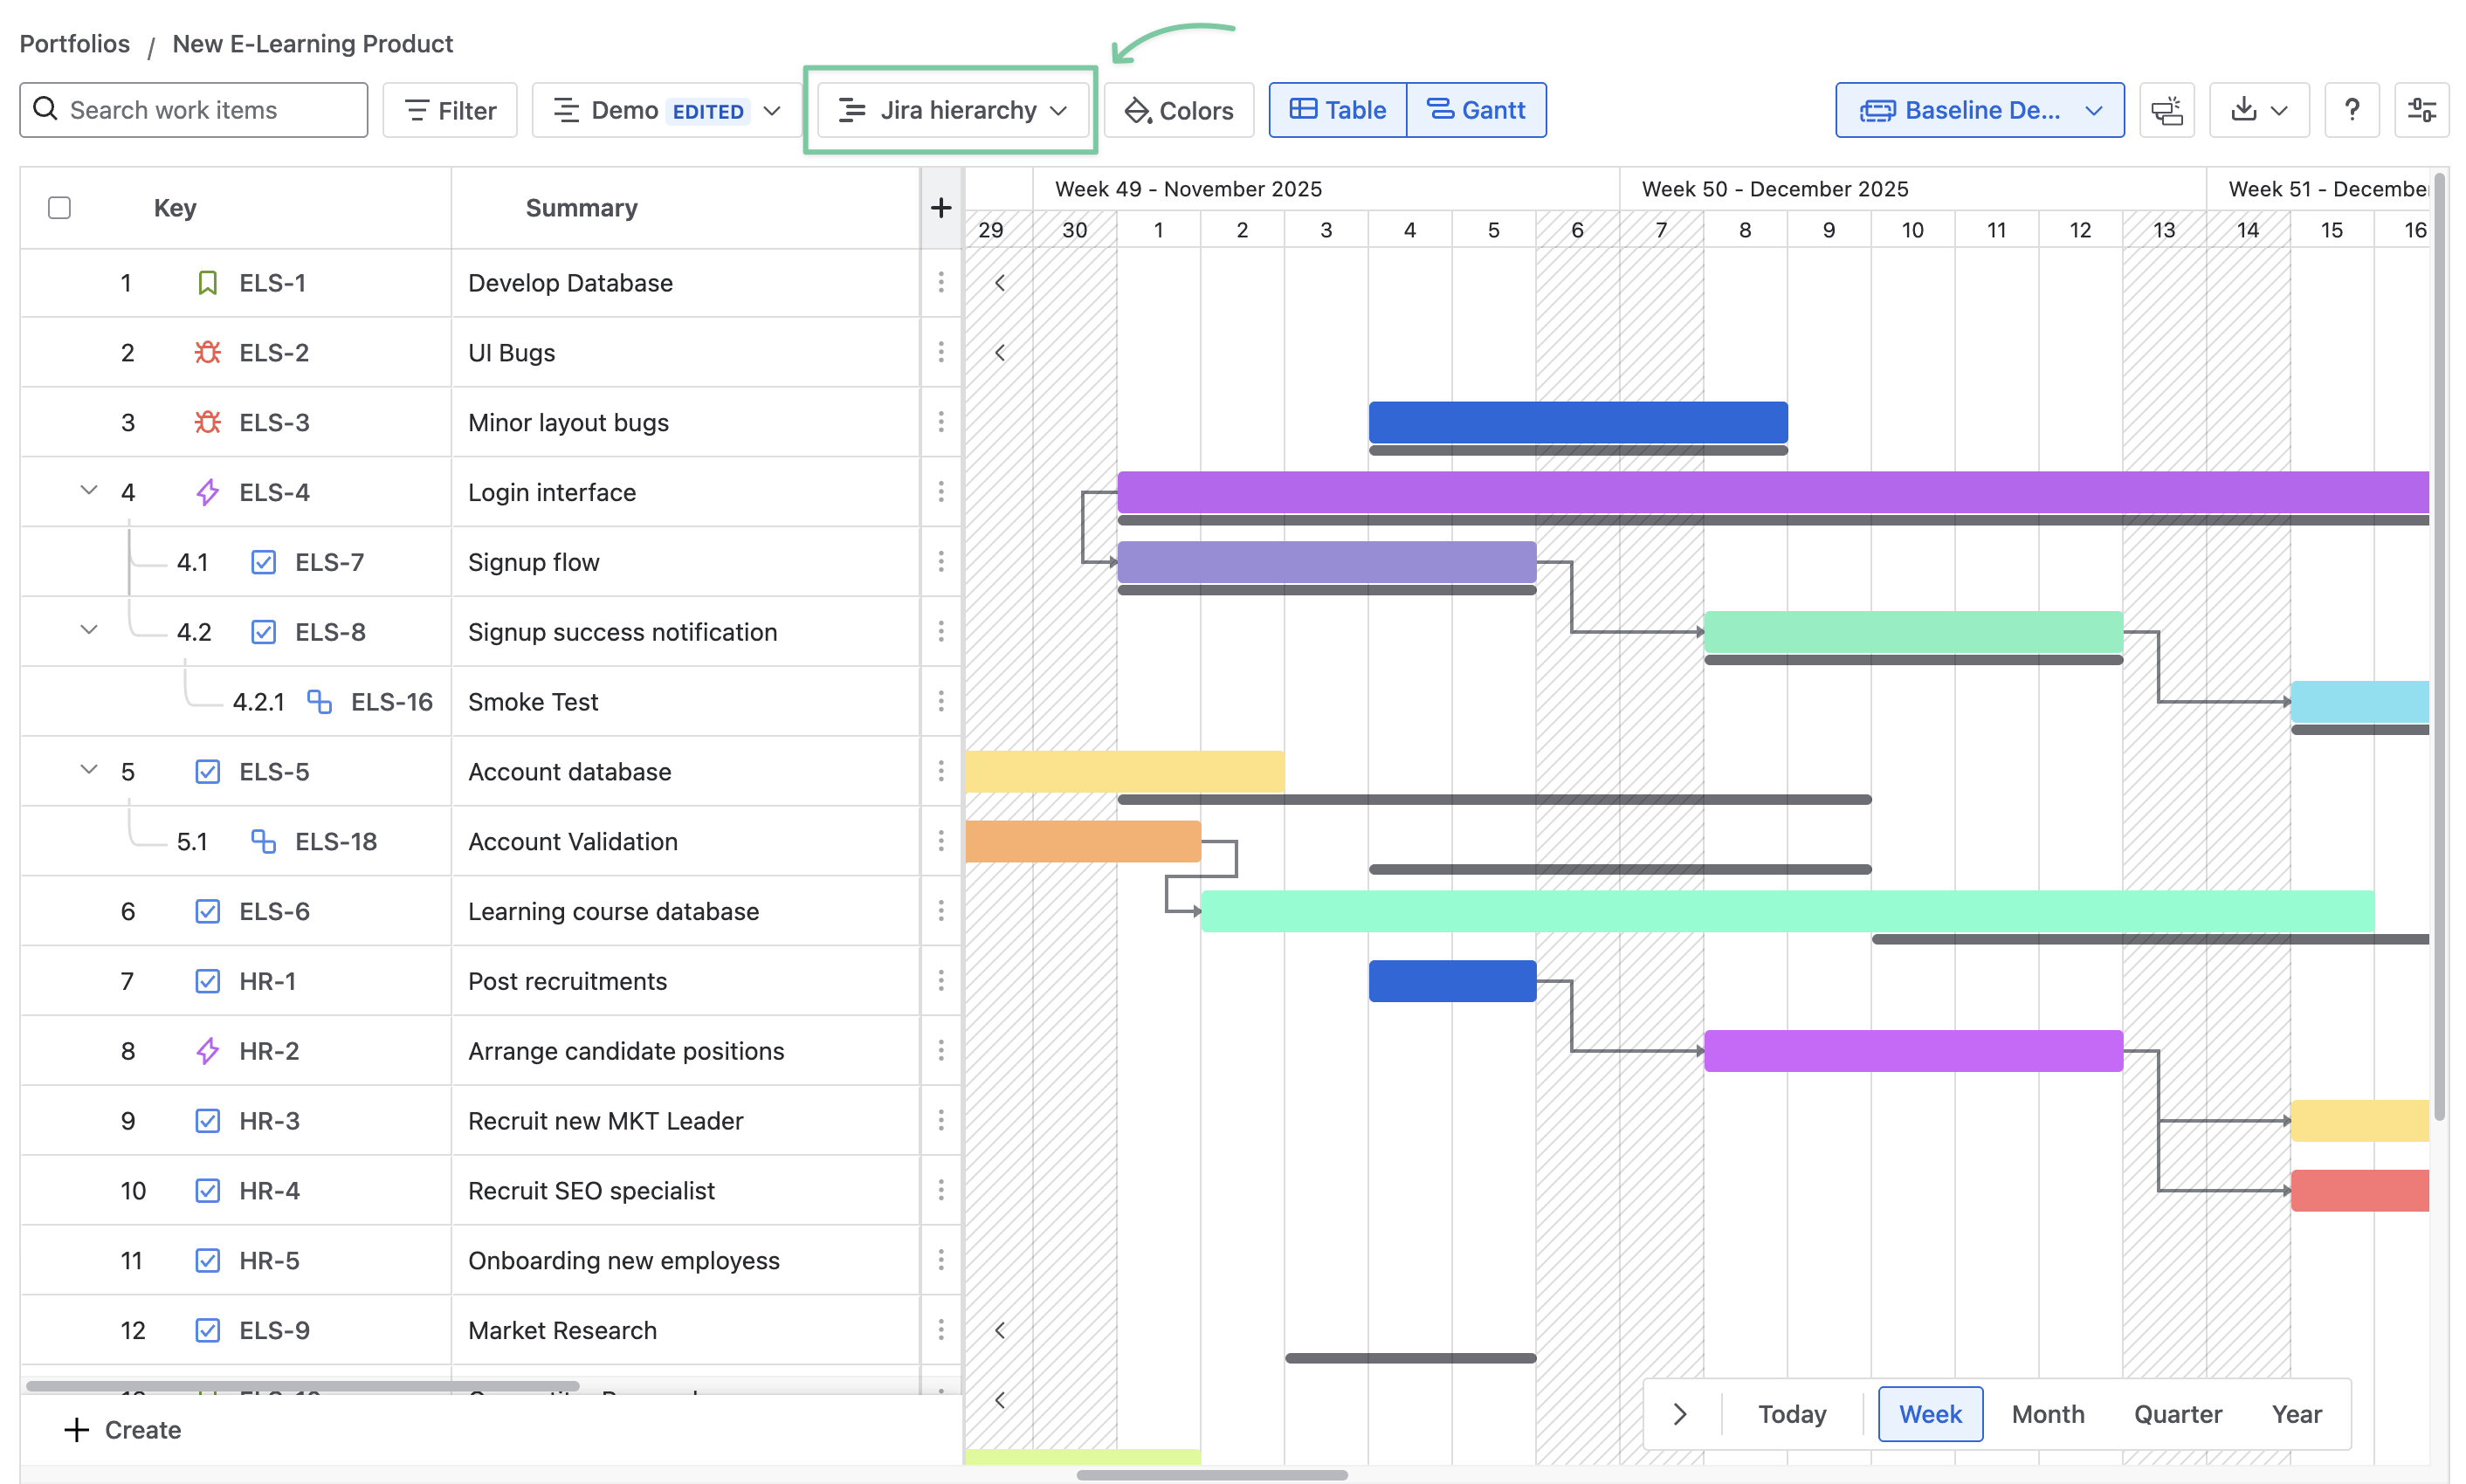
By default, the GanttTable uses the Jira hierarchy group.
This structure allows you and your team to manage work at different levels of granularity, ensuring that large strategic goals (Epics) are broken down into smaller, actionable tasks (Sub-tasks).
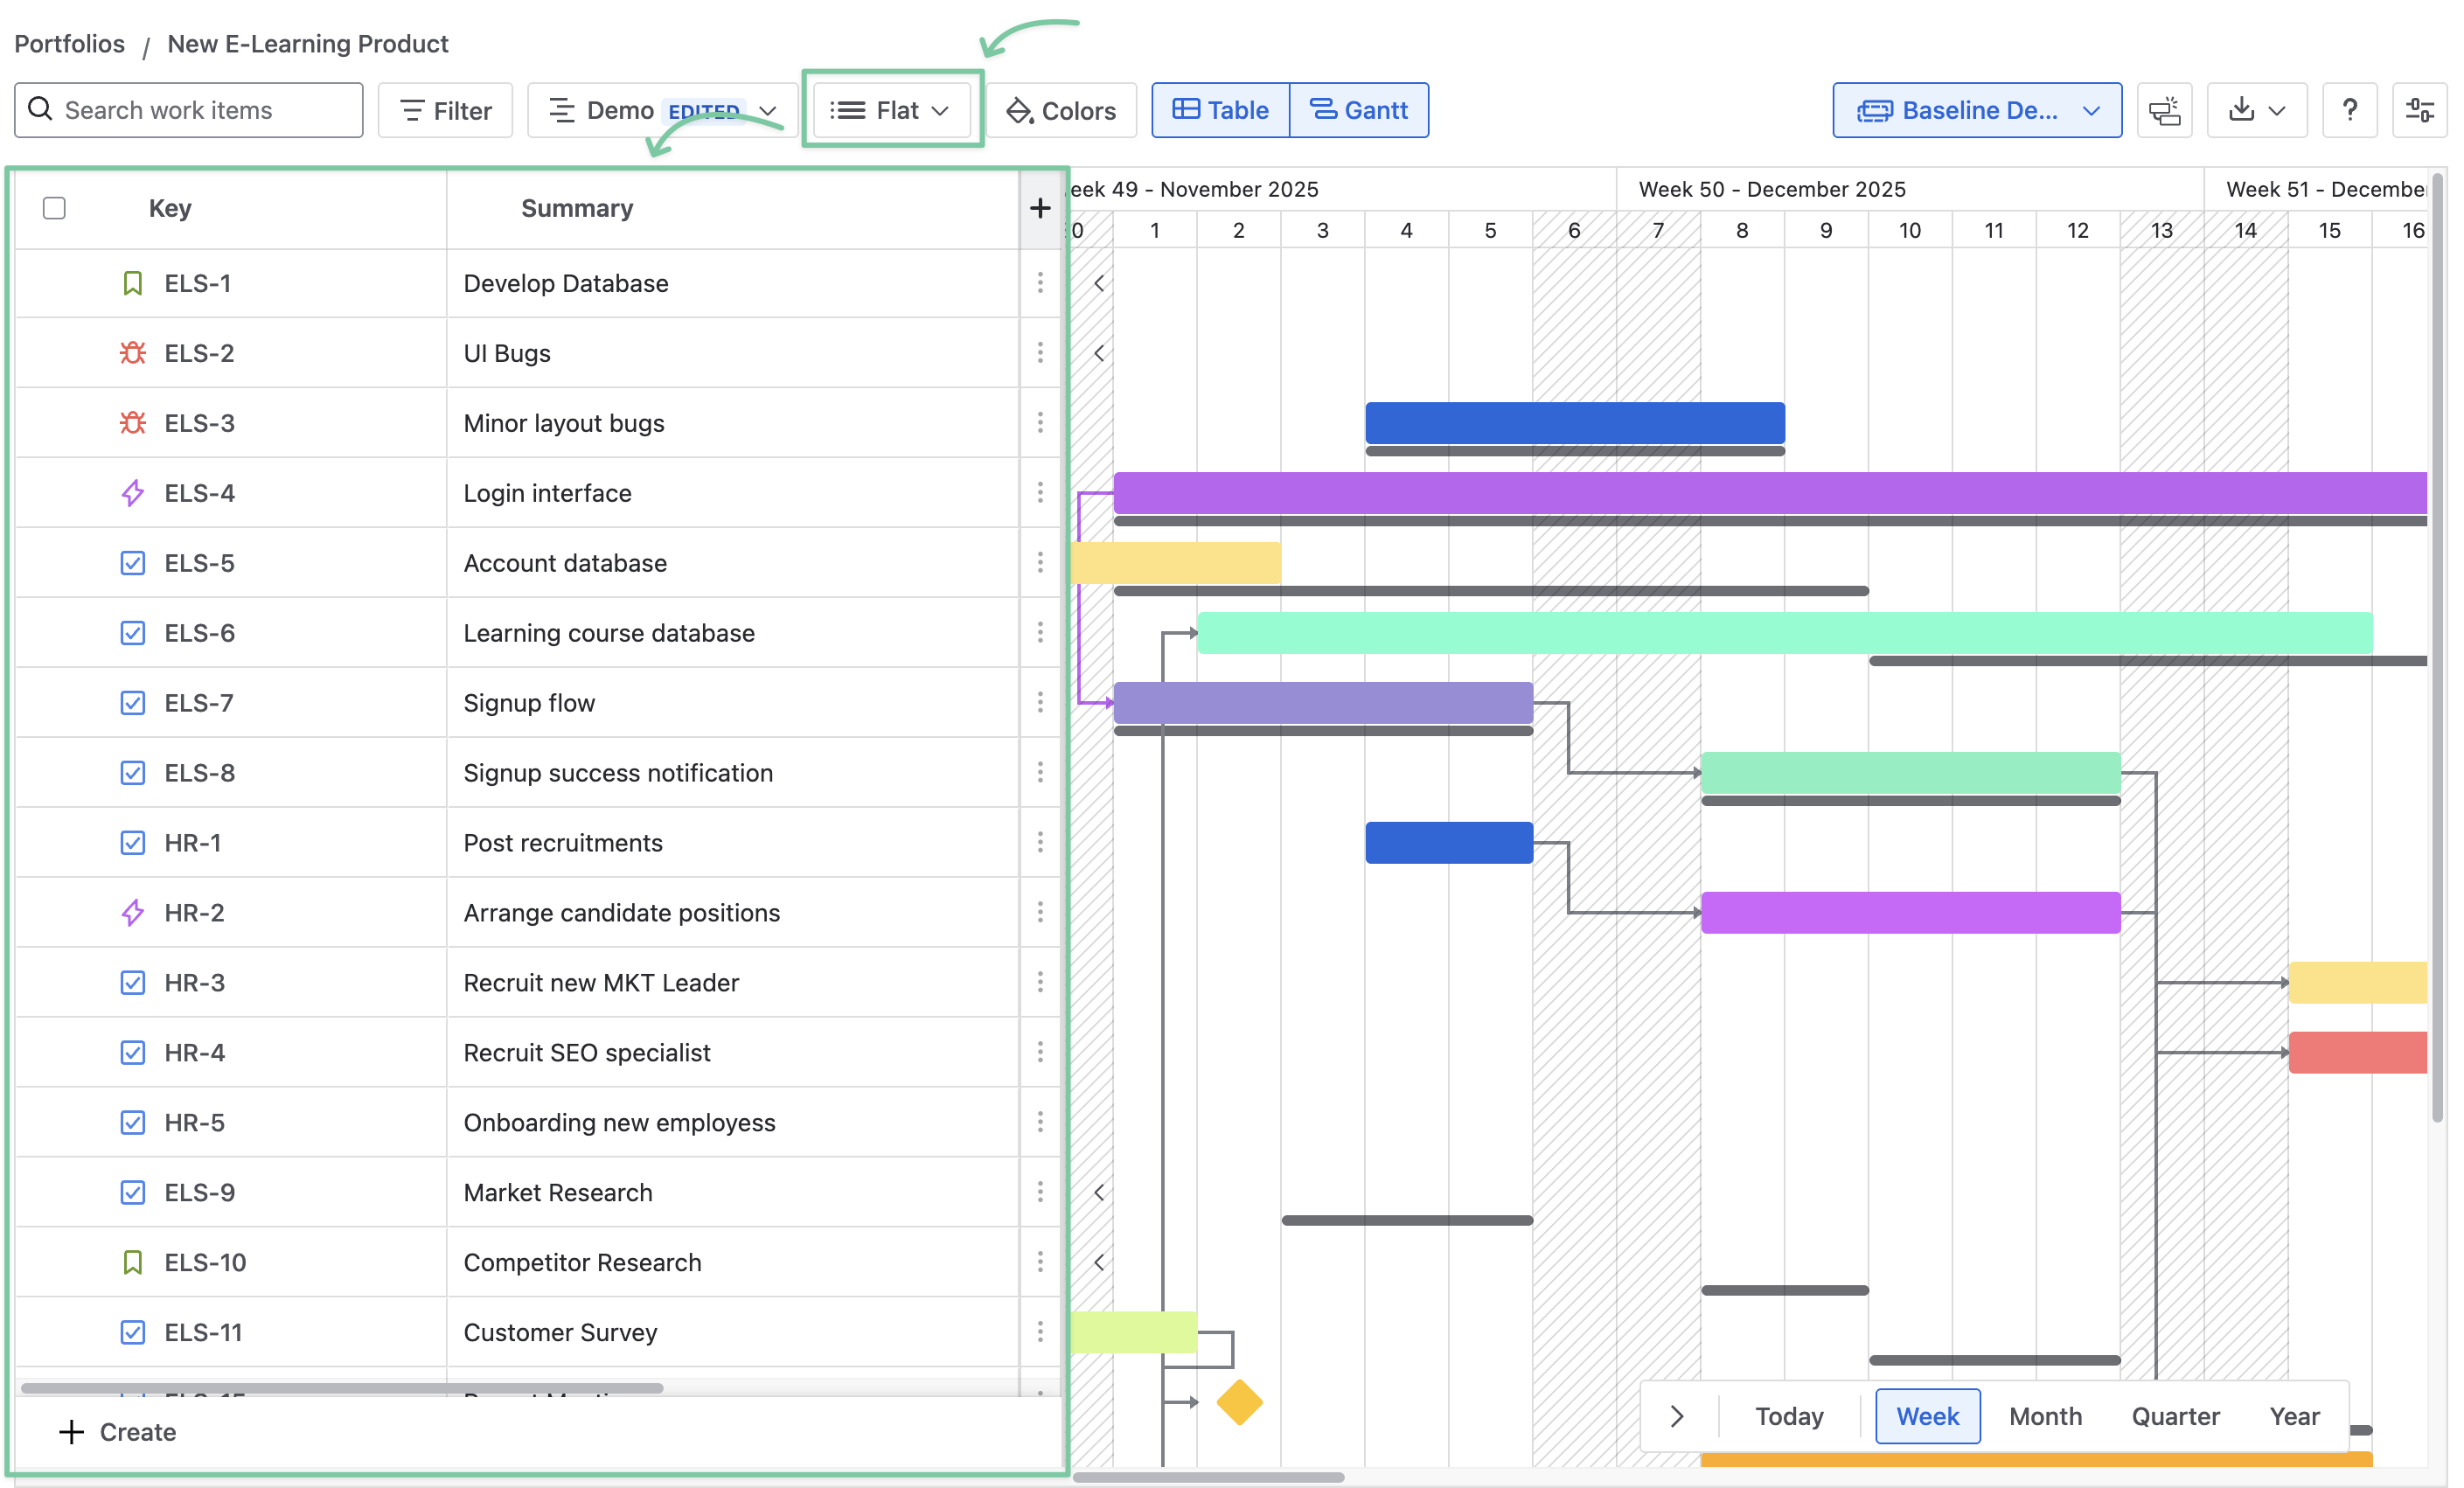
You can also choose the Flat type for a simpler approach to managing your work items.
2. Custom groups
You can customize groups using your own rules to organize your work on the table and create a unique view.
You can save this new group as a new view and use it again later. Or, you can also set it as the default view for other members.
For more details, please read How to create a new view (Saved views).
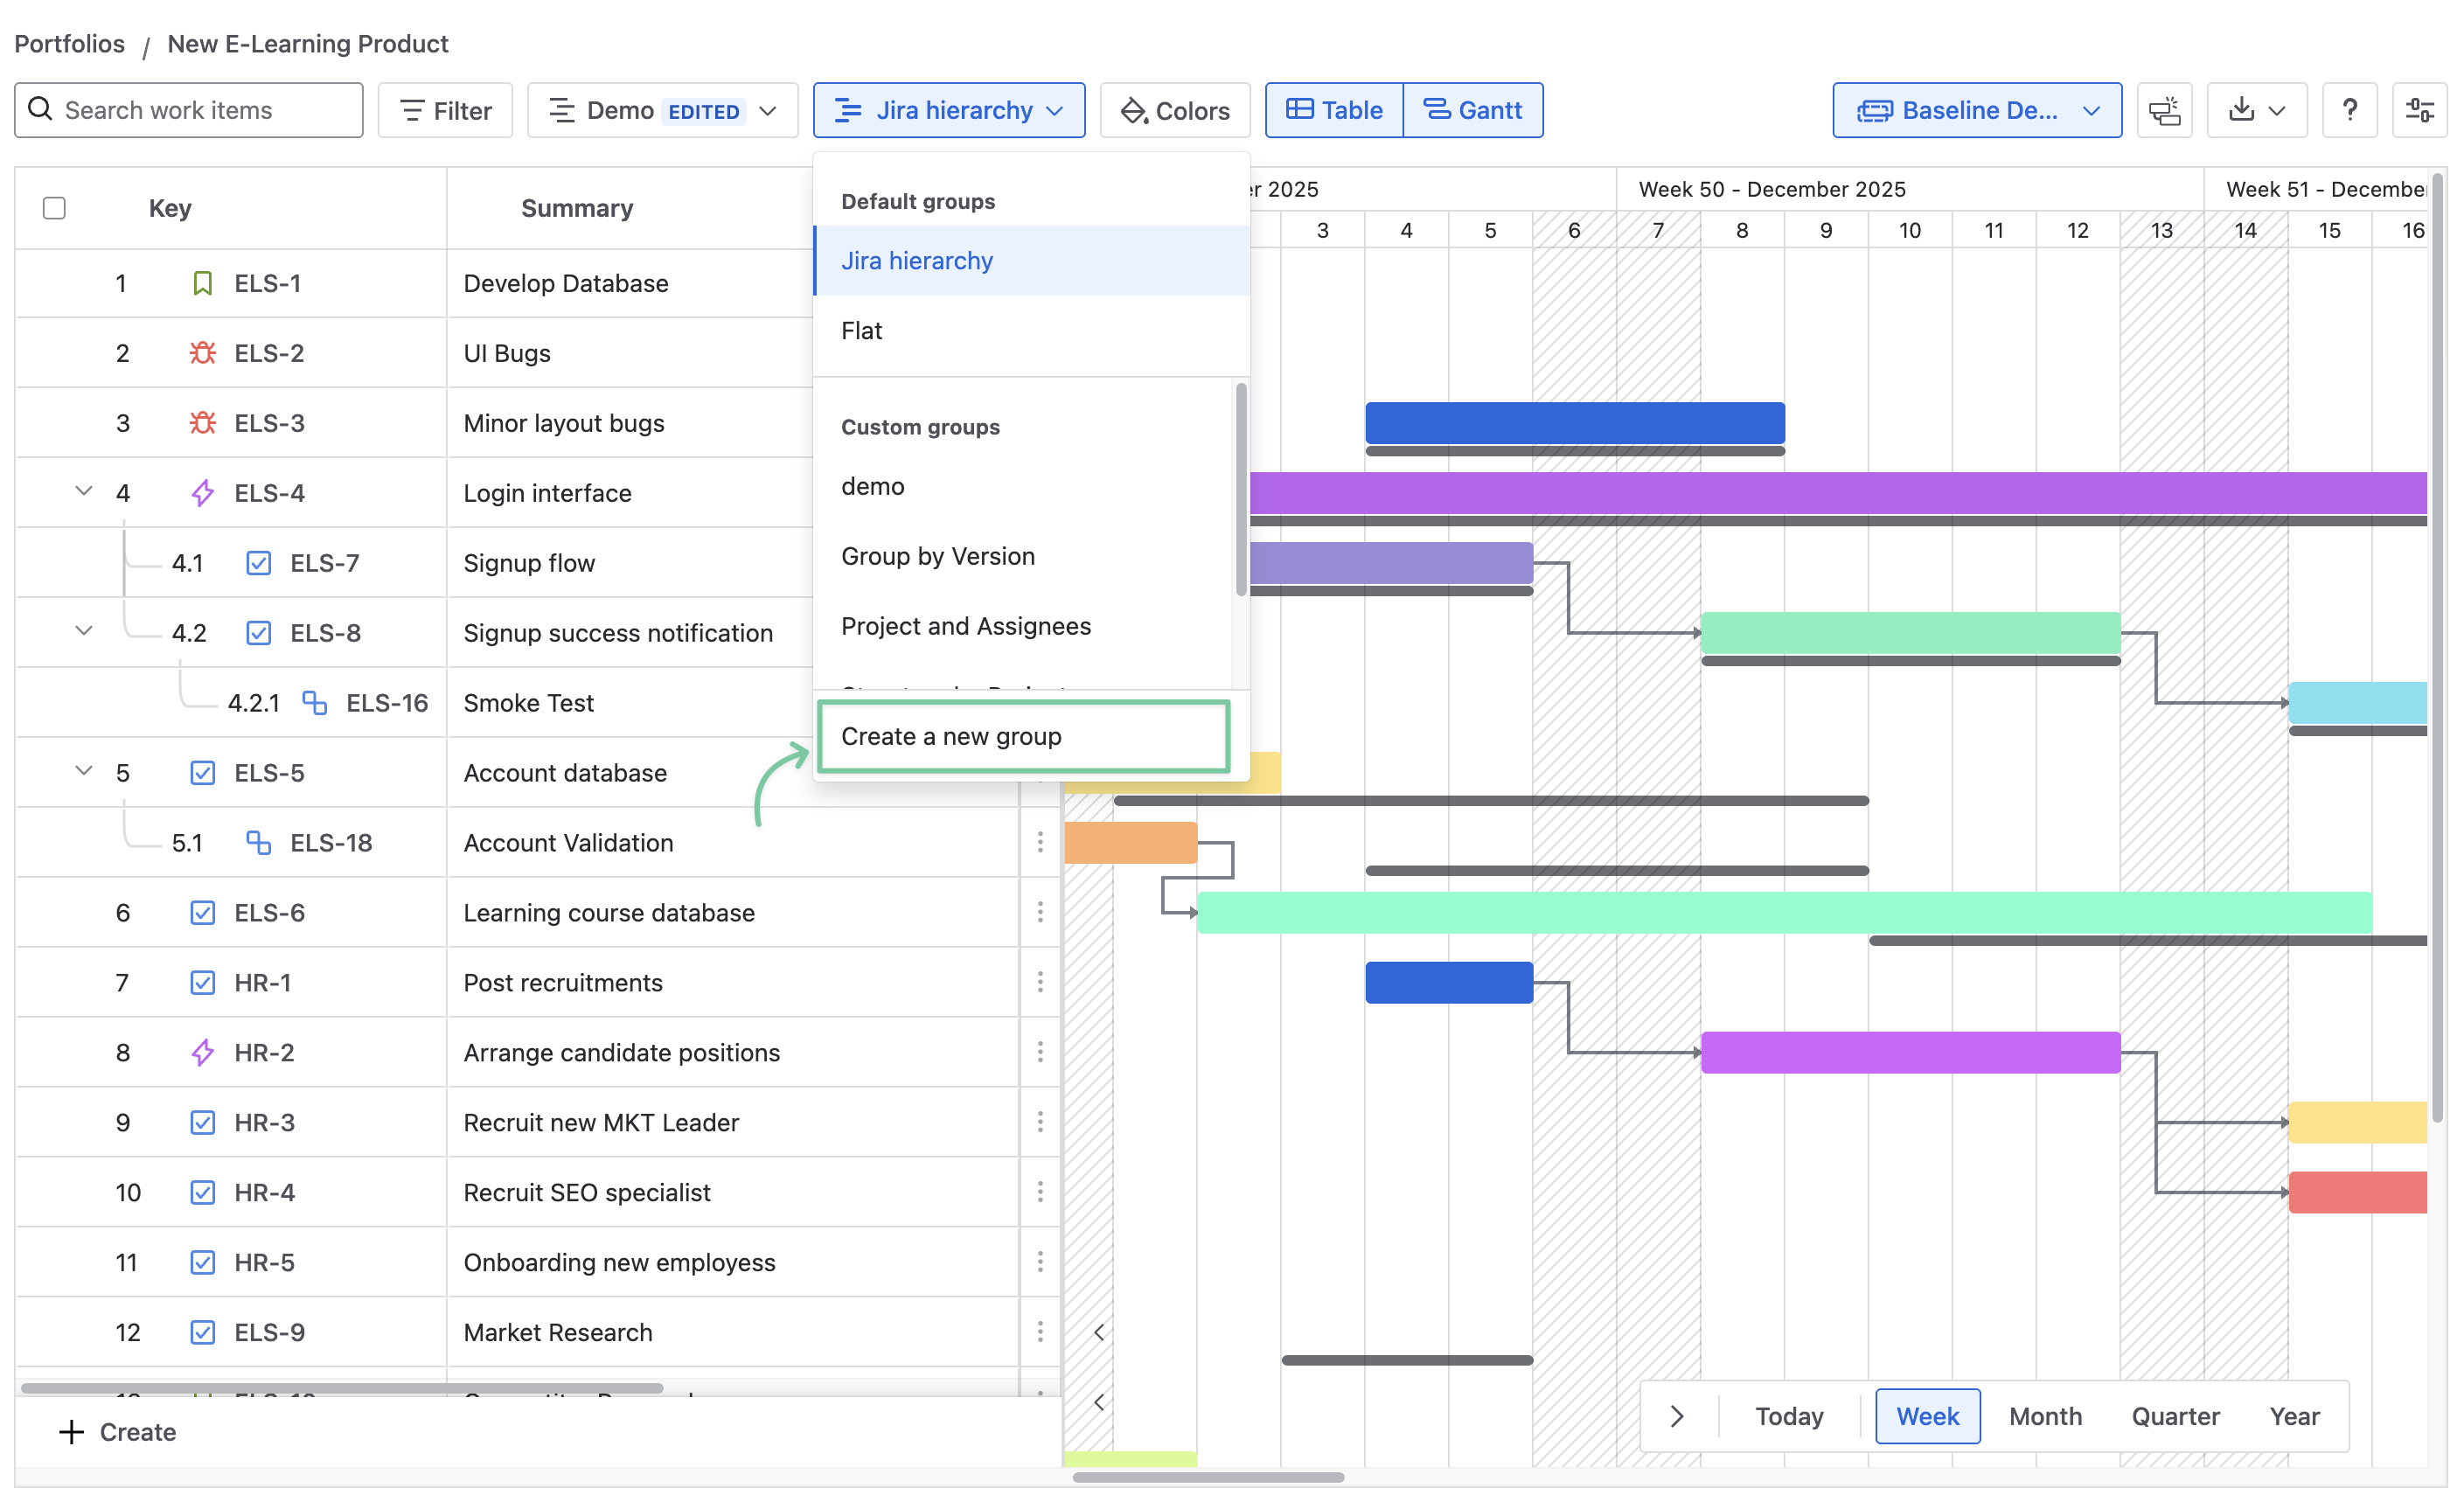
To start creating a custom group, select Create a new group.
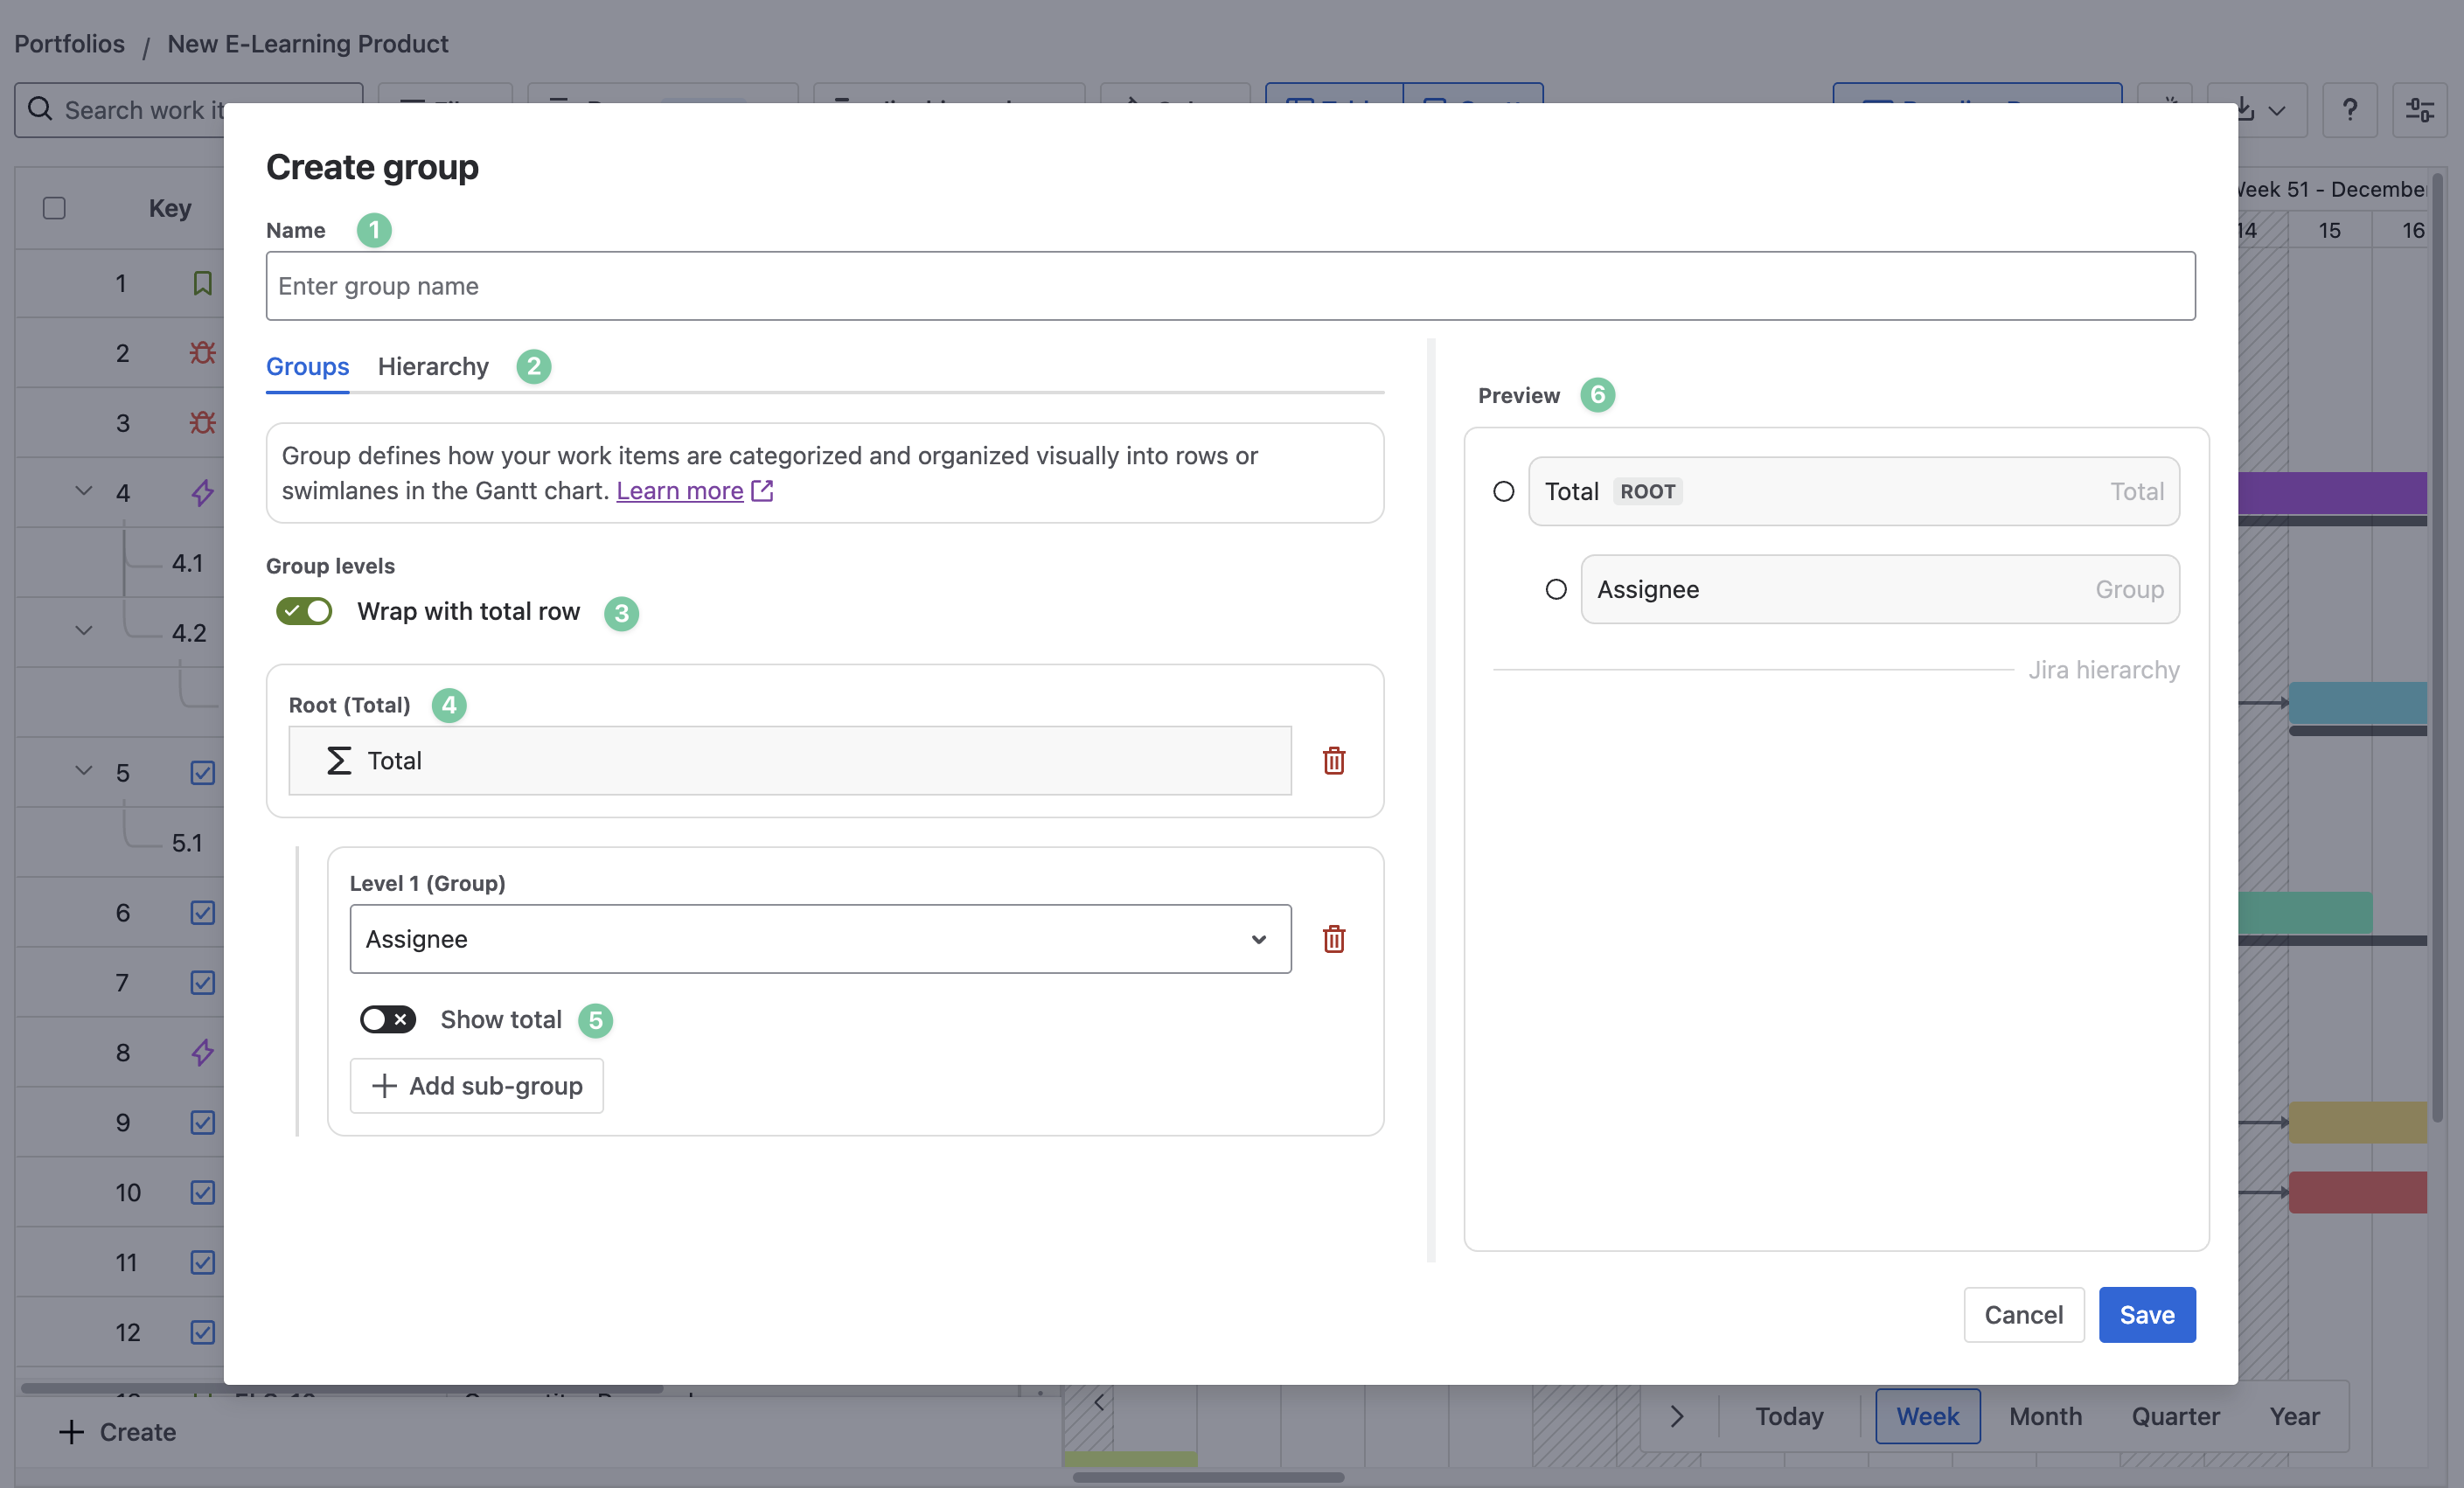
There will be a pop-up dialog with the following information:
|
1. Name |
The name of this group hierarchy |
|
2. Group / Hierarchy tab |
This allows you to switch between Group and Hierarchy views when creating a custom group. |
|
3. Wrap with total row |
When toggled on, your custom group will begin with a total row that summarizes the number of work items in this portfolio. |
|
4. Group levels |
You can add different Jira fields to your custom group, allowing you to categorize or organize issues by a specific field or criterion for better analysis or visualization. |
|
5. Show total |
When toggled on, this level works as a Group and total that displays issues categorized by a field (grouped) and provides the cumulative count or metric for each group. |
|
6. Preview |
This section shows the result of your custom group. |
For example, you can create a custom group showing Total, Fix version, Assignees, Component, and custom select fields.
3. Using Hierarchy in Custom Groups
When creating a custom group, GanttTable also supports visualizing hierarchy based on how you group and organize work with the table.
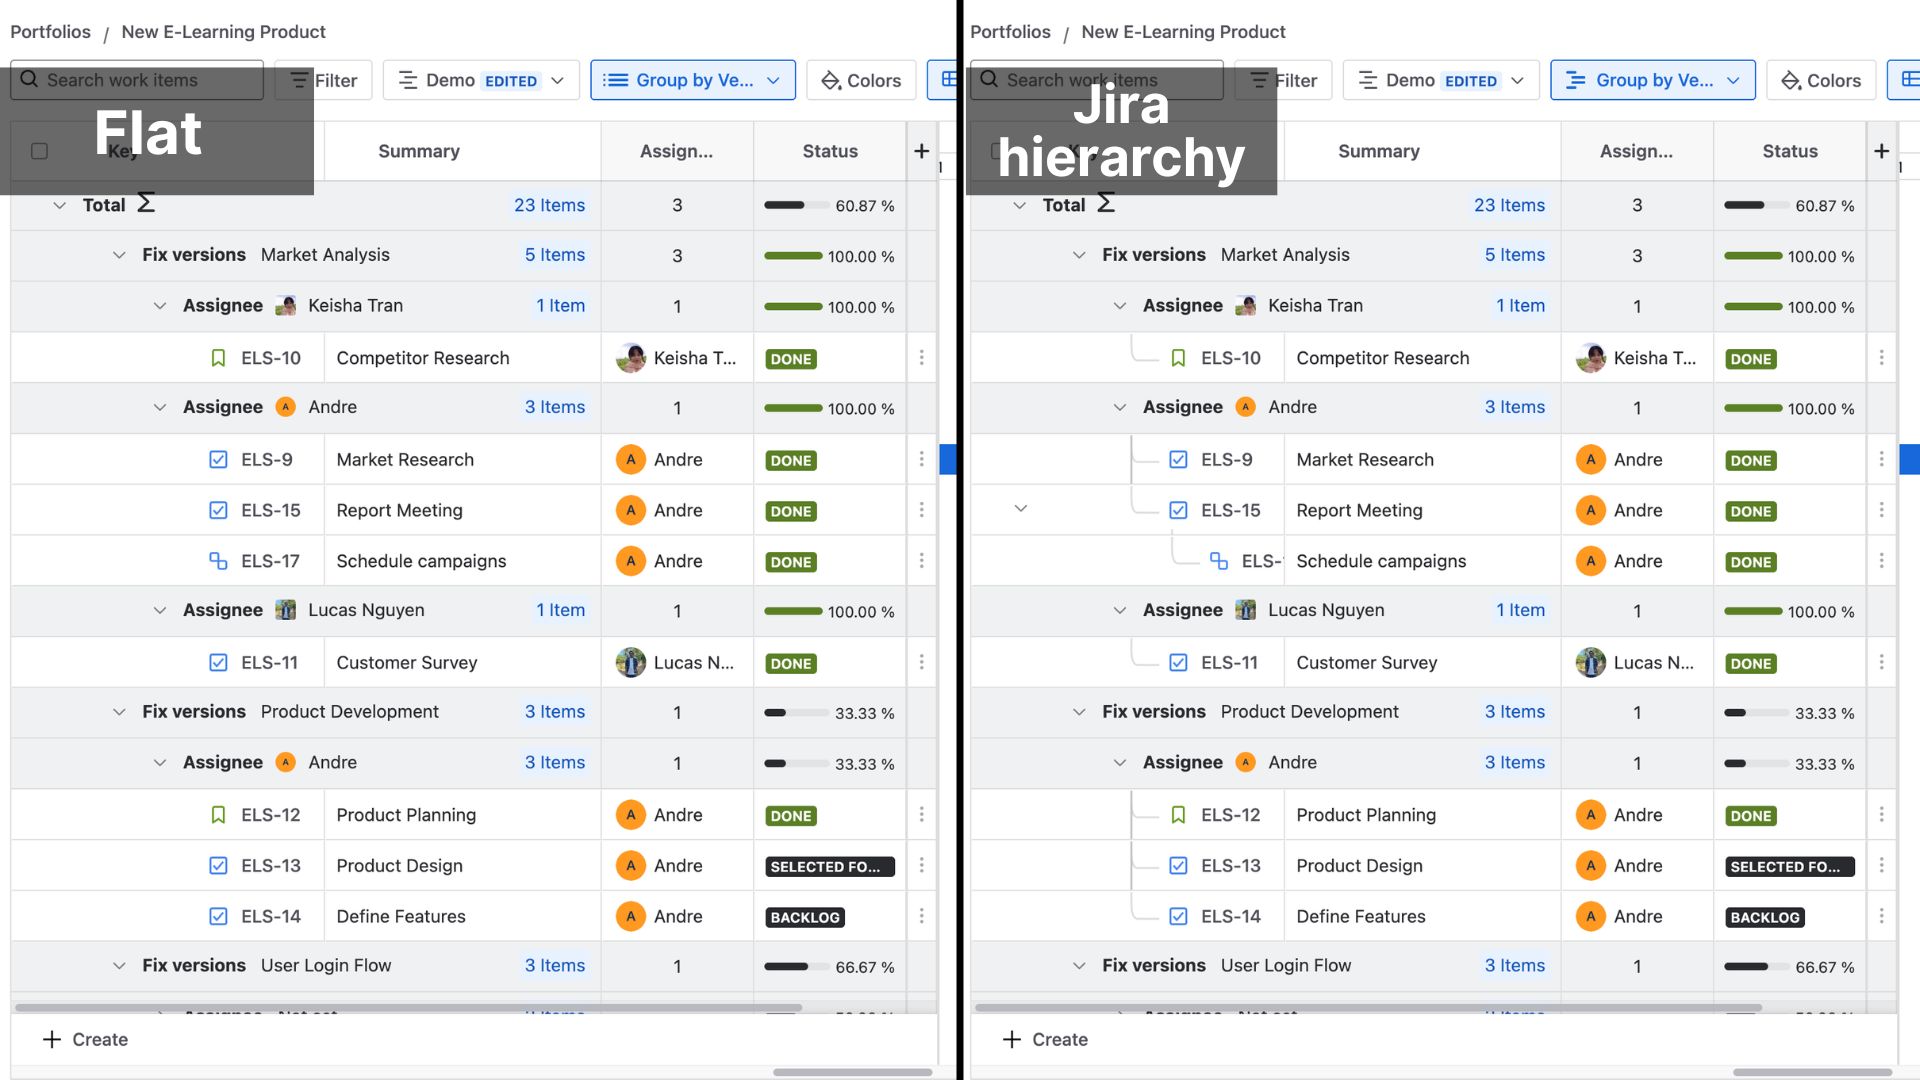
As mentioned above, you can switch to the Hierarchy view while creating or editing a custom group.
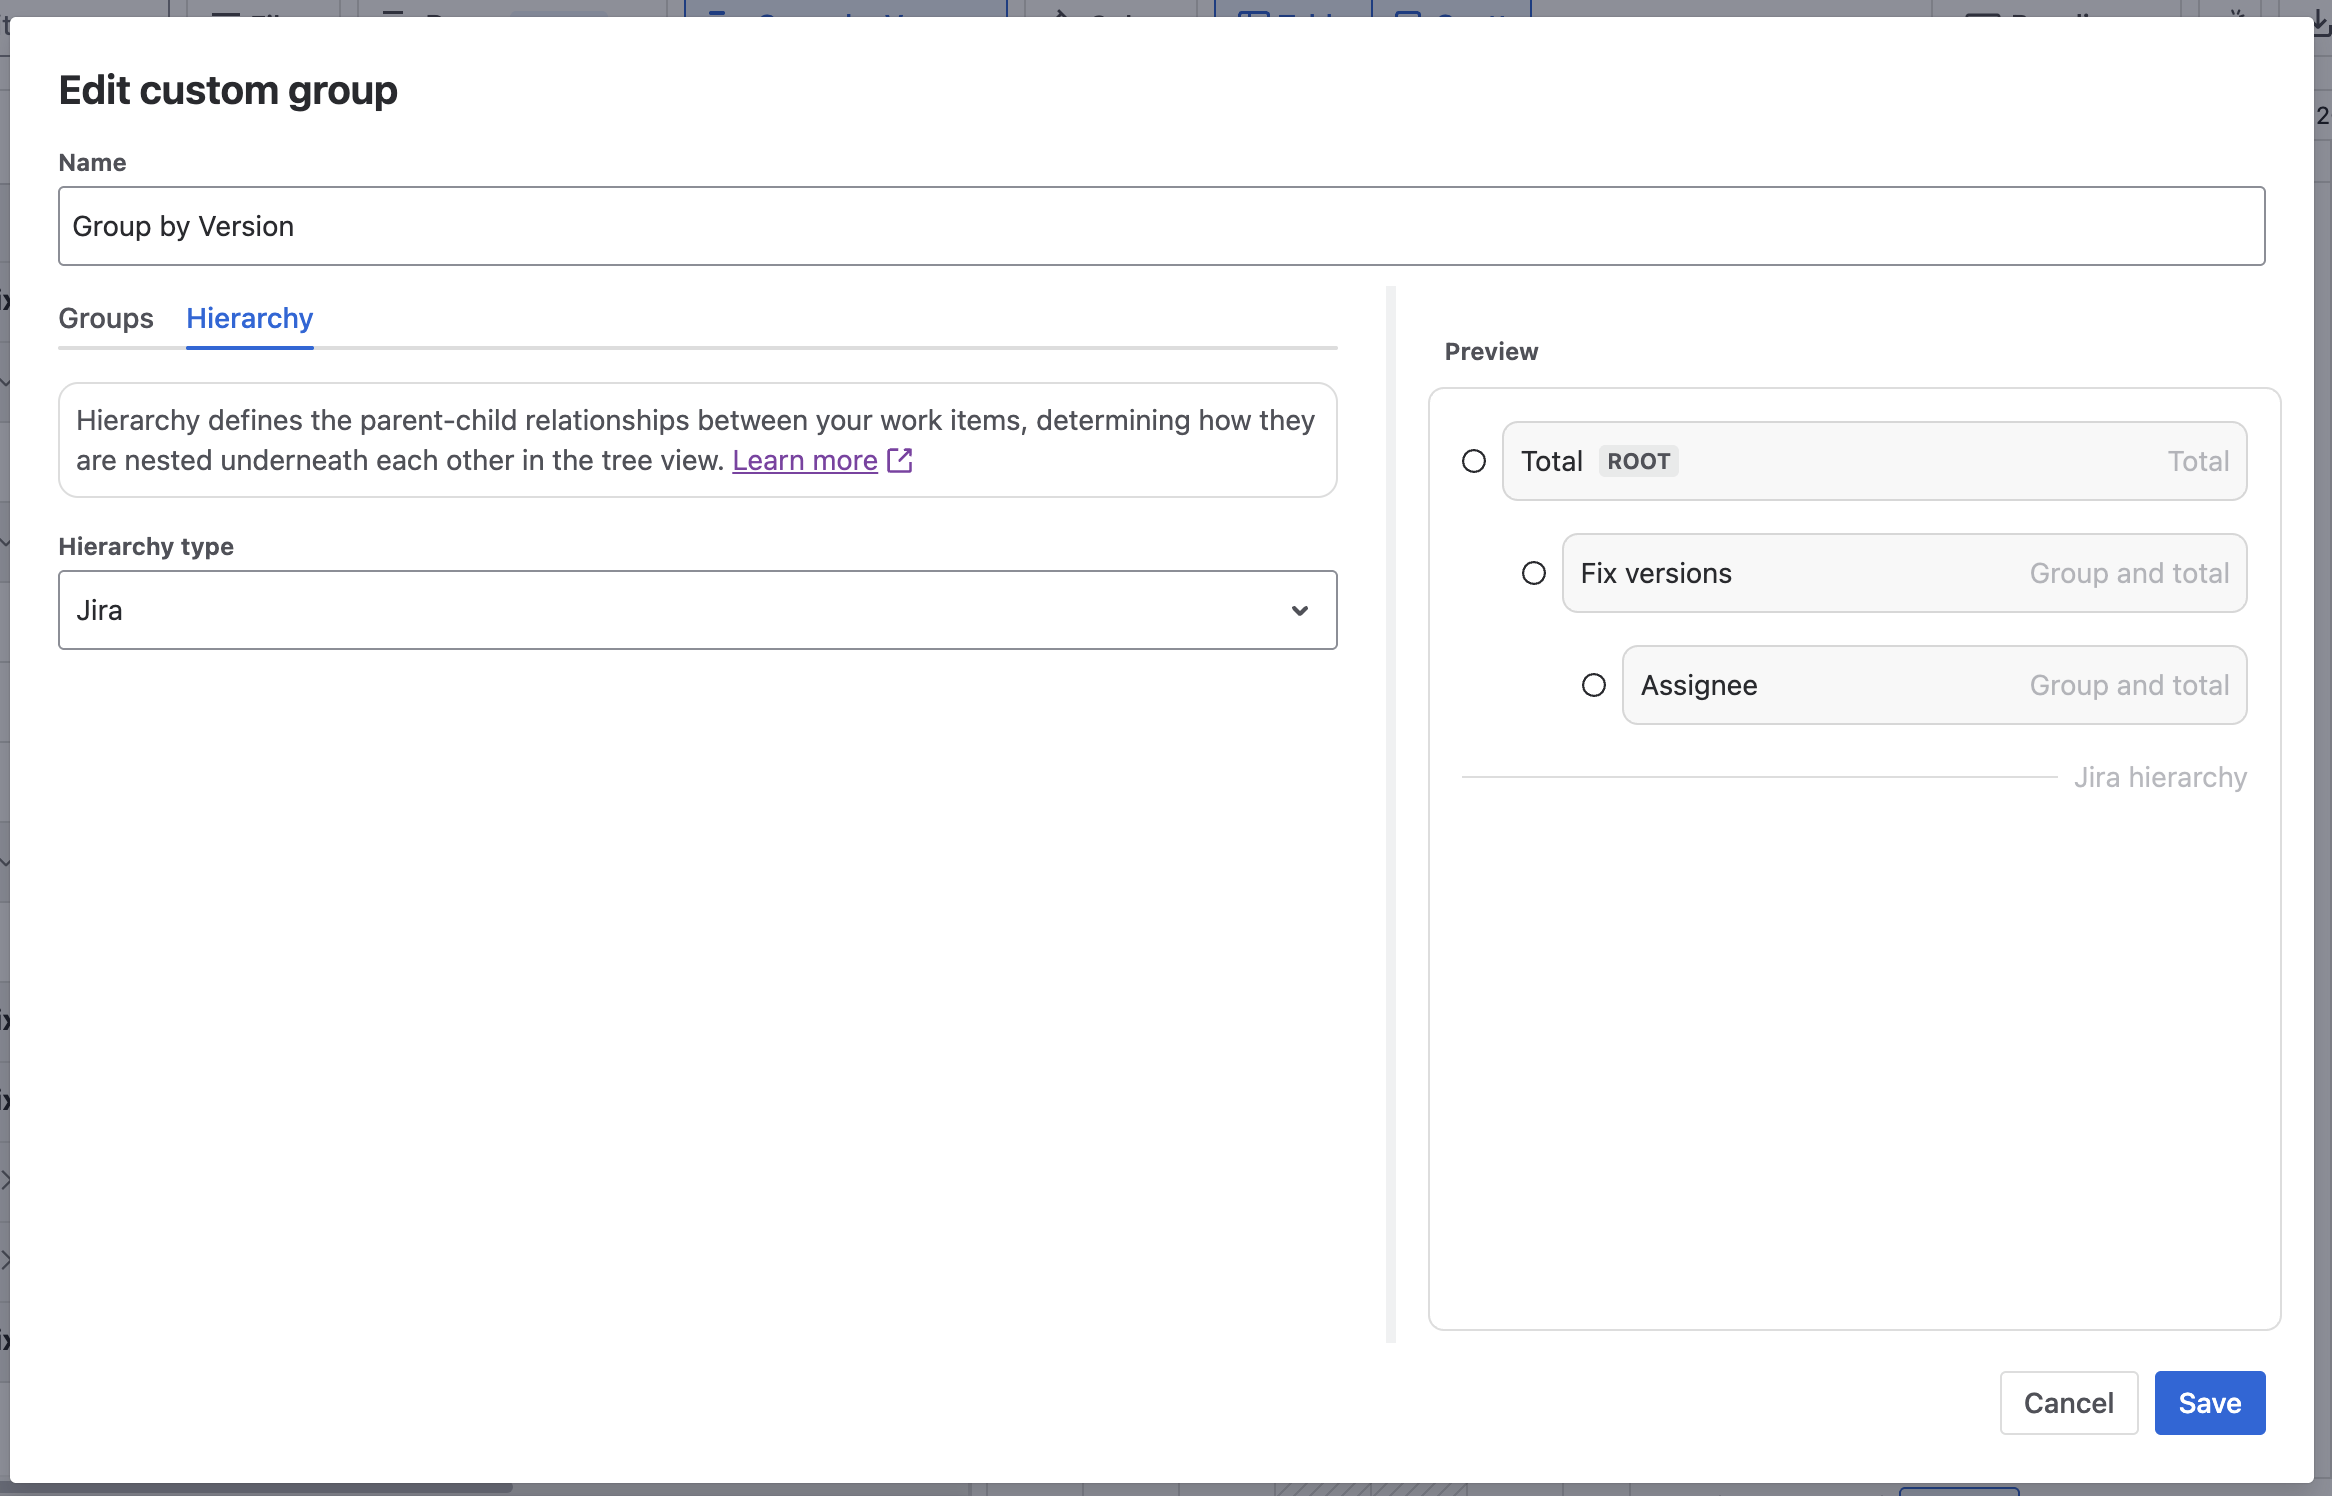
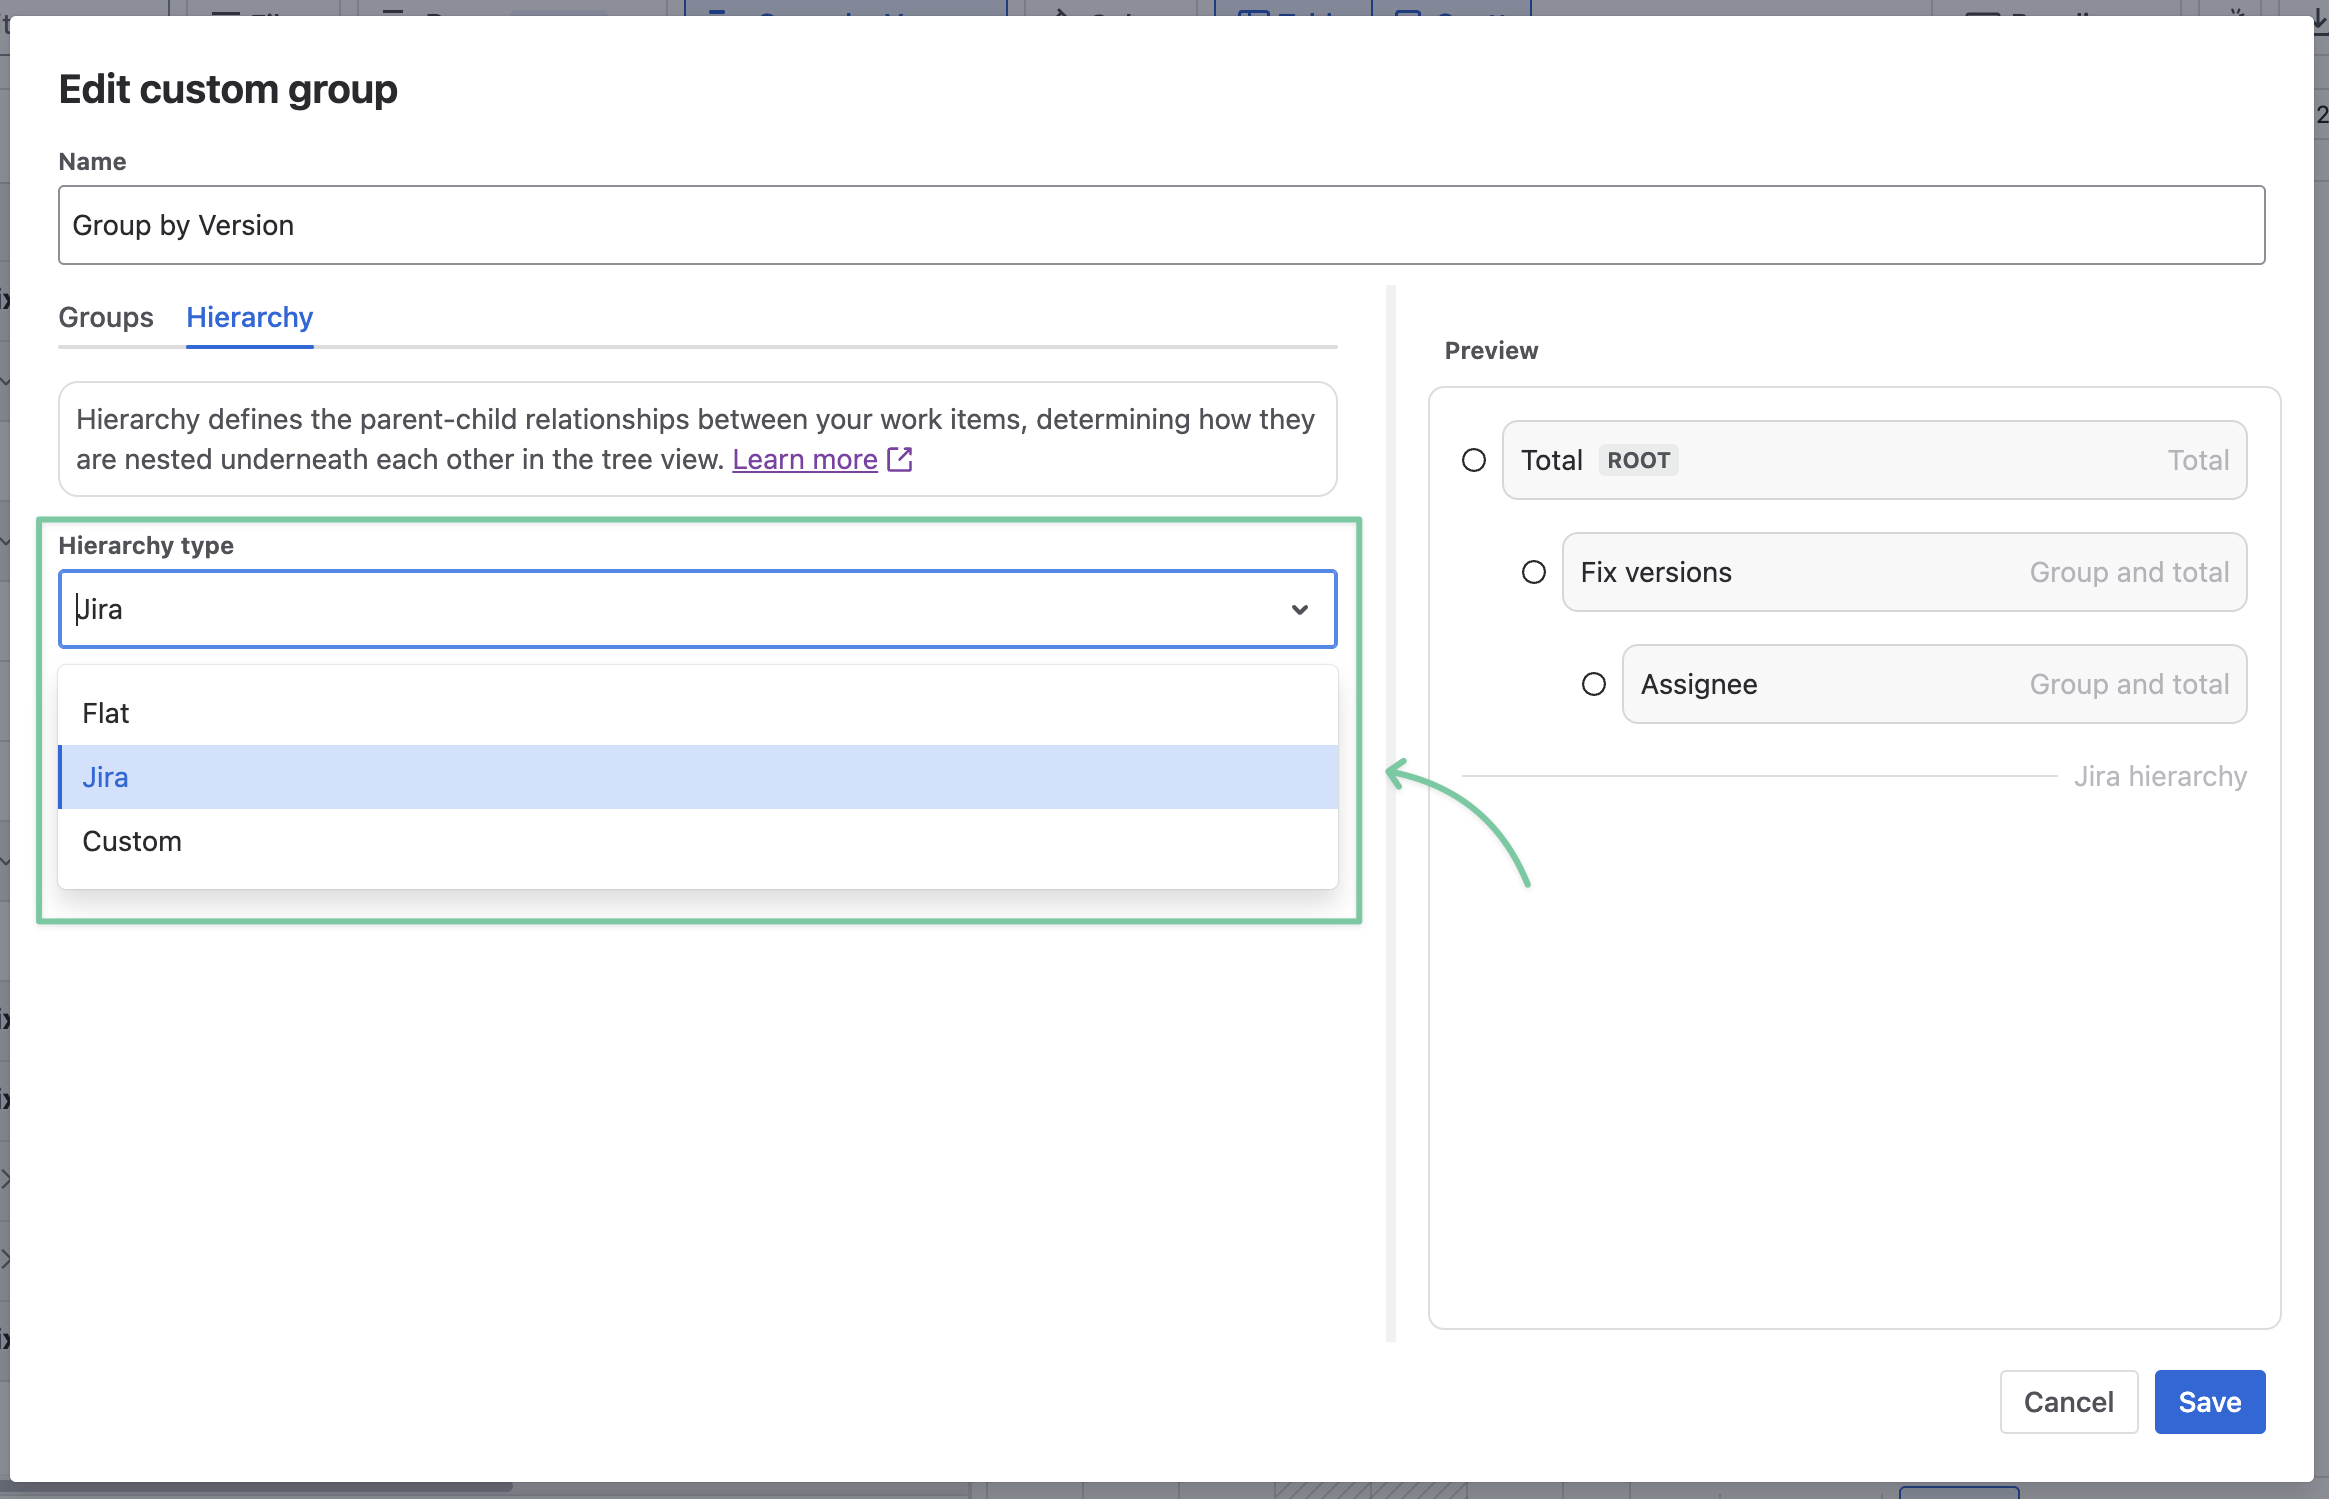
At the moment, you can choose between different hierarchy styles:
-
Flat
-
Jira
-
Custom
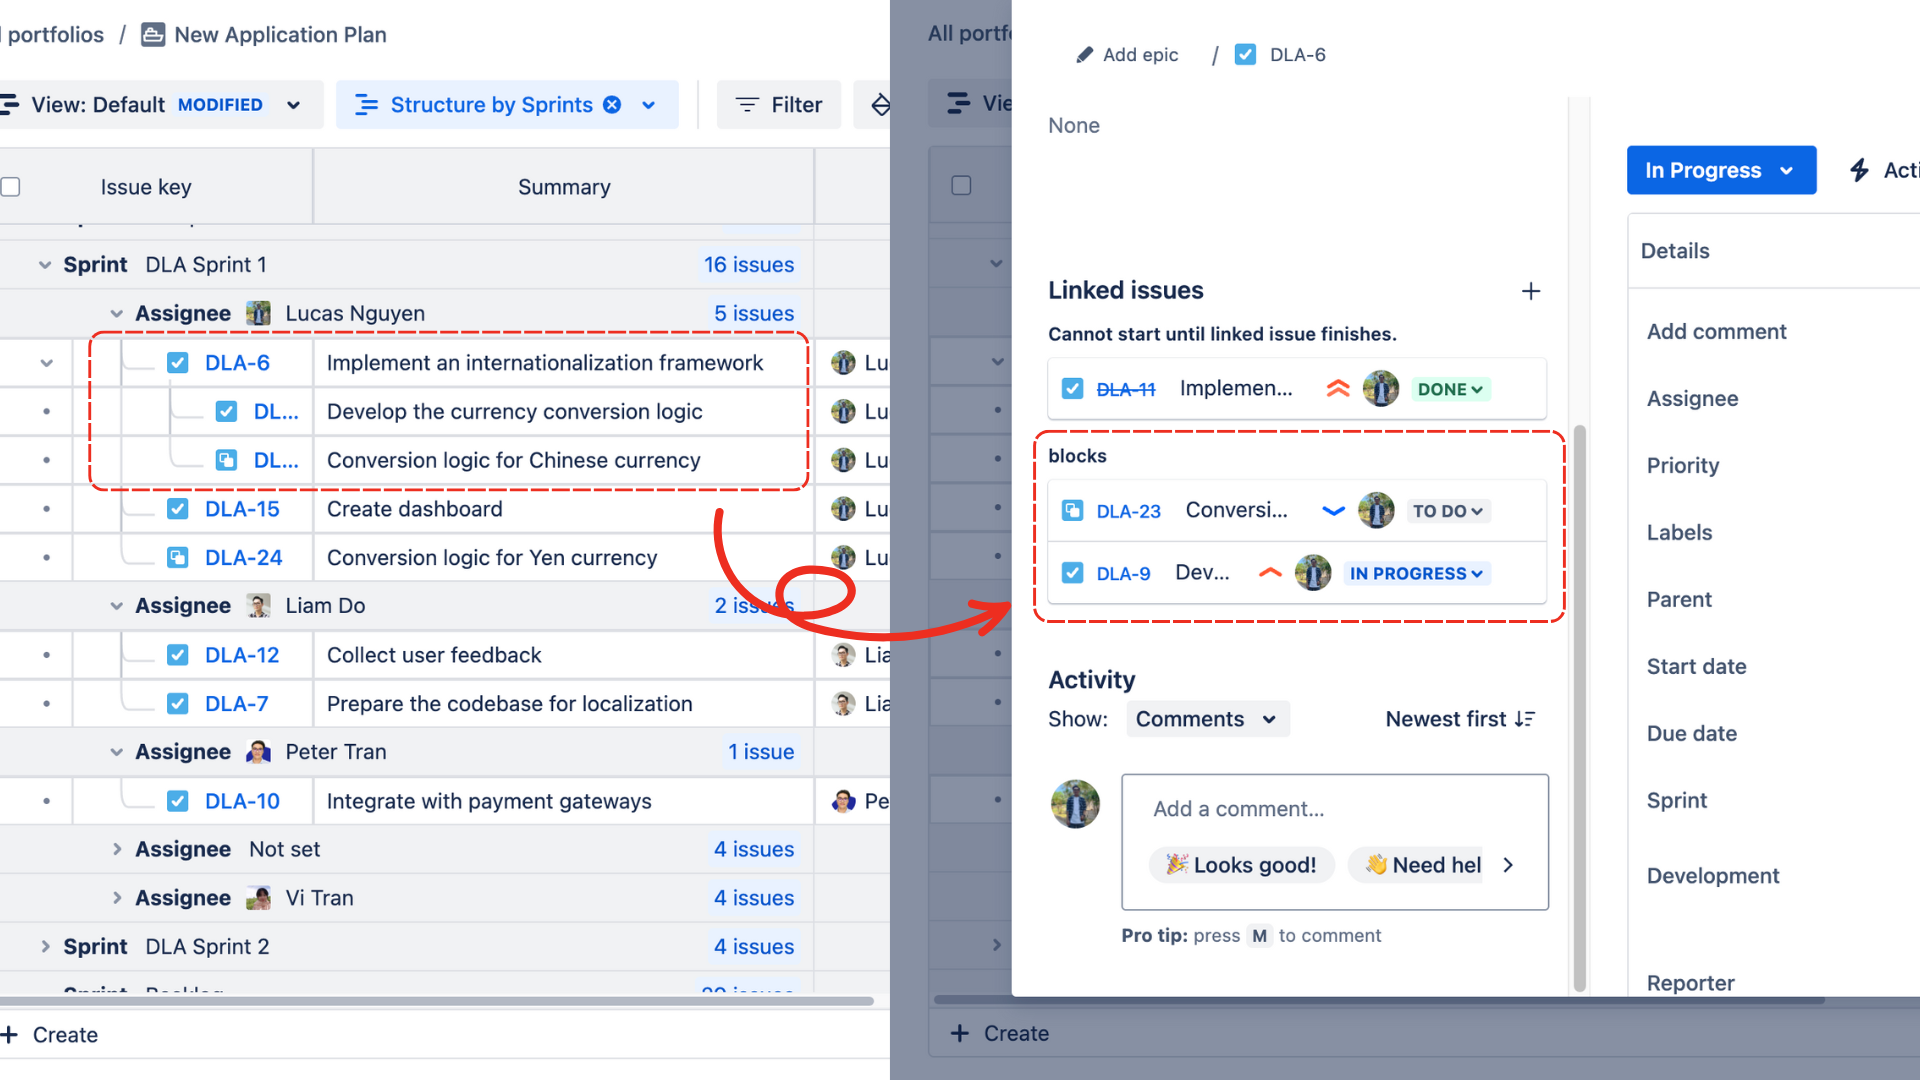
For Custom hierarchy in grouping, GanttTable uses the Issue link to visualize the hierarchy among issues on the table.
Its purpose is to empower users to make a flexible hierarchy in custom groups using the issue link type.
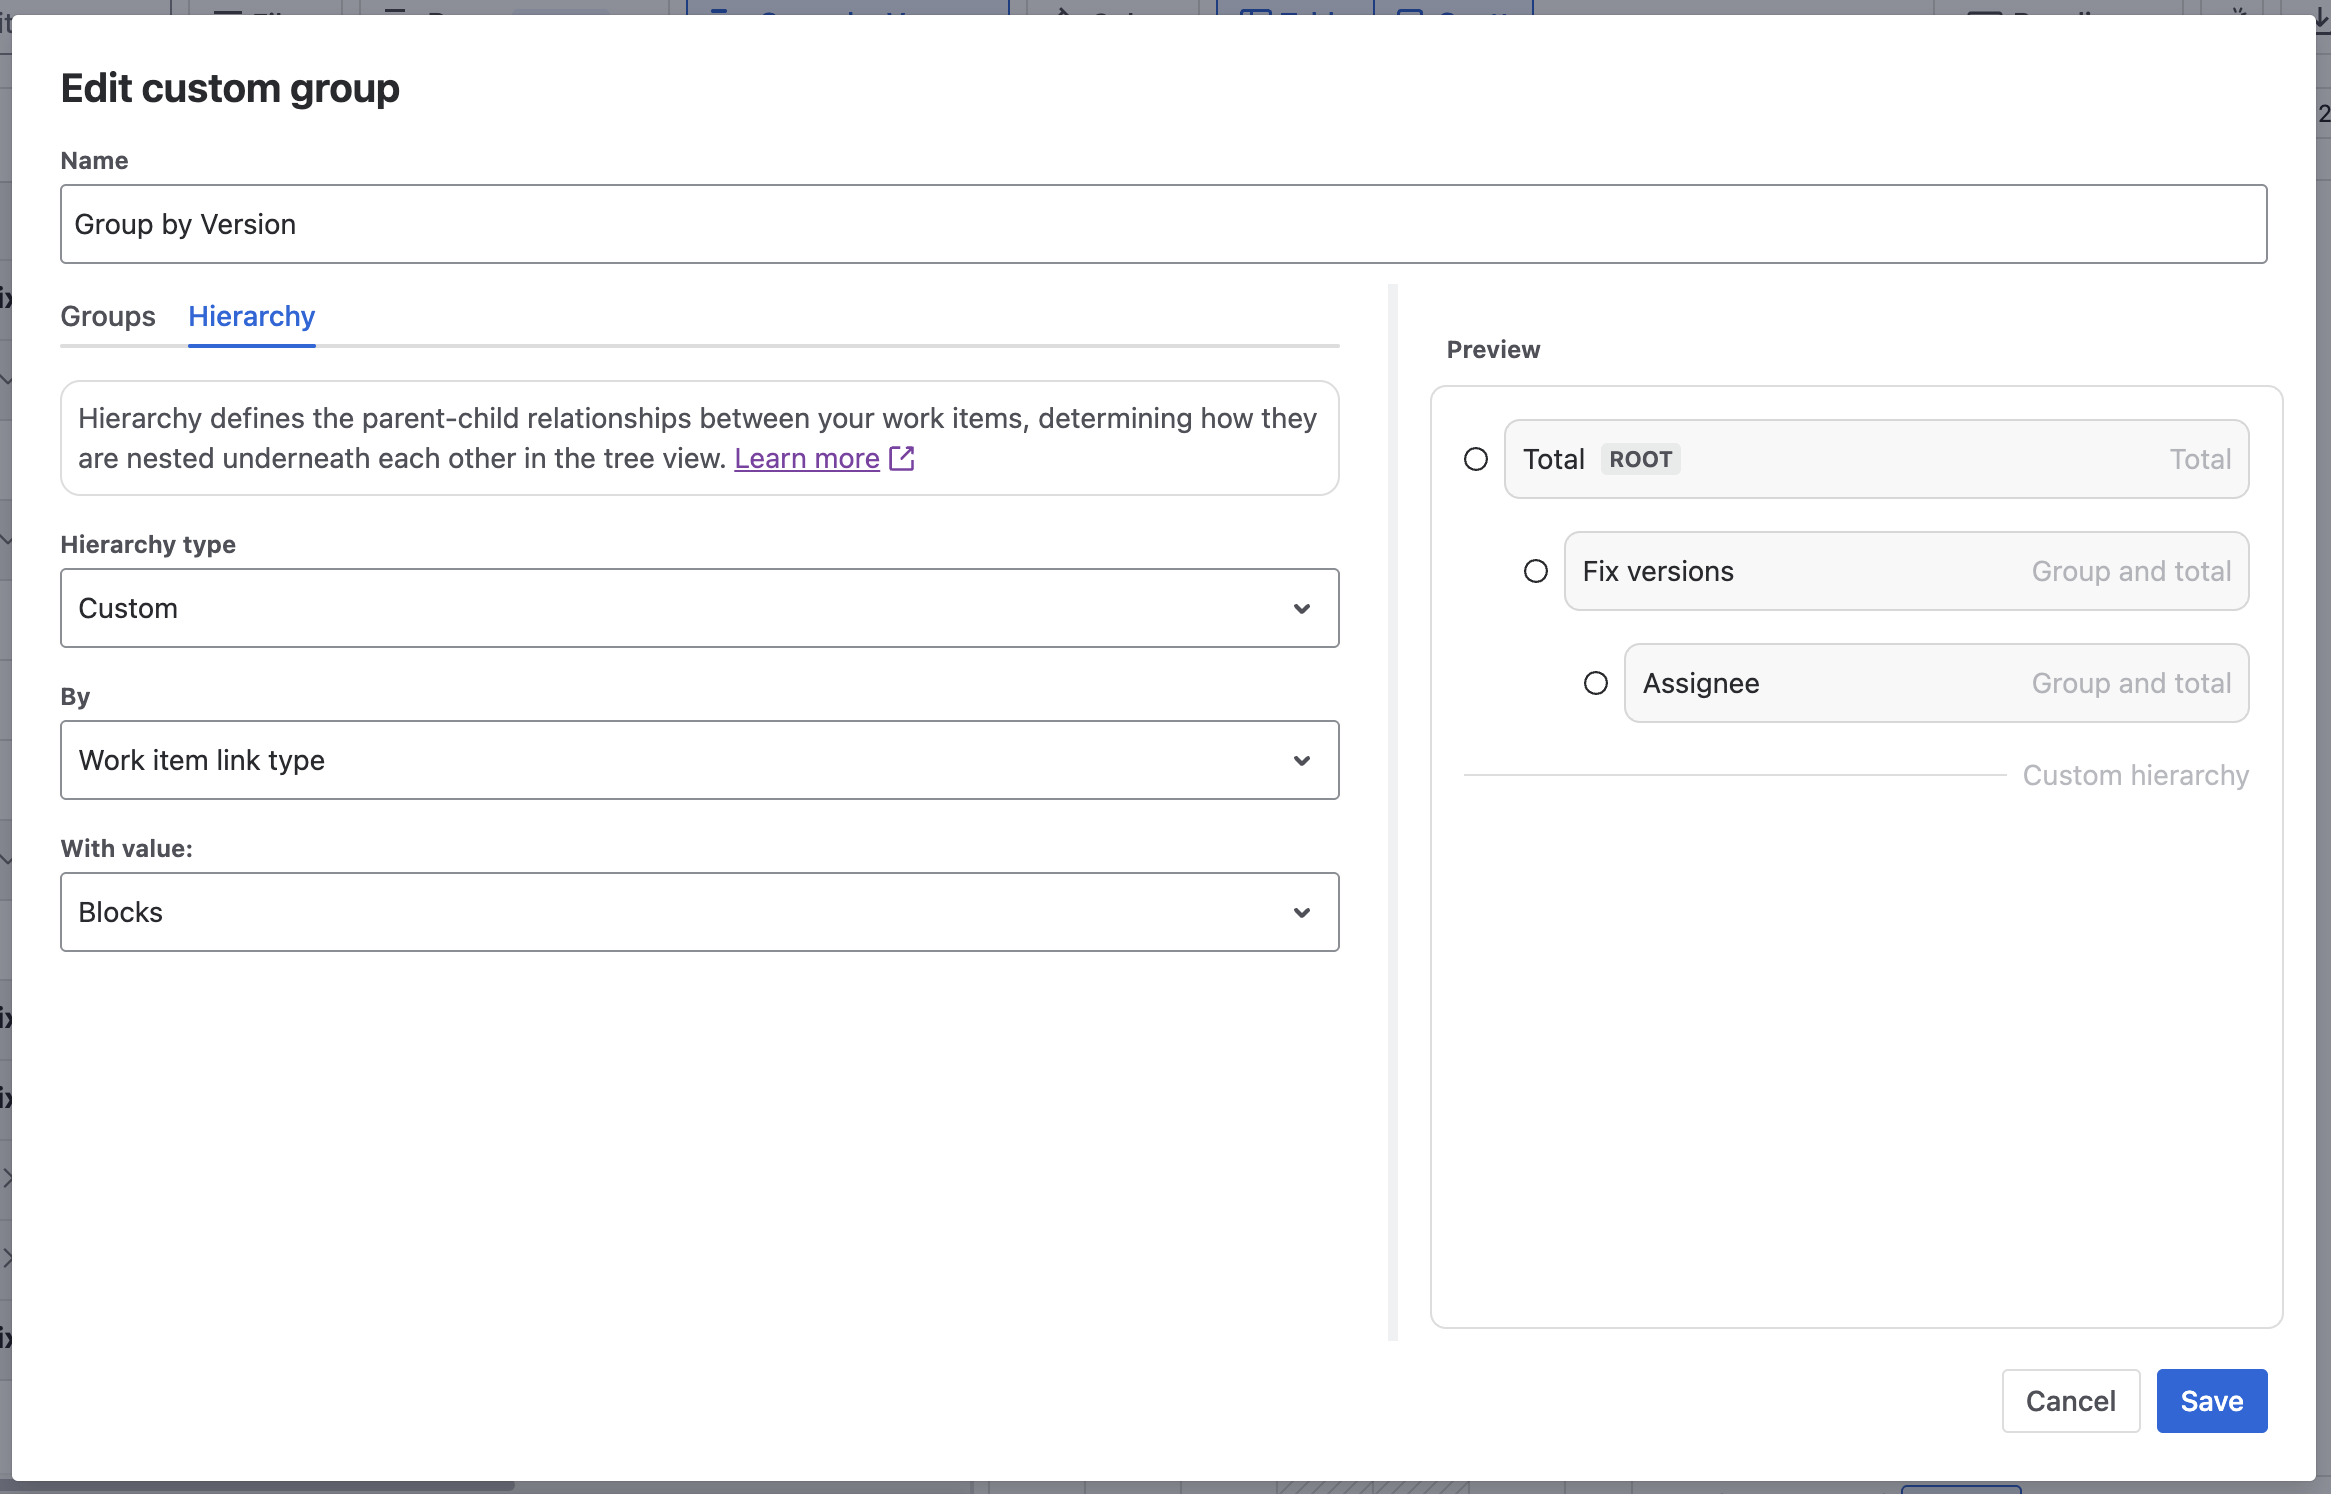
So, users can build and organize a nested issue system with Jira or a special issue link type that users have already defined in their instance.
-20250519-175425.png?cb=dd1a374c92a9105813fa4a18063fa13c)