.png)
The General Report is designed to provide users with a high-level overview of time management metrics. It offers a clear and concise snapshot of team worklogs, resource utilization, and enabling users to quickly assess how time is being allocated. By integrating key insights from both scheduled and logged time data, this report consolidates critical information across team members, projects, or tasks into a single, easy-to-read dashboard.
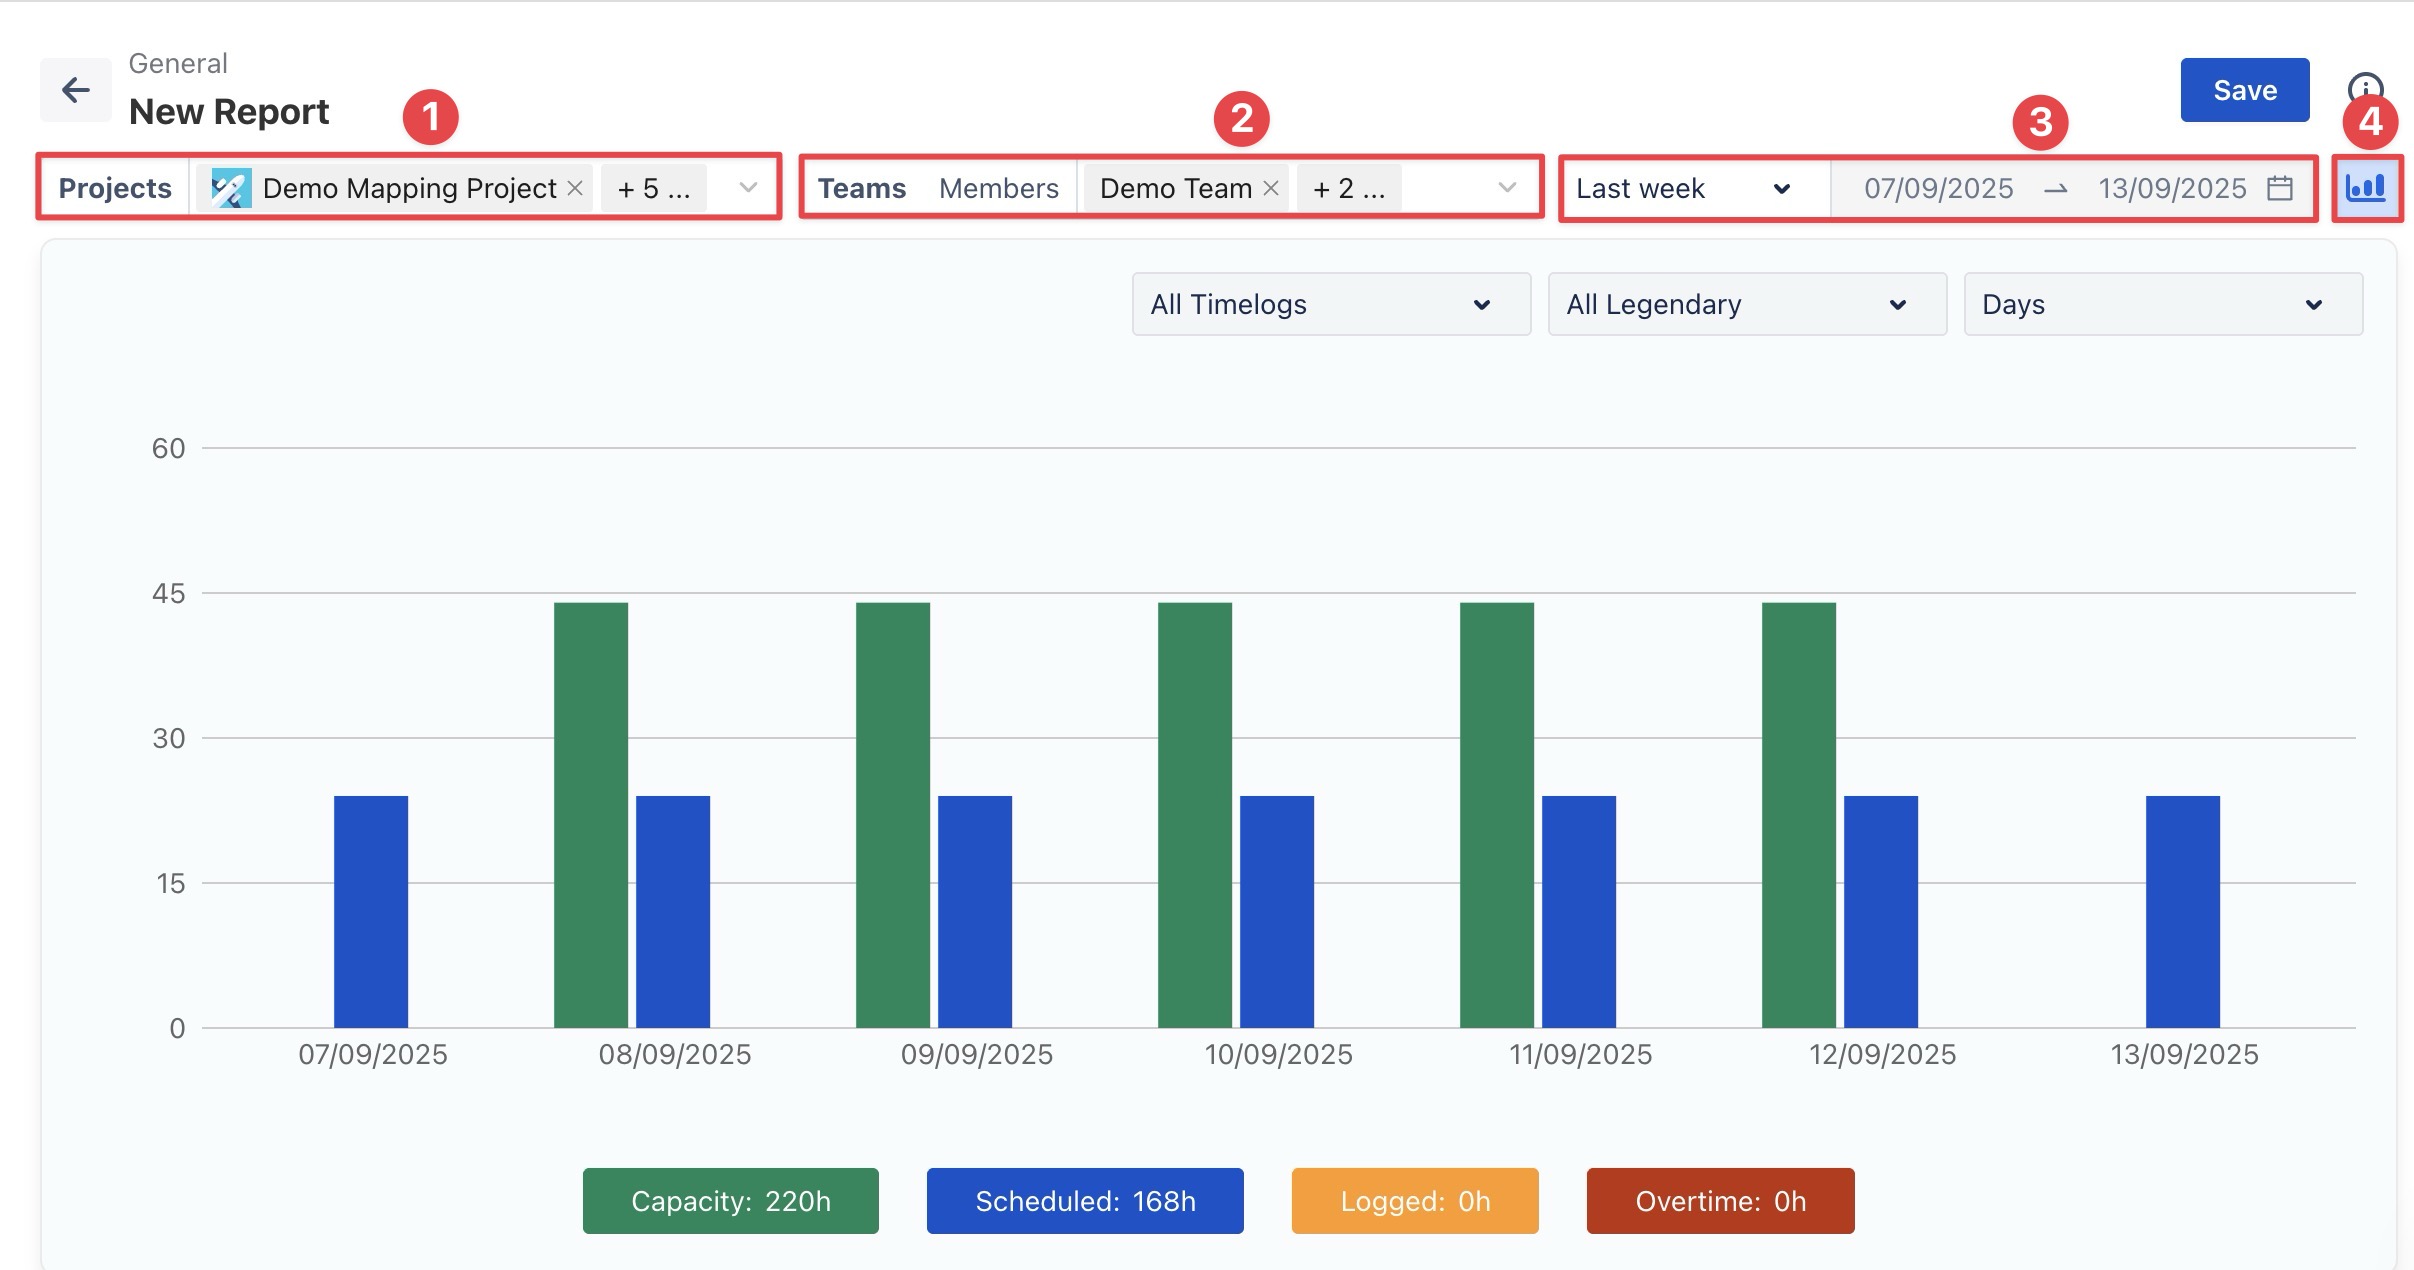
Step 1: Set Filters
At the first step, apply filters to define what data the report will include:
-
Projects: Select one or more projects to include in the report.
-
Members or Teams: Choose the individuals or teams whose data you want to analyze.
-
Time Range: Specify the reporting period. Two options are available:
-
Dynamic Range: Select a rolling date range, such as 'This Week' or 'Last 30 Days'. The report will update automatically as time progresses.
-
Fixed Range: Select a custom start and end date to lock the report to a specific period.
-
Chart: Enable this option if you want the report displayed with visual charts in addition to the tabular view.
Step 2: Chart Customization Options
If you enable charts in your report, you can adjust how the data is displayed:
-
Approved / Pending / Rejected Timelogs: Show timelogs filtered by their approval status.
-
Capacity vs. Scheduled: Compare available capacity with scheduled hours.
-
Scheduled vs. Logged: Compare planned hours with actual time logged.
-
Days / Weeks / Months: Group the data by day, week, or month within the selected time range.
step 3 Analyze Data in the Table Report
Table Report can be viewed in two formats: Flat View and Hierarchy View.
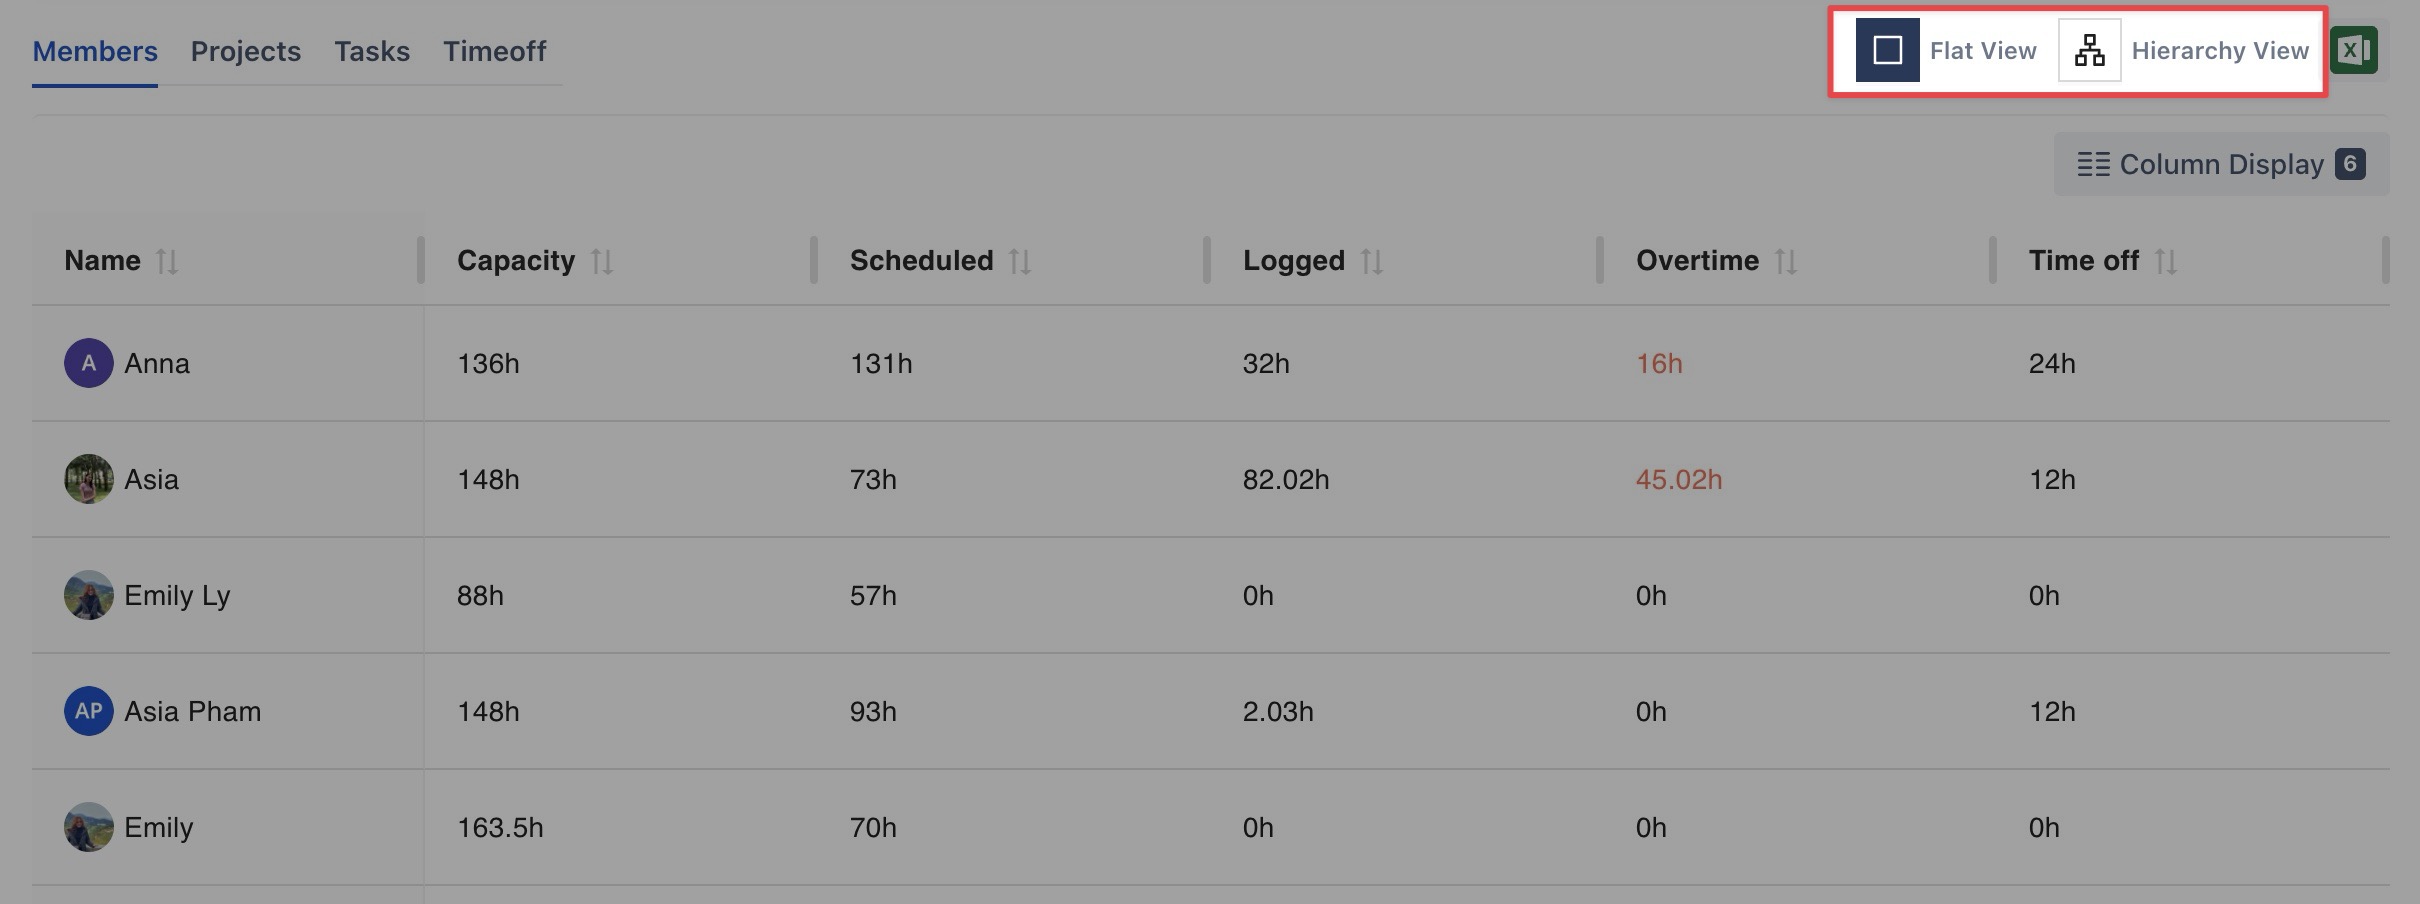
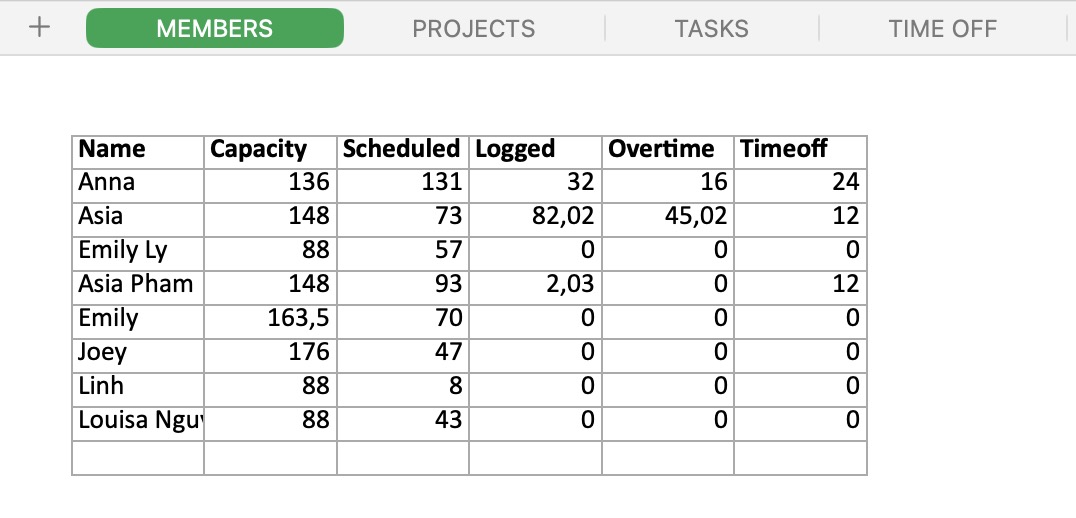
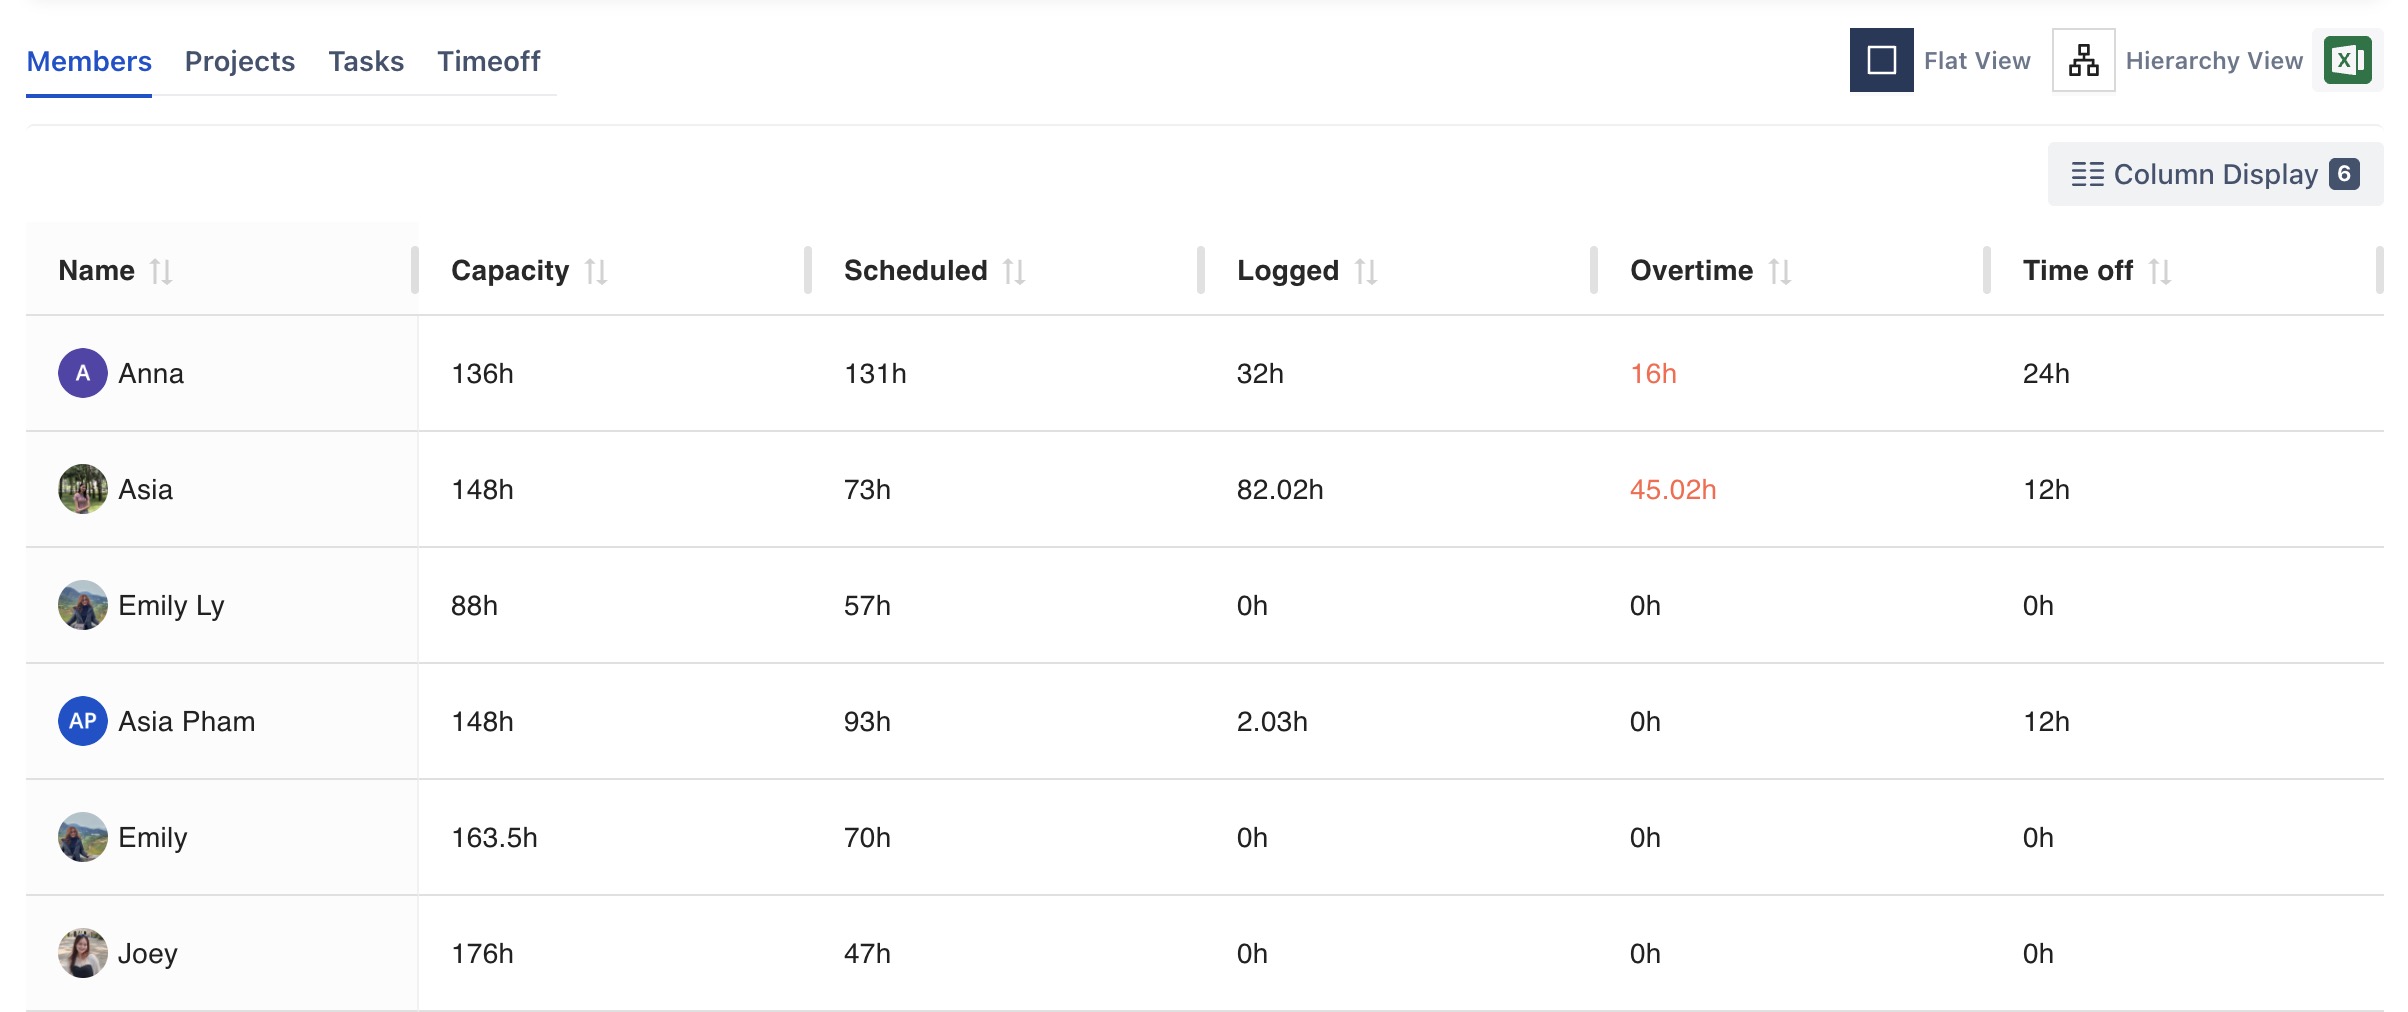
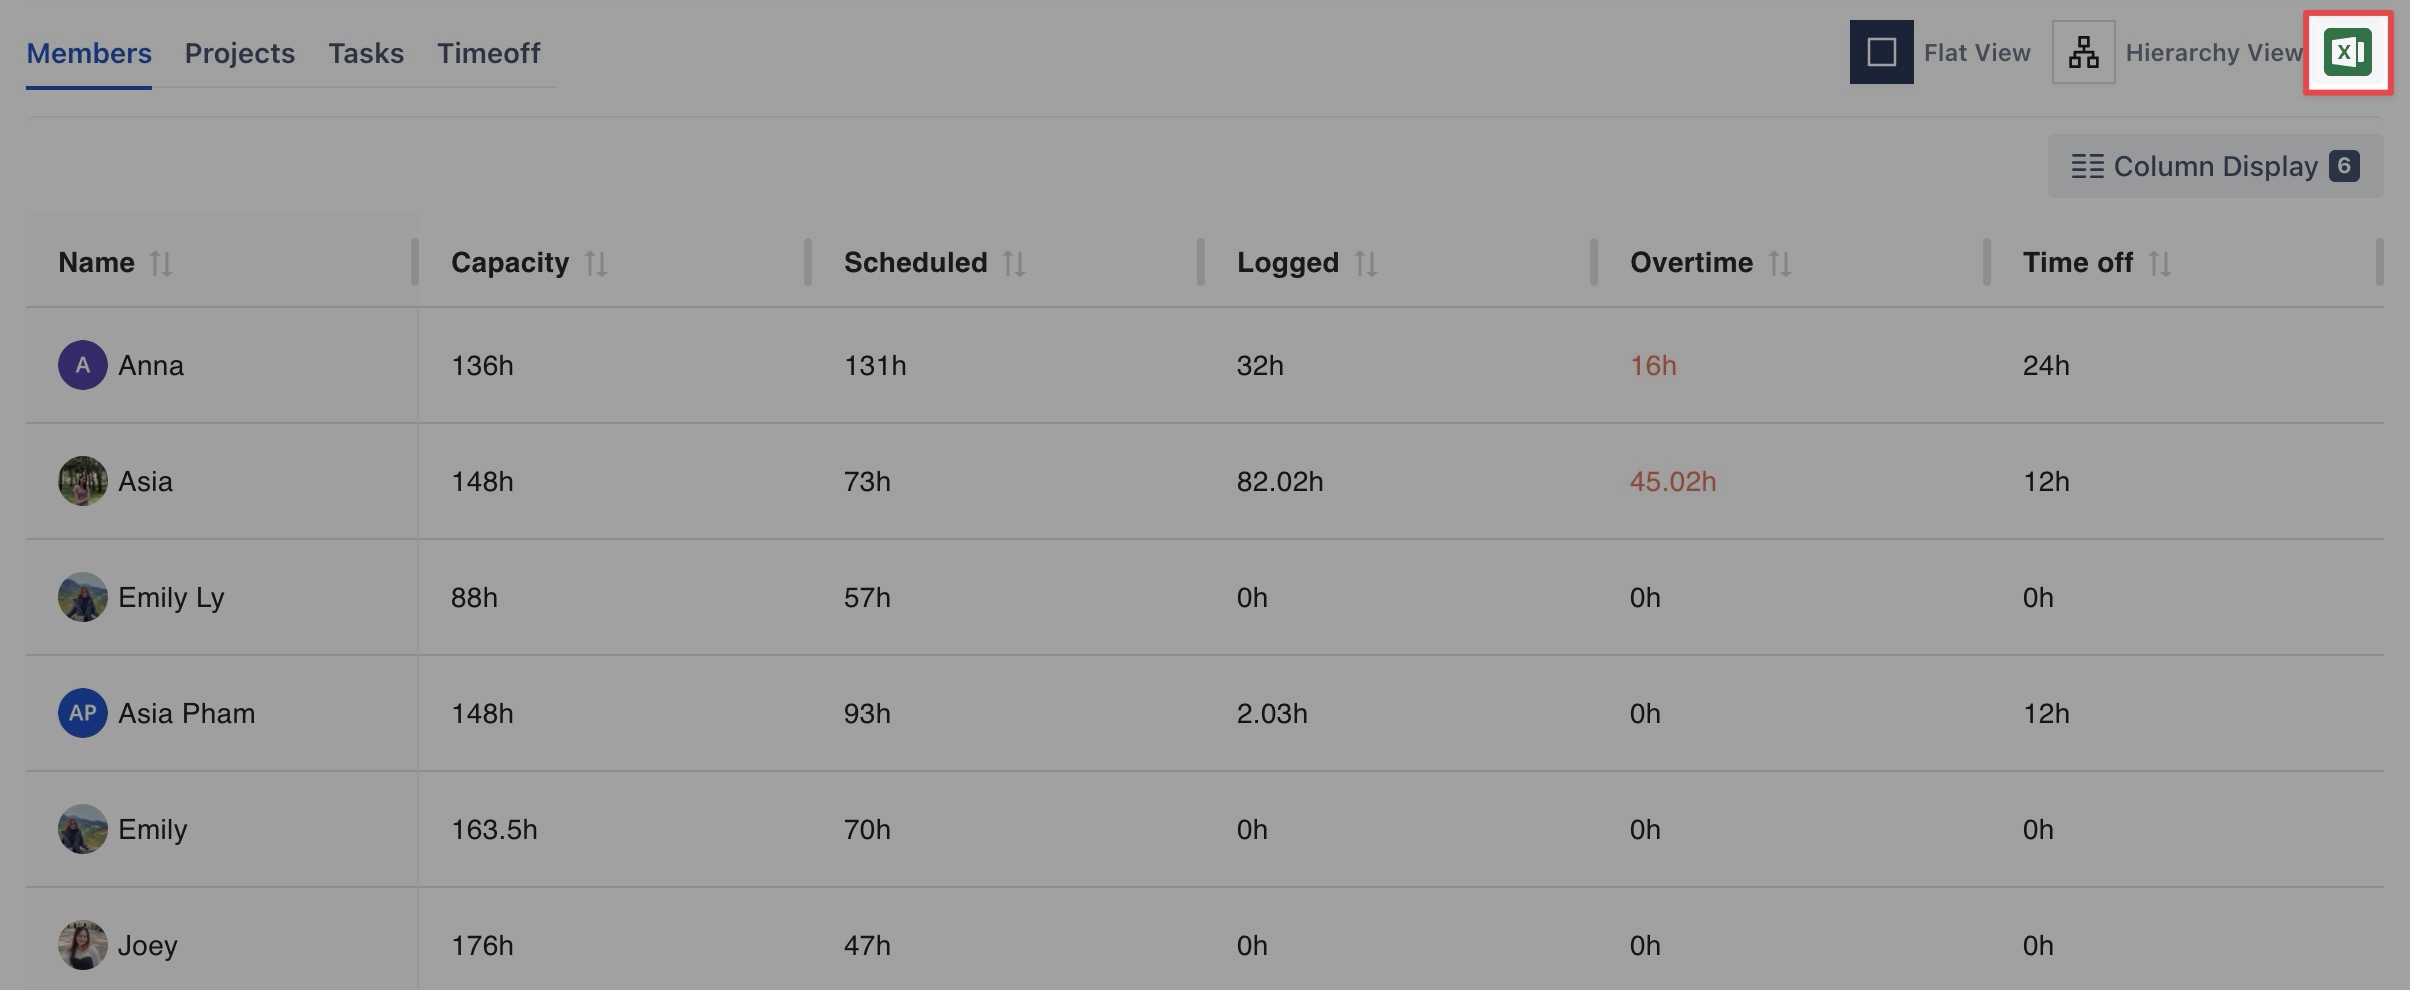
Flat View
The Flat View provides detailed statistical reports for members, projects, tasks, or time off:
Members: View capacity hours, scheduled time, logged time, and overtime/undertime for each team member.
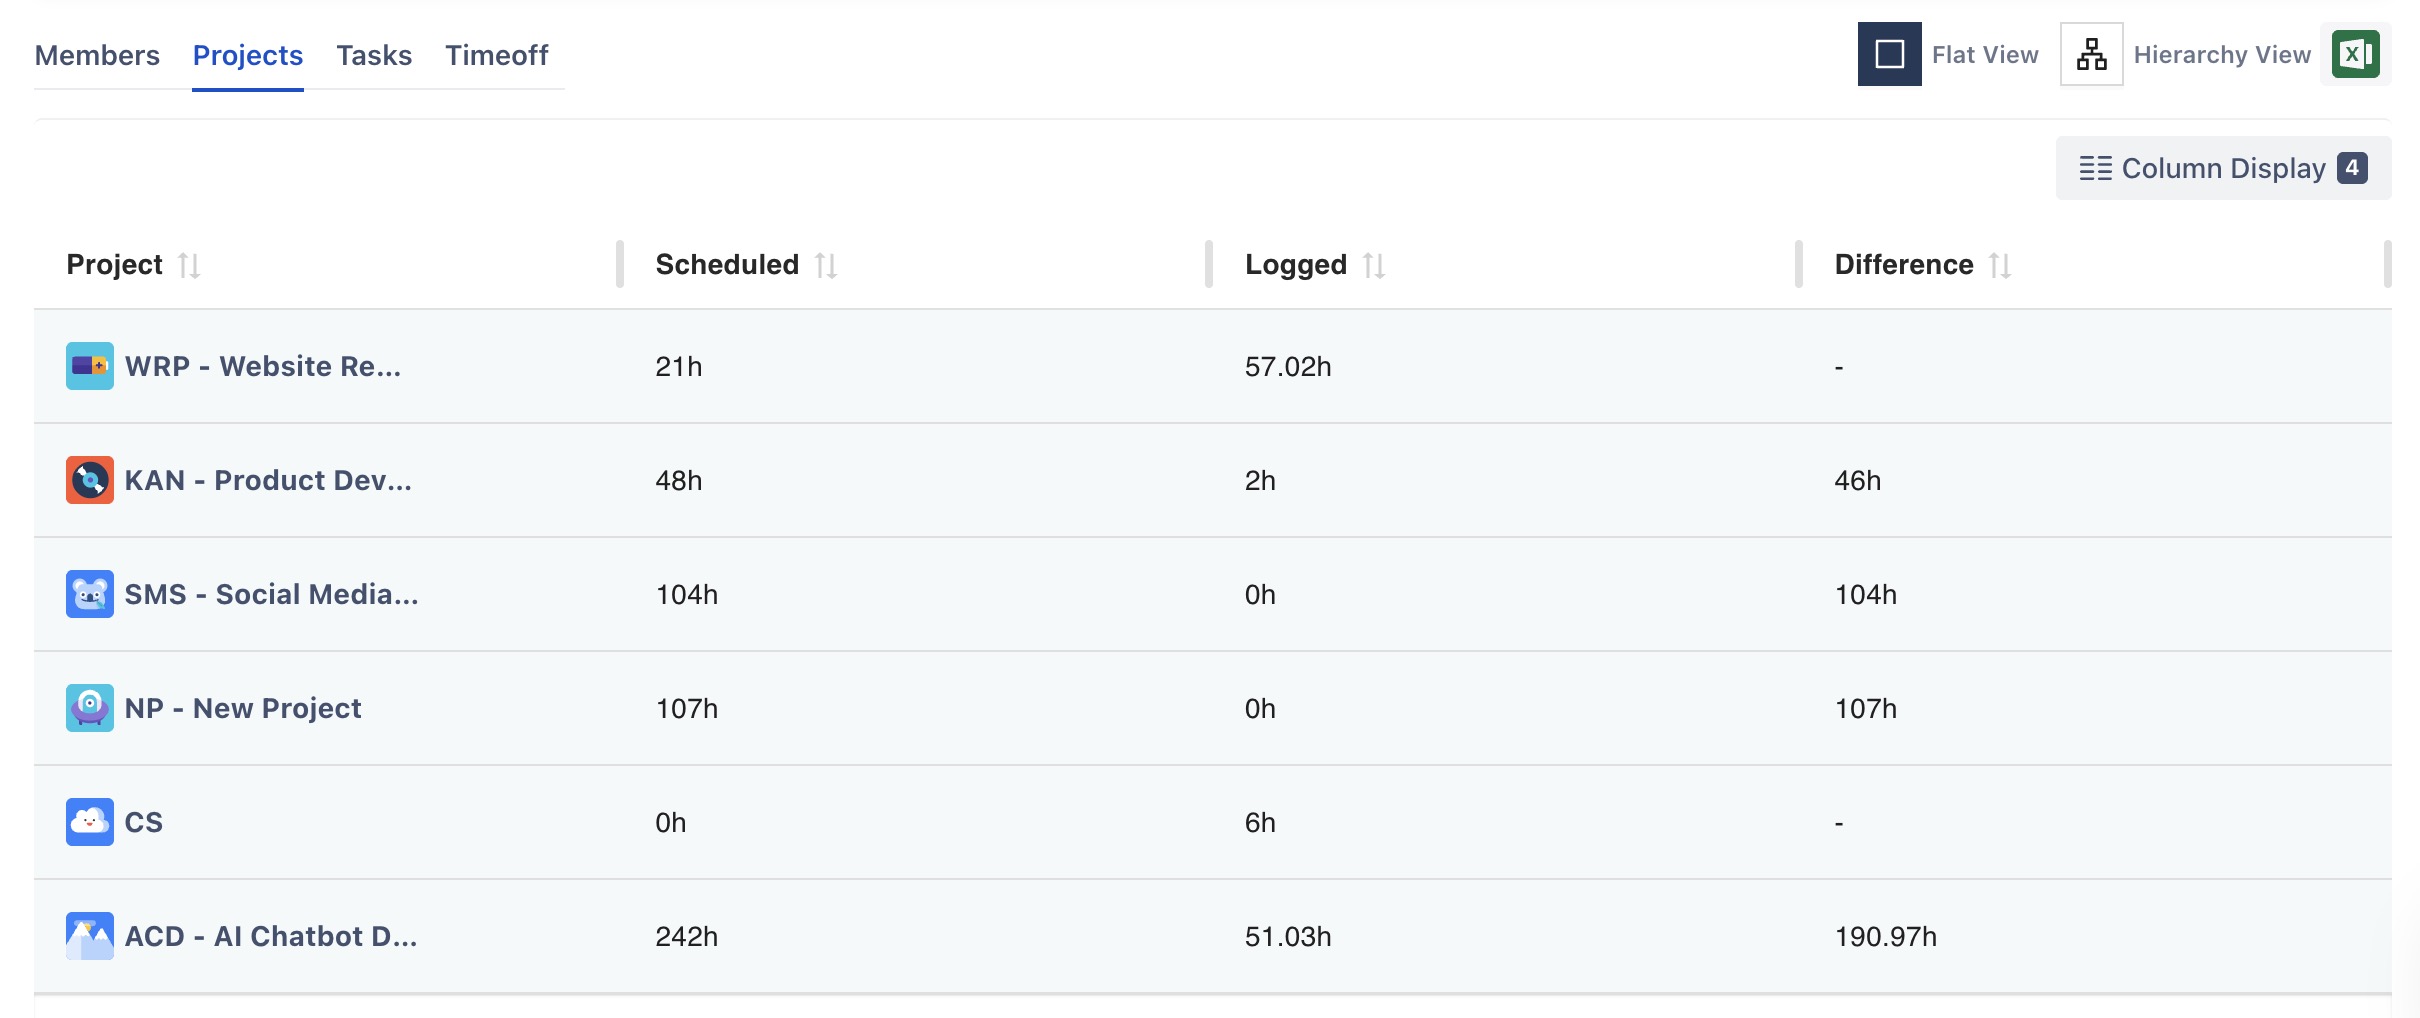
Projects & Tasks: See scheduled time, logged time, and the variance between them for each project or task.
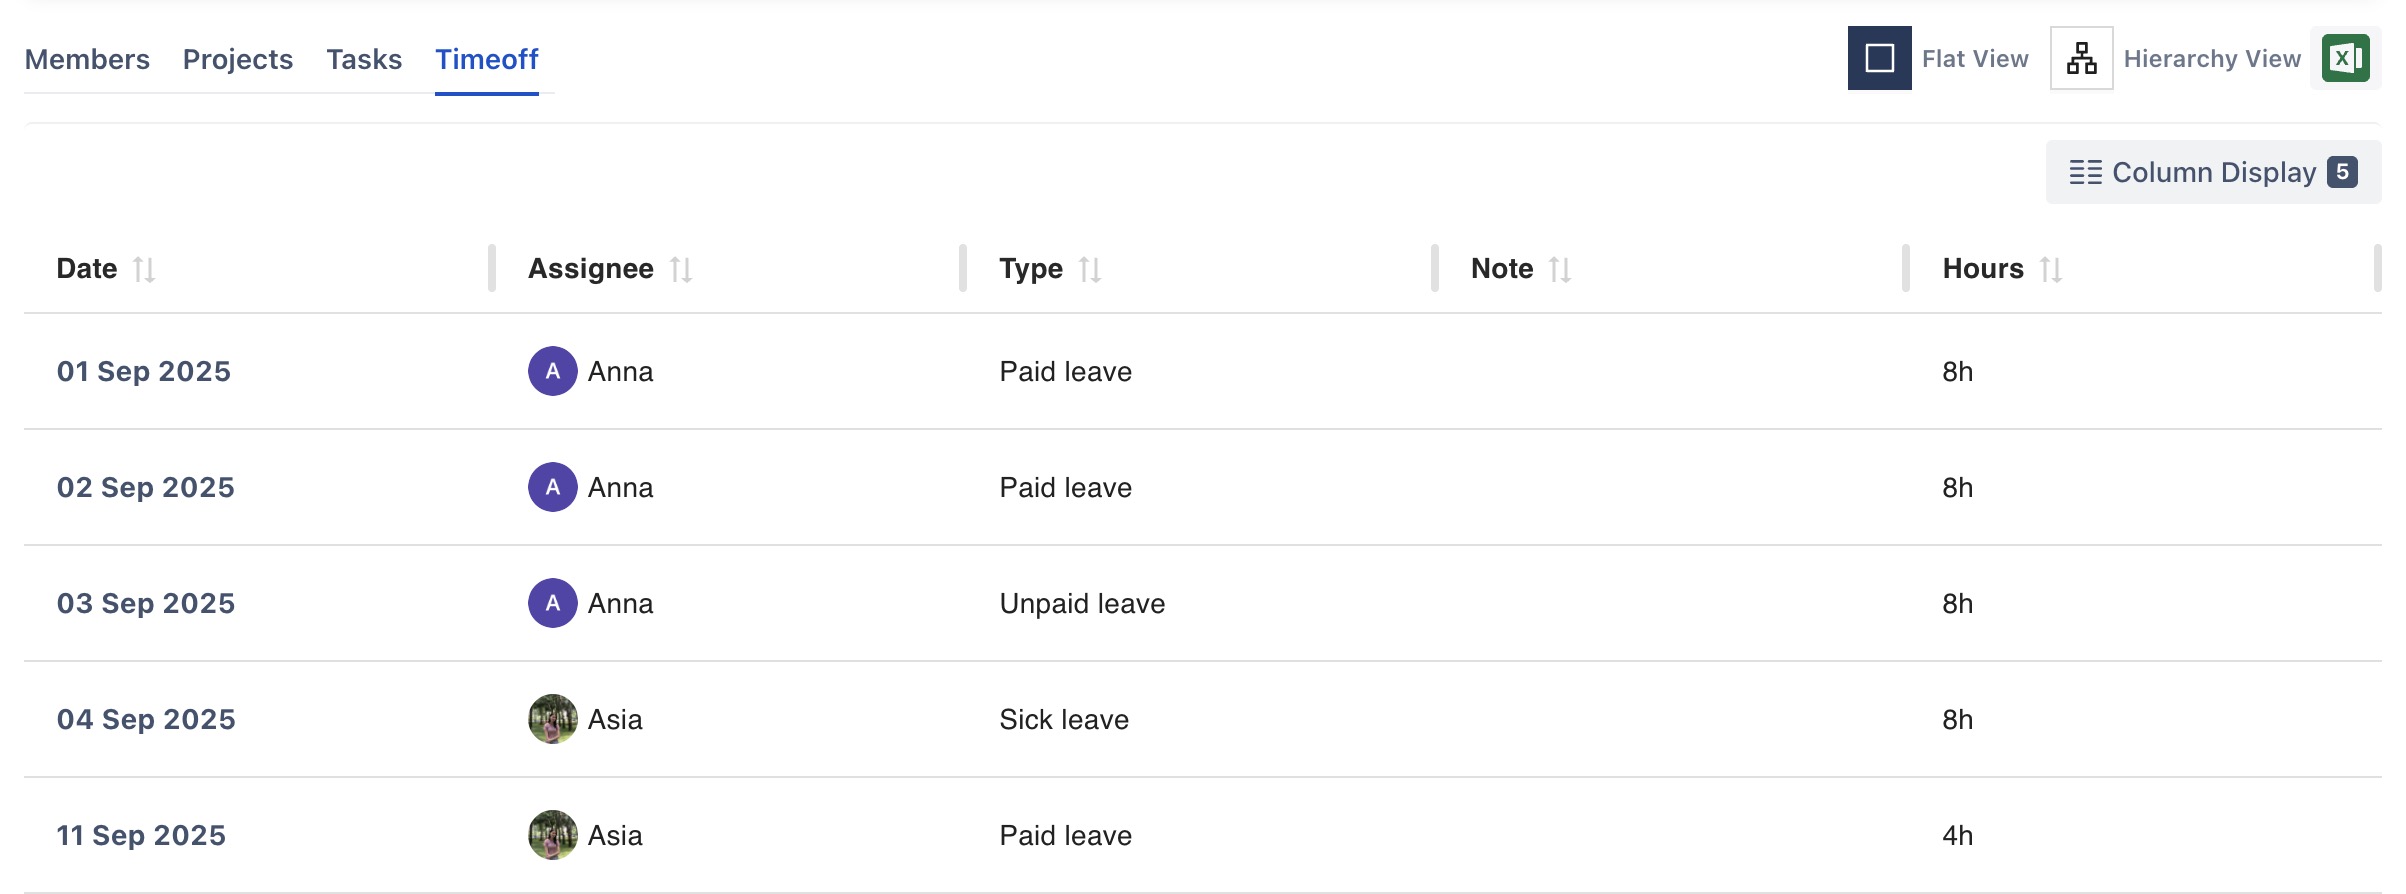
Timeoff: Track leave and absences for team members within the selected date range.
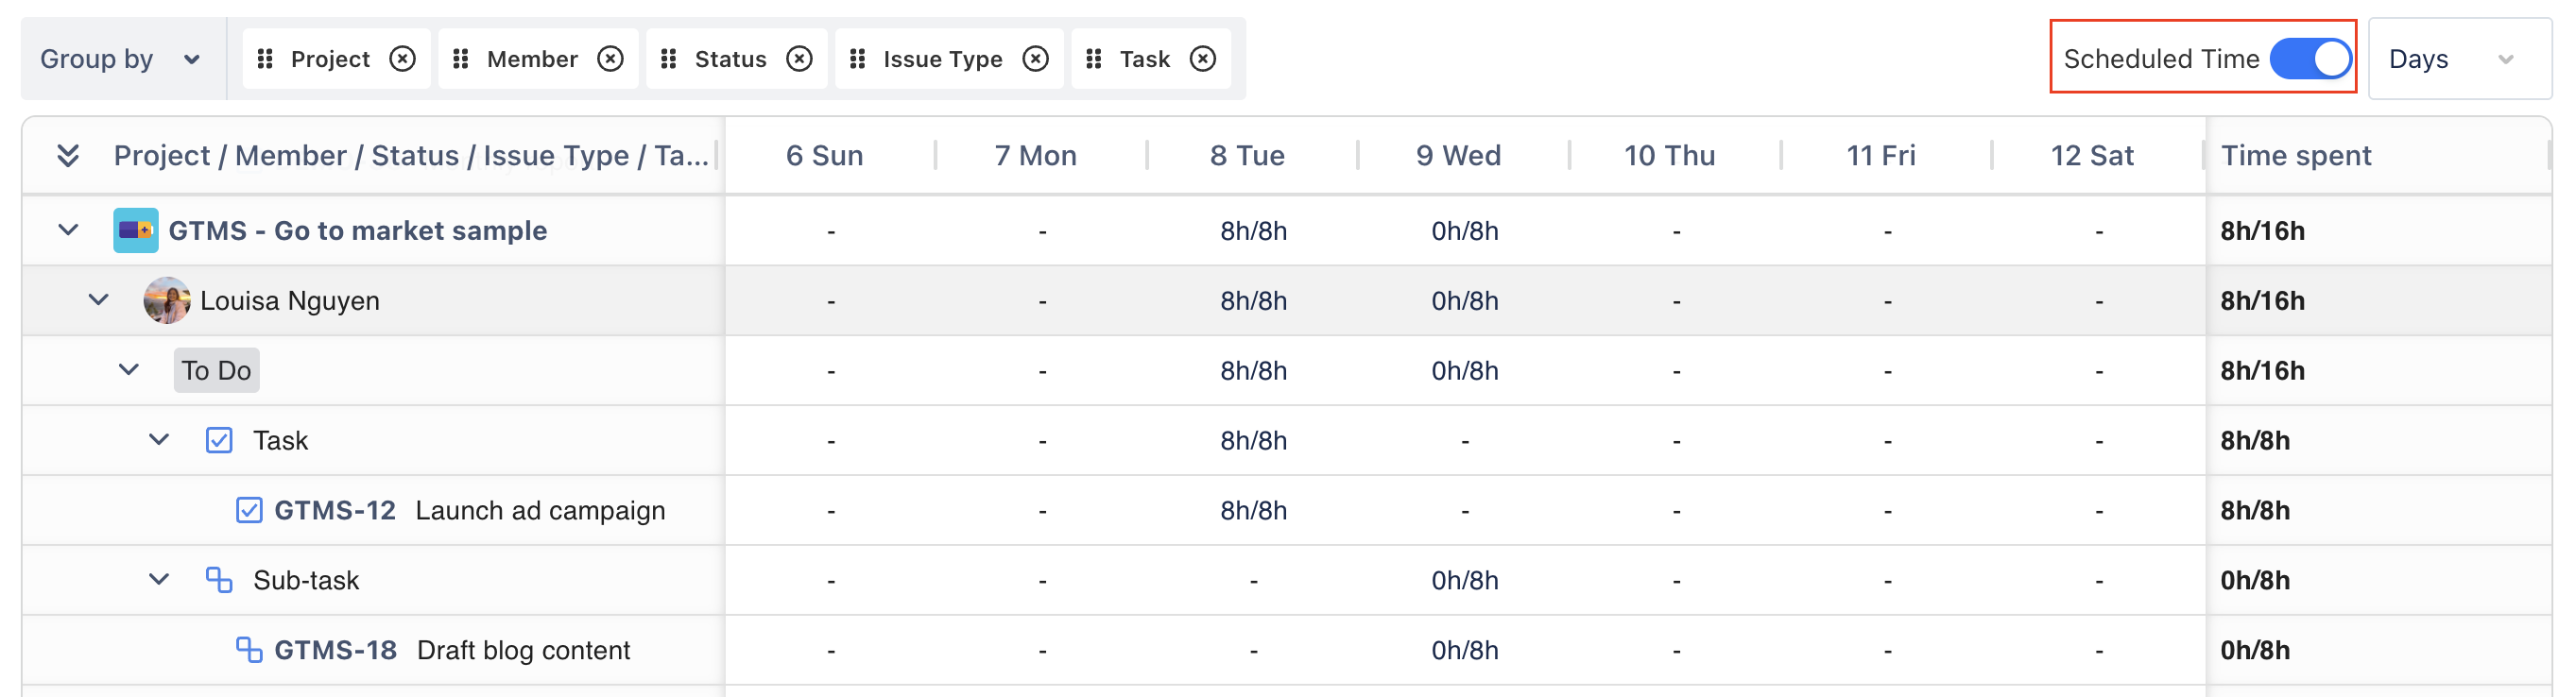
Hierarchy View
This view provides deeper insights into scheduled and logged time by allowing you to customize the report structure using the Group By feature with Jira and TeamBoard fields.
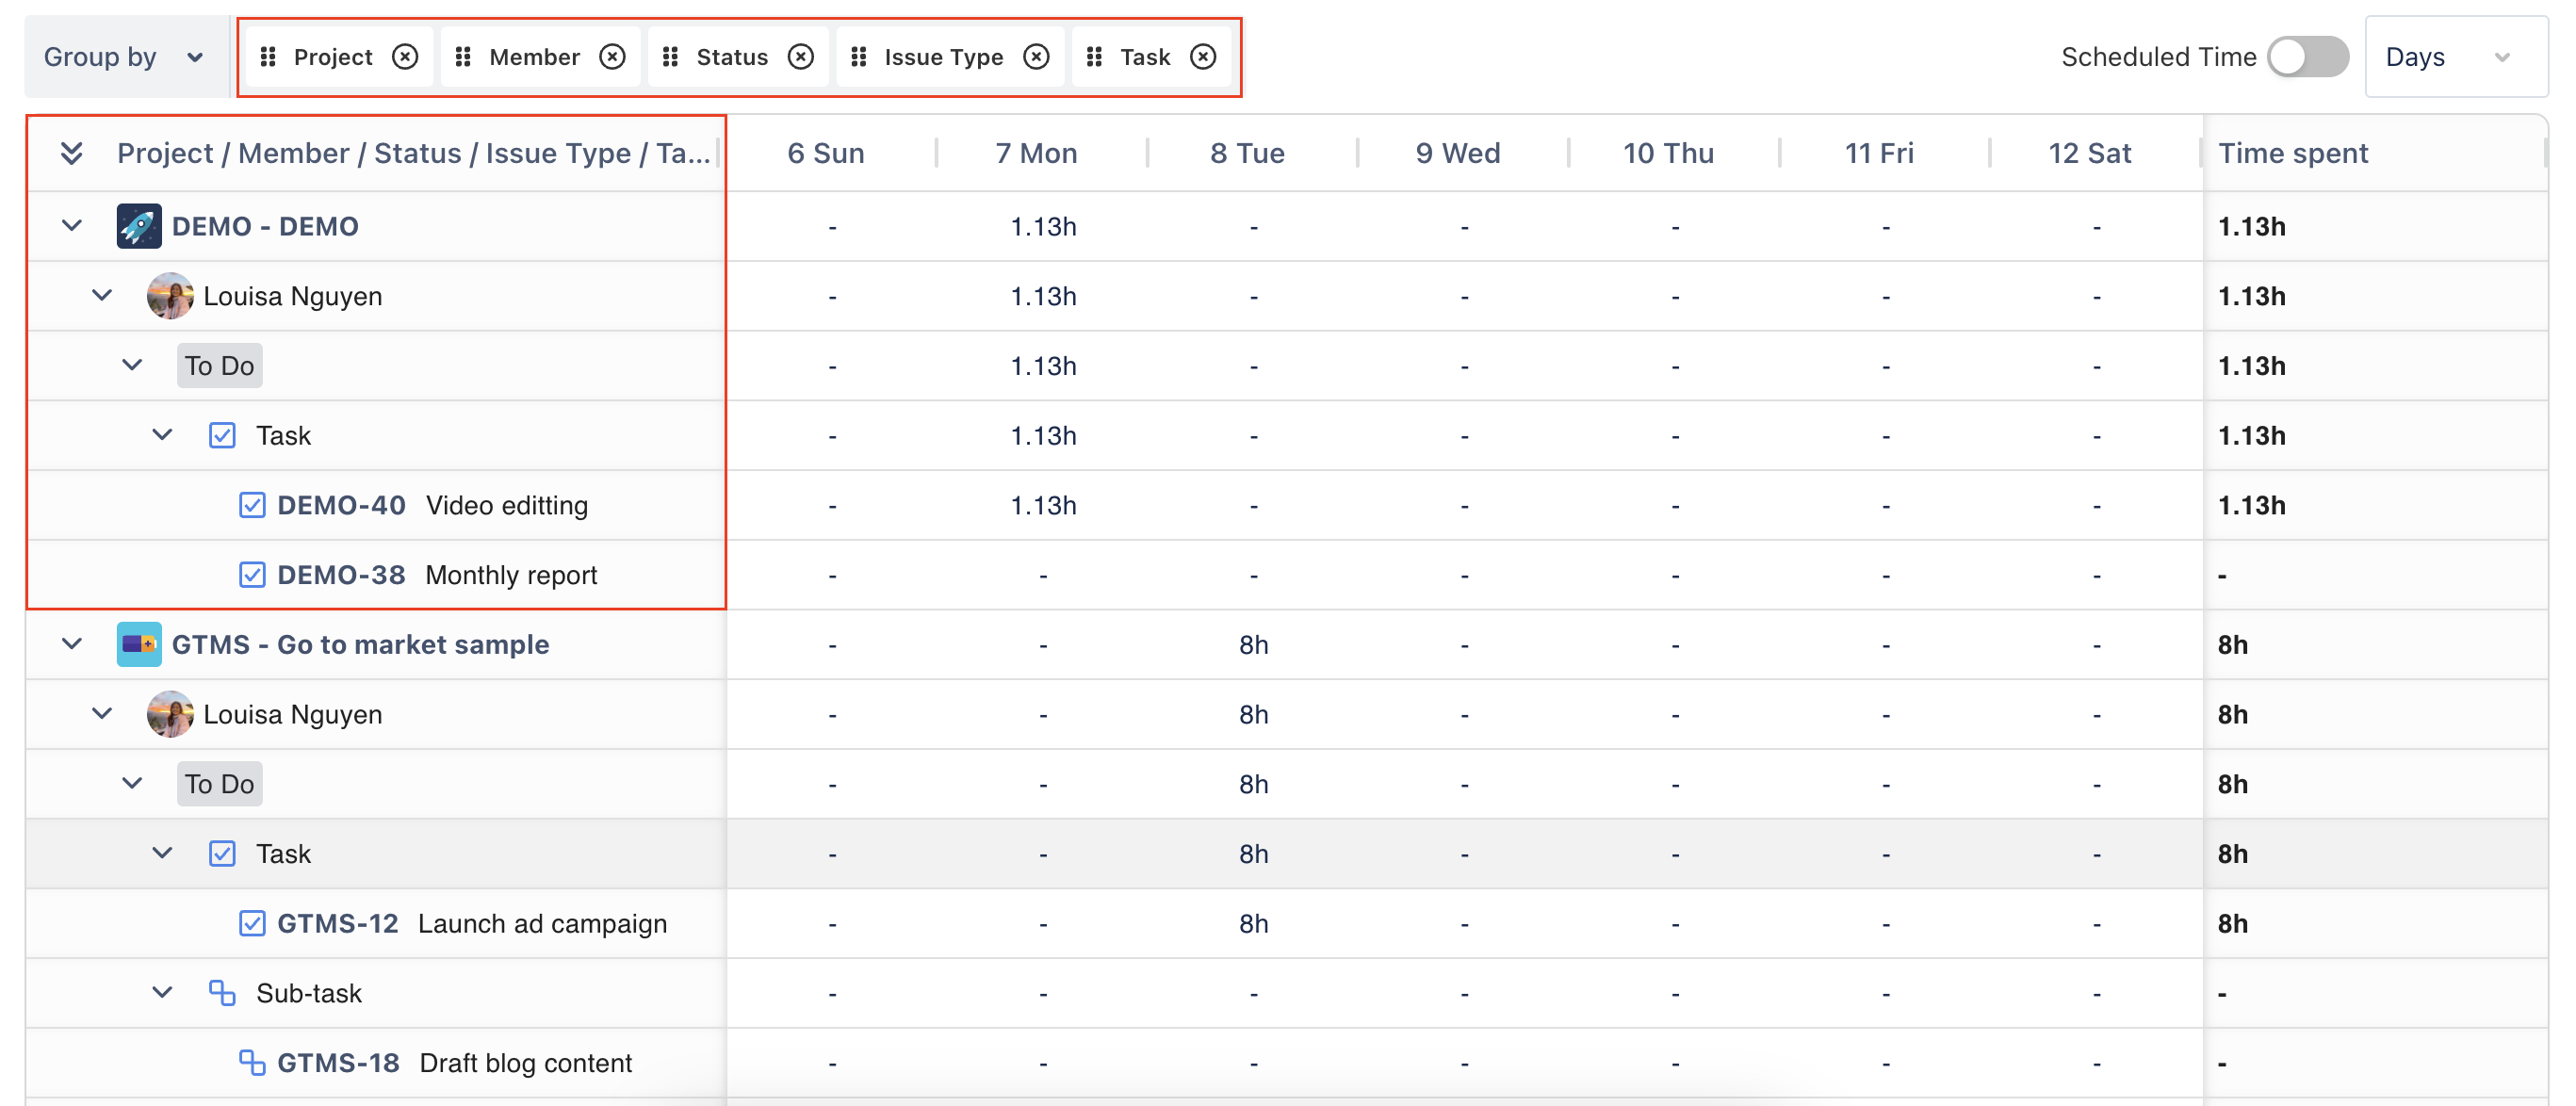
In the GENERAL REPORT, the hierarchy view displays time spent by default. To view scheduled hours, simply enable the "Scheduled Time" option. This allows you to compare logged time against scheduled time for better insight.
step 4 Save the Report
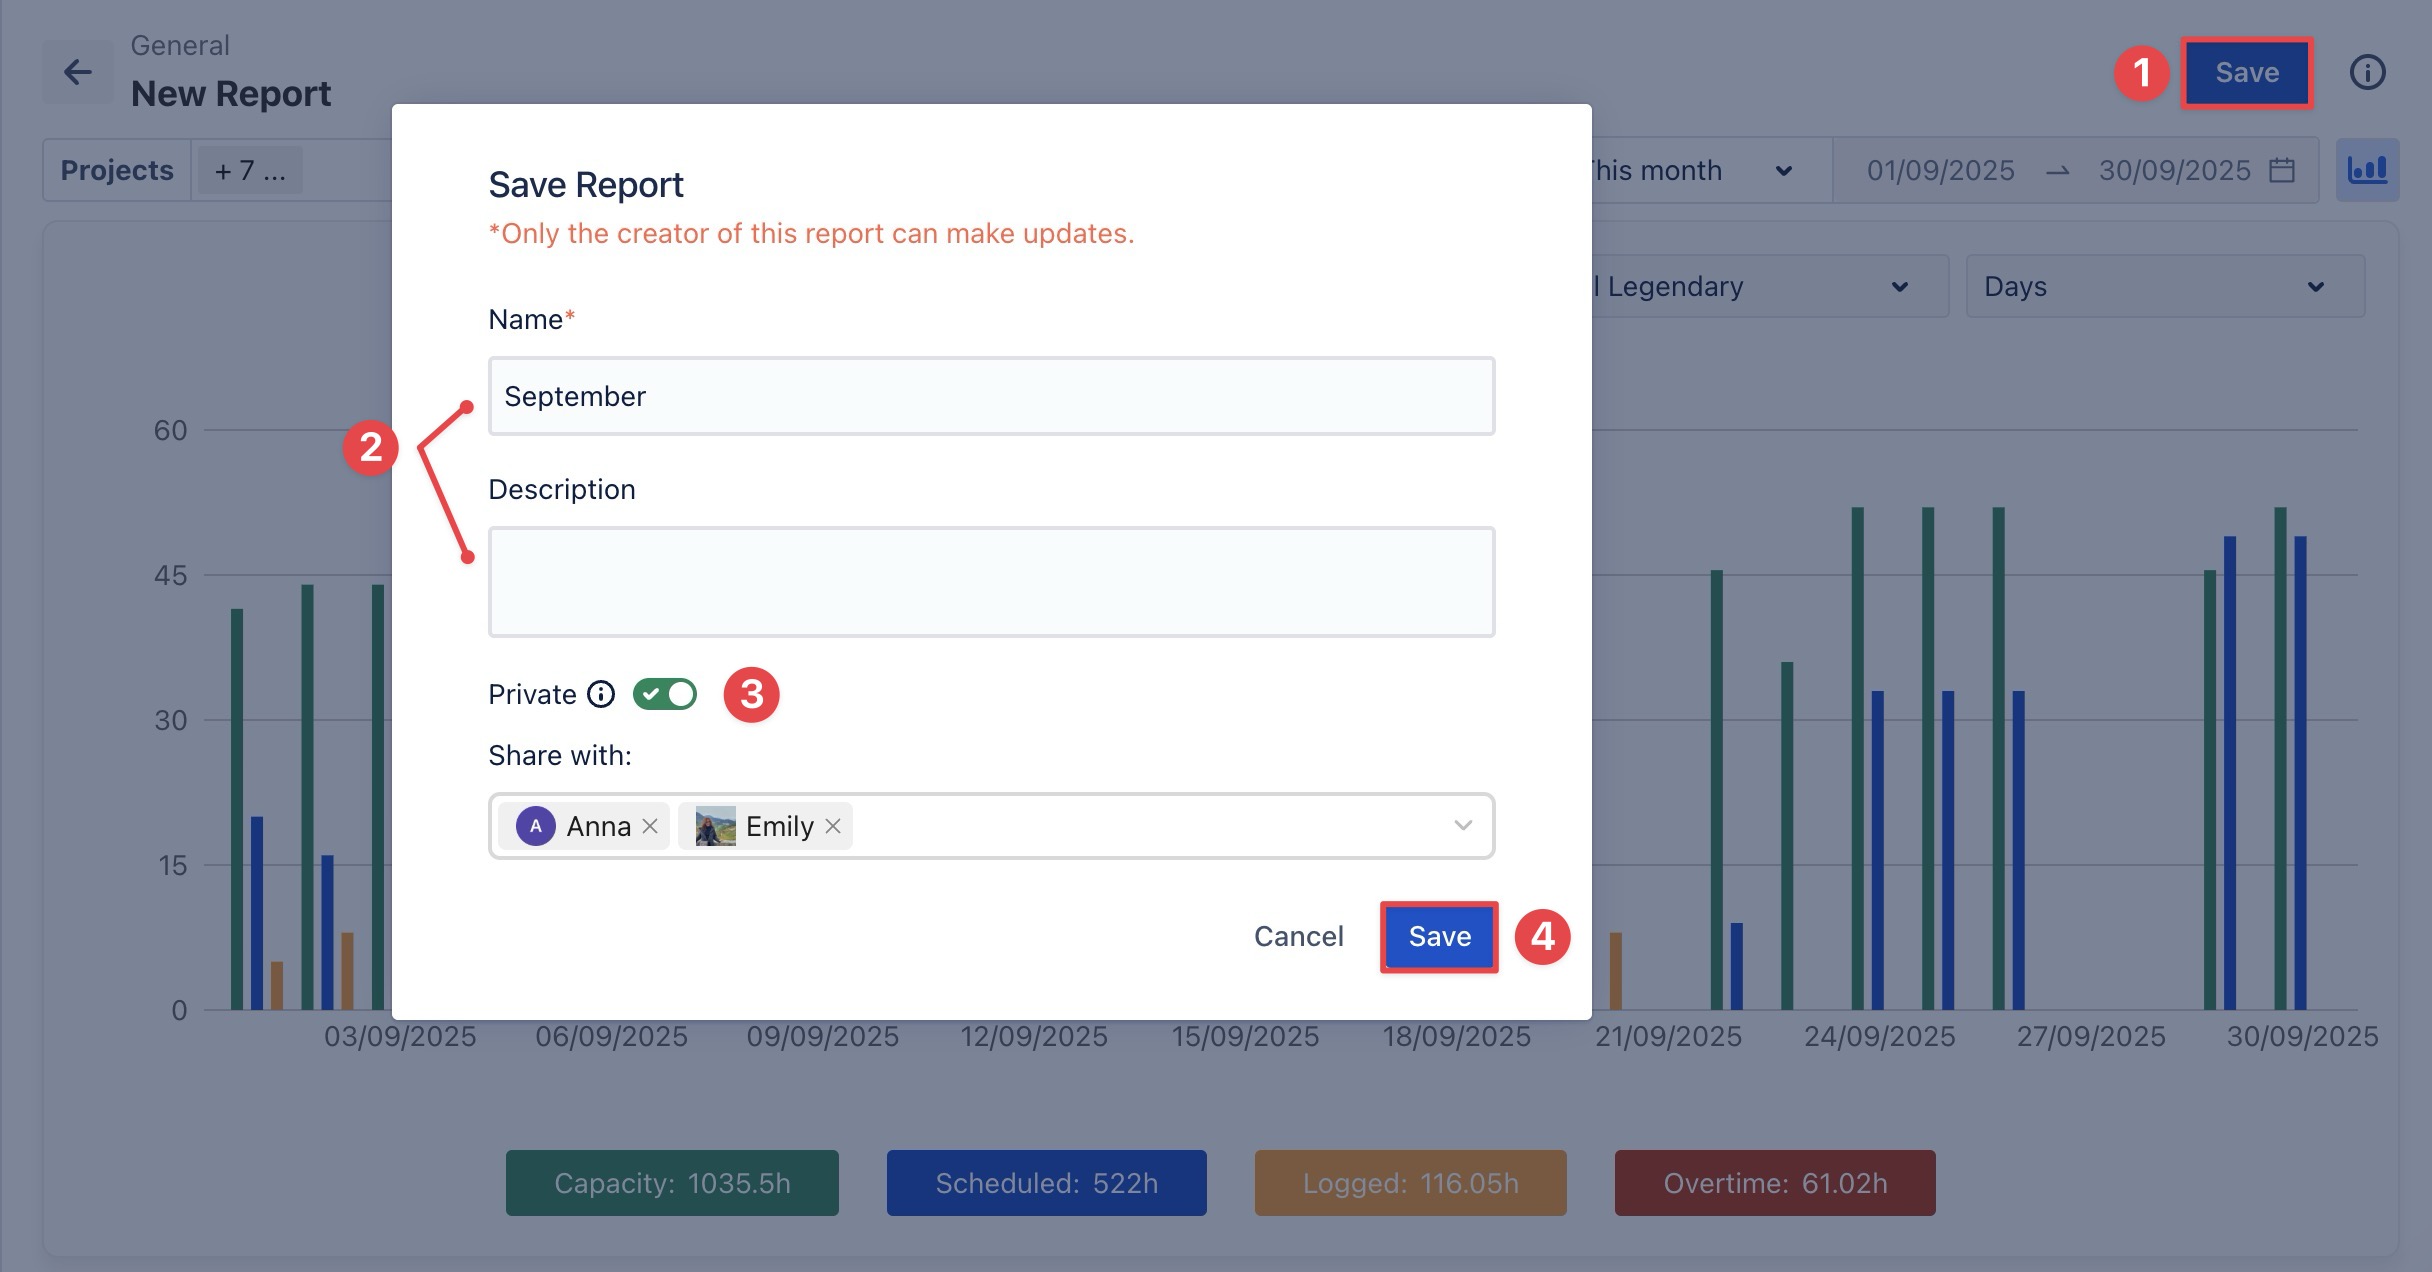
Once you have applied filters and customized the report, you can save it for future use.
-
Click the Save button in the top-right corner of the page.
-
In the Save Report pop-up:
-
Name: Enter a name for the report (required).
-
Description: Optionally, add details about the report’s purpose or content.
-
-
Choose the visibility setting:
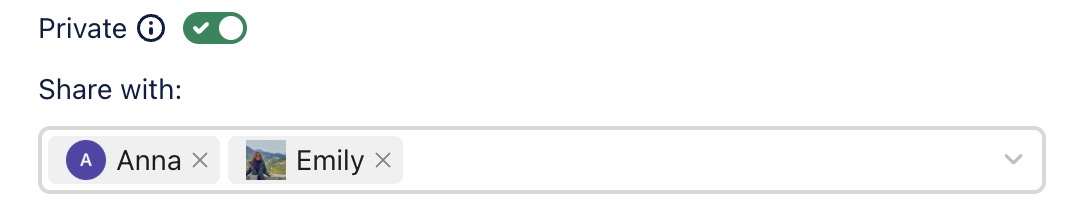
Private Report (toggle ON):
-
Only the members you share the report with can view it. However, only the report owner can edit or delete it.
-
Under Share with, select the members you want to give view-only access to.
-
Public Report (toggle OFF): The report is visible to all users in the workspace. Only the report owner can edit or delete it.

-
Click

Step 5: Export the Report
Reports can be exported for use outside TimePlanner:
-
Click the

-
The report will be downloaded as an Excel (.xlsx) file.