.png)
The Logged Time Report is designed to provide users with a clear overview of how logged time for tasks and events is allocated across team members and projects over a specific period. It enables users to visualize and manage total logged time in a detailed structure.
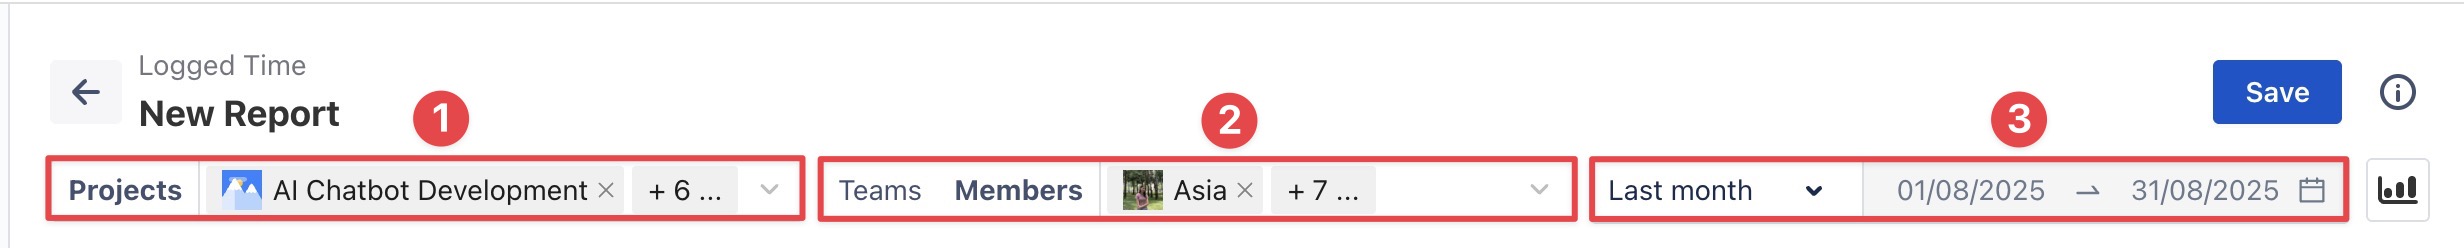
Step 1: Set Filters
Apply filters to define what data should be included in the report:
-
Projects: Select one or more projects to include in the report.
-
Members or Teams: Choose the individuals or teams whose data you want to analyze.
-
Time Range: Specify the reporting period. Two options are available:
-
Dynamic Range: Select a rolling date range, such as 'This Week' or 'Last 30 Days'. The report will update automatically as time progresses.
-
Fixed Range: Select a custom start and end date to lock the report to a specific period.
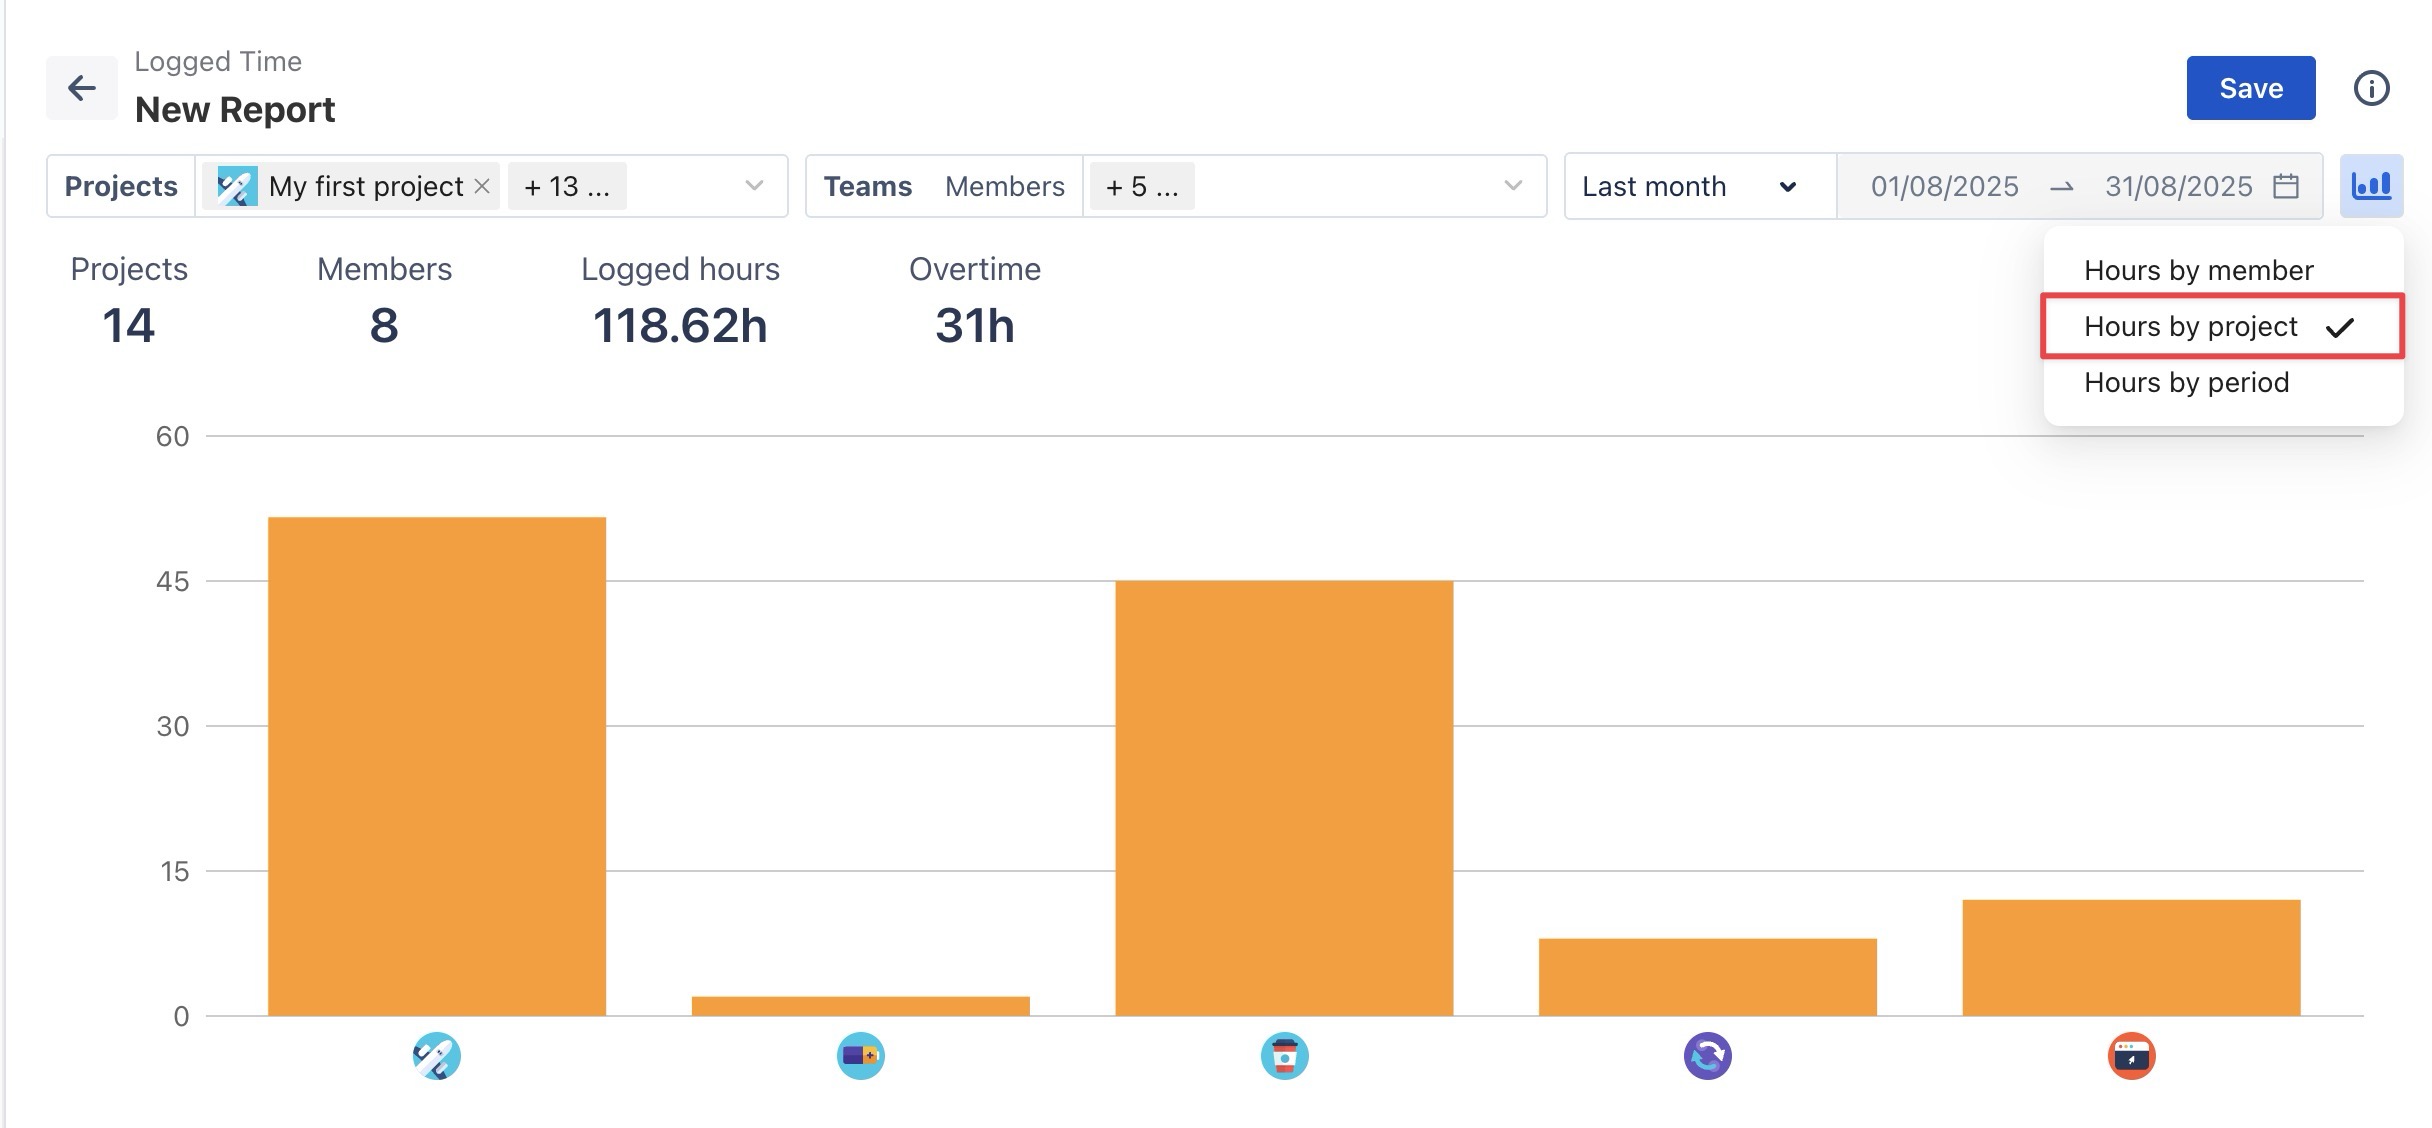
Step 2: Chart Customization Options
To display visual summaries, enable the 
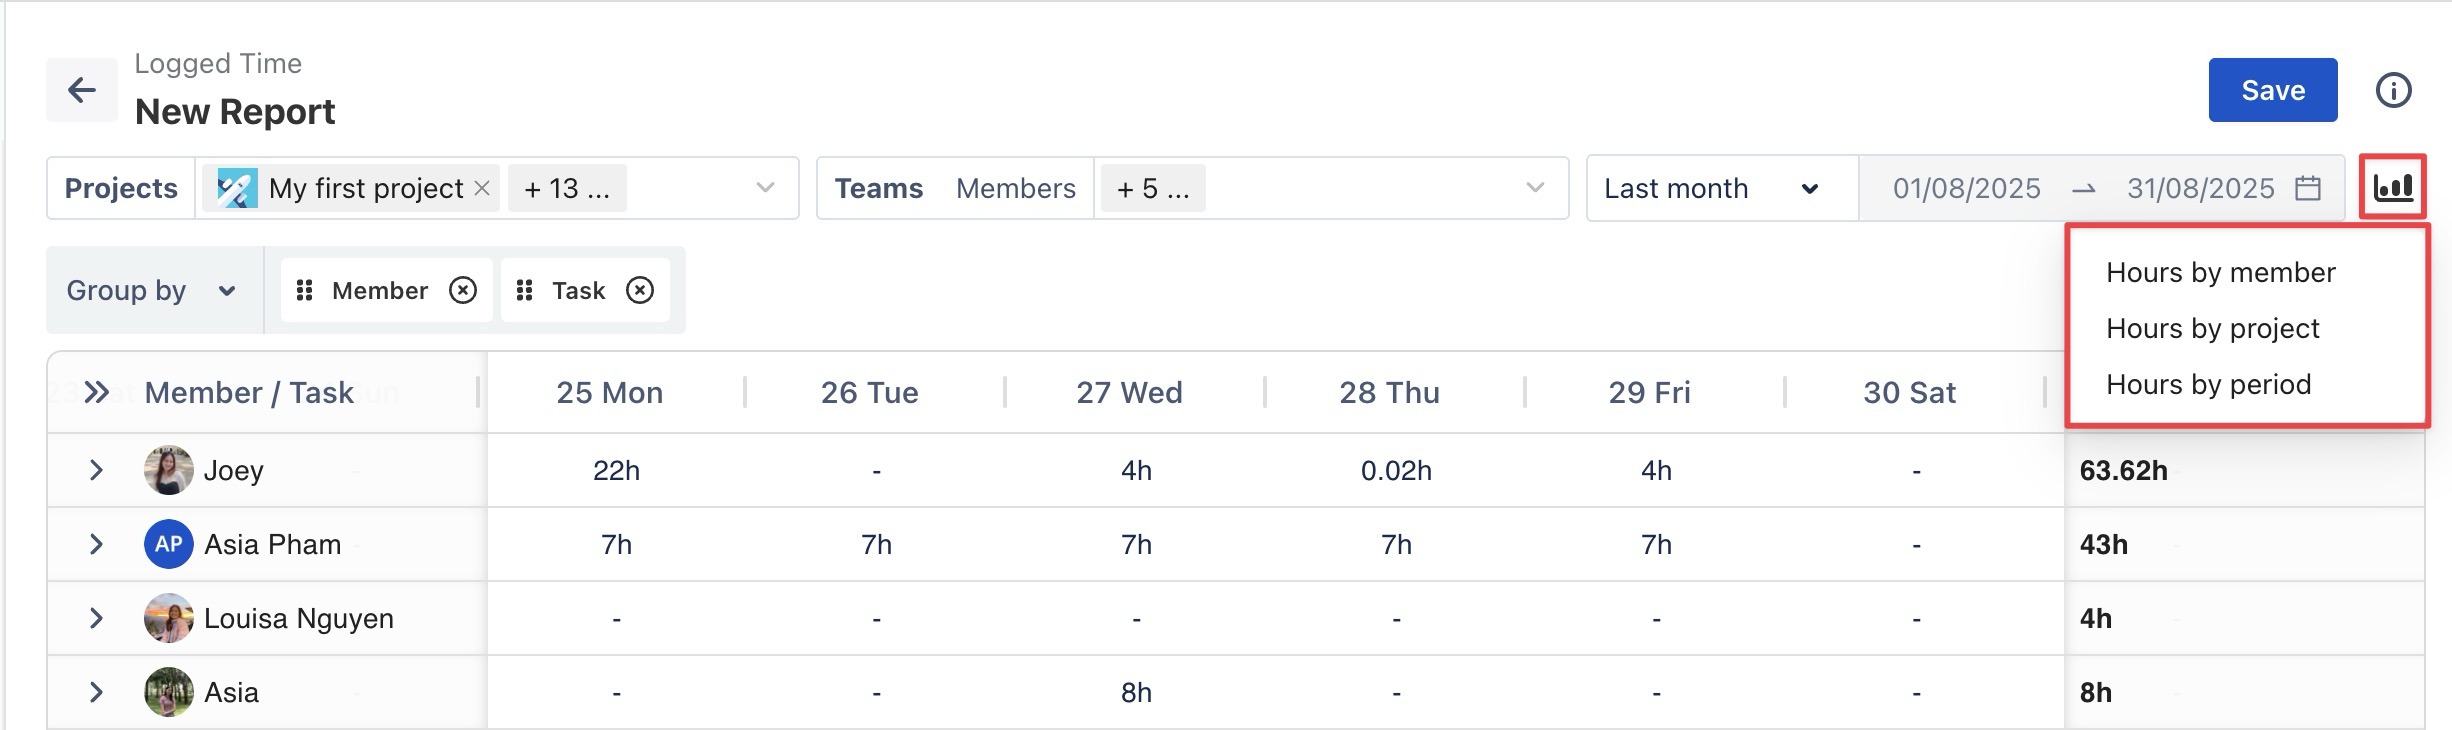
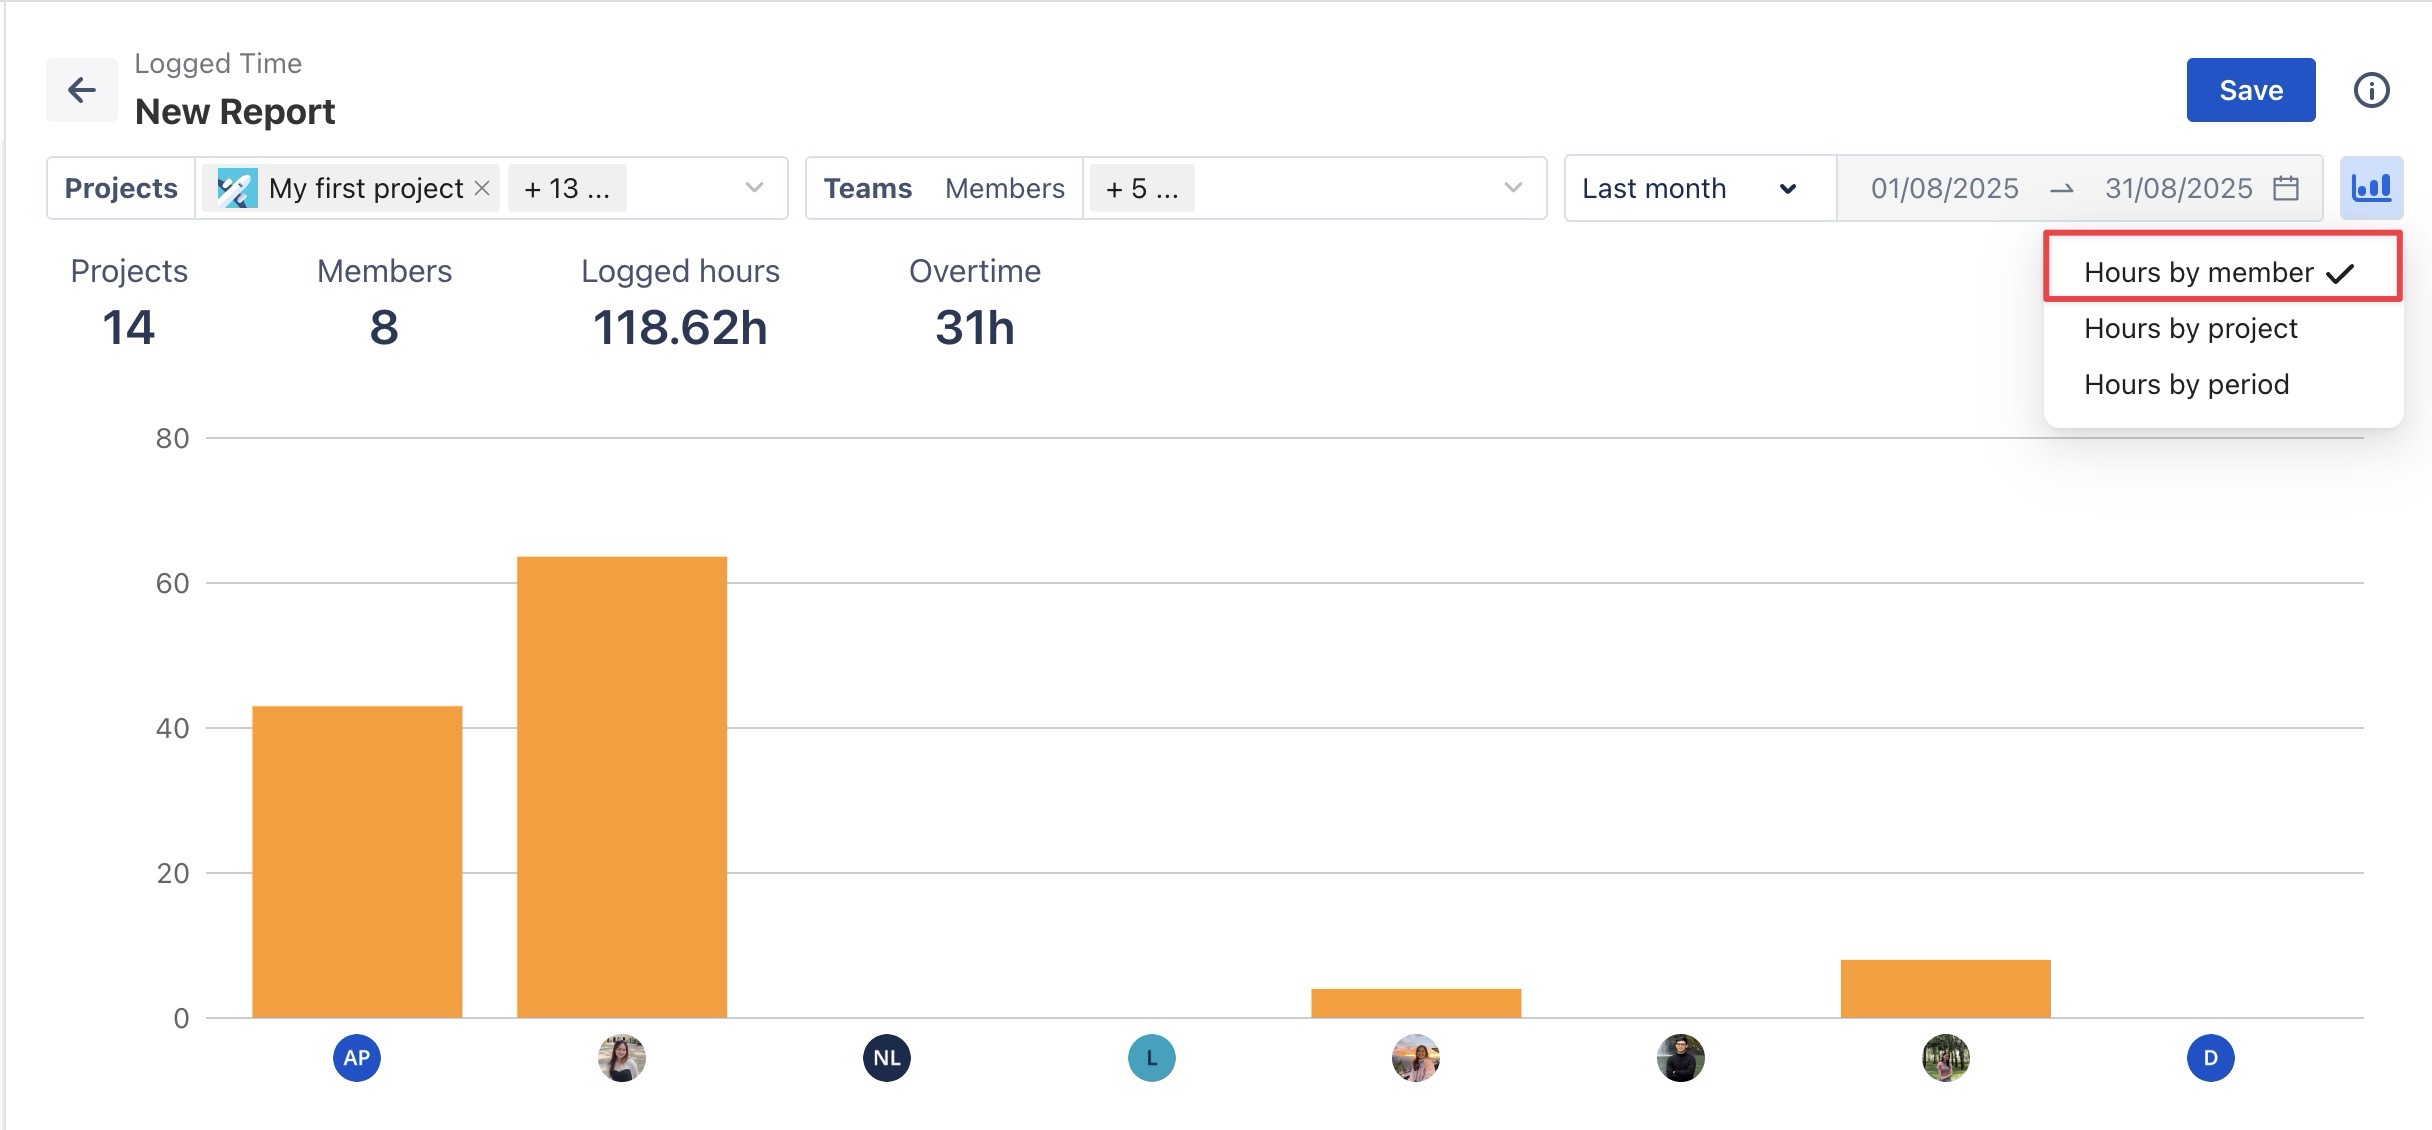
Hours by member
This chart displays the total logged hours for each team member, offering a quick view of individual time contributions
Hours by project
This chart showcases the logged hours allocated to each project, offering insights into how members distributed time across different projects.
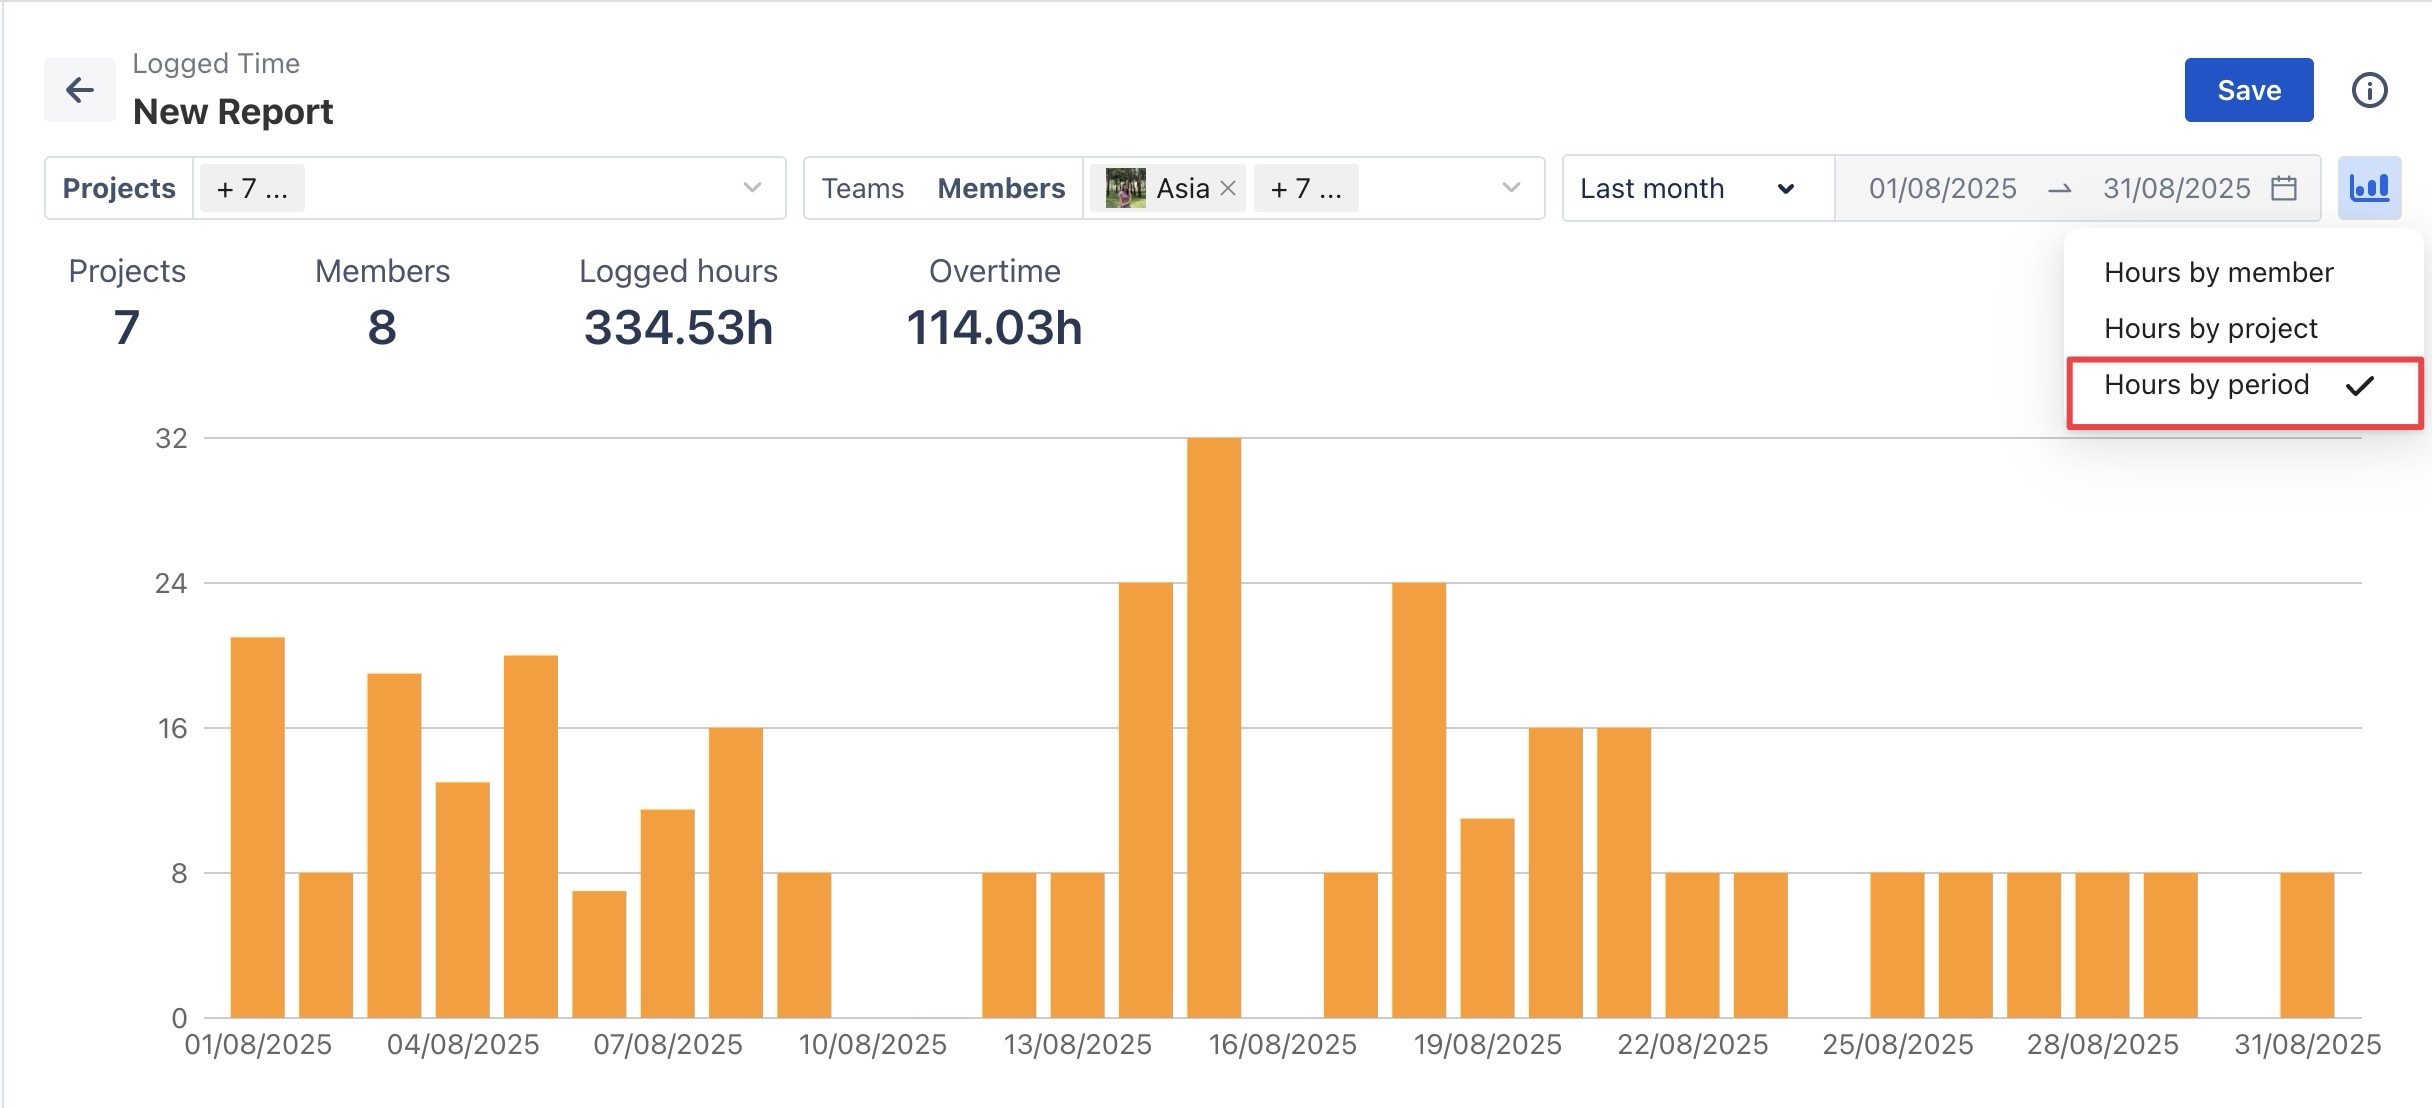
Hours by period
This chart presents logged hours over a selected time period, enabling users to track time usage trends and ensure balanced time allocation across days.
Step 3 Customize Fields
You can customize fields by selecting ![]()
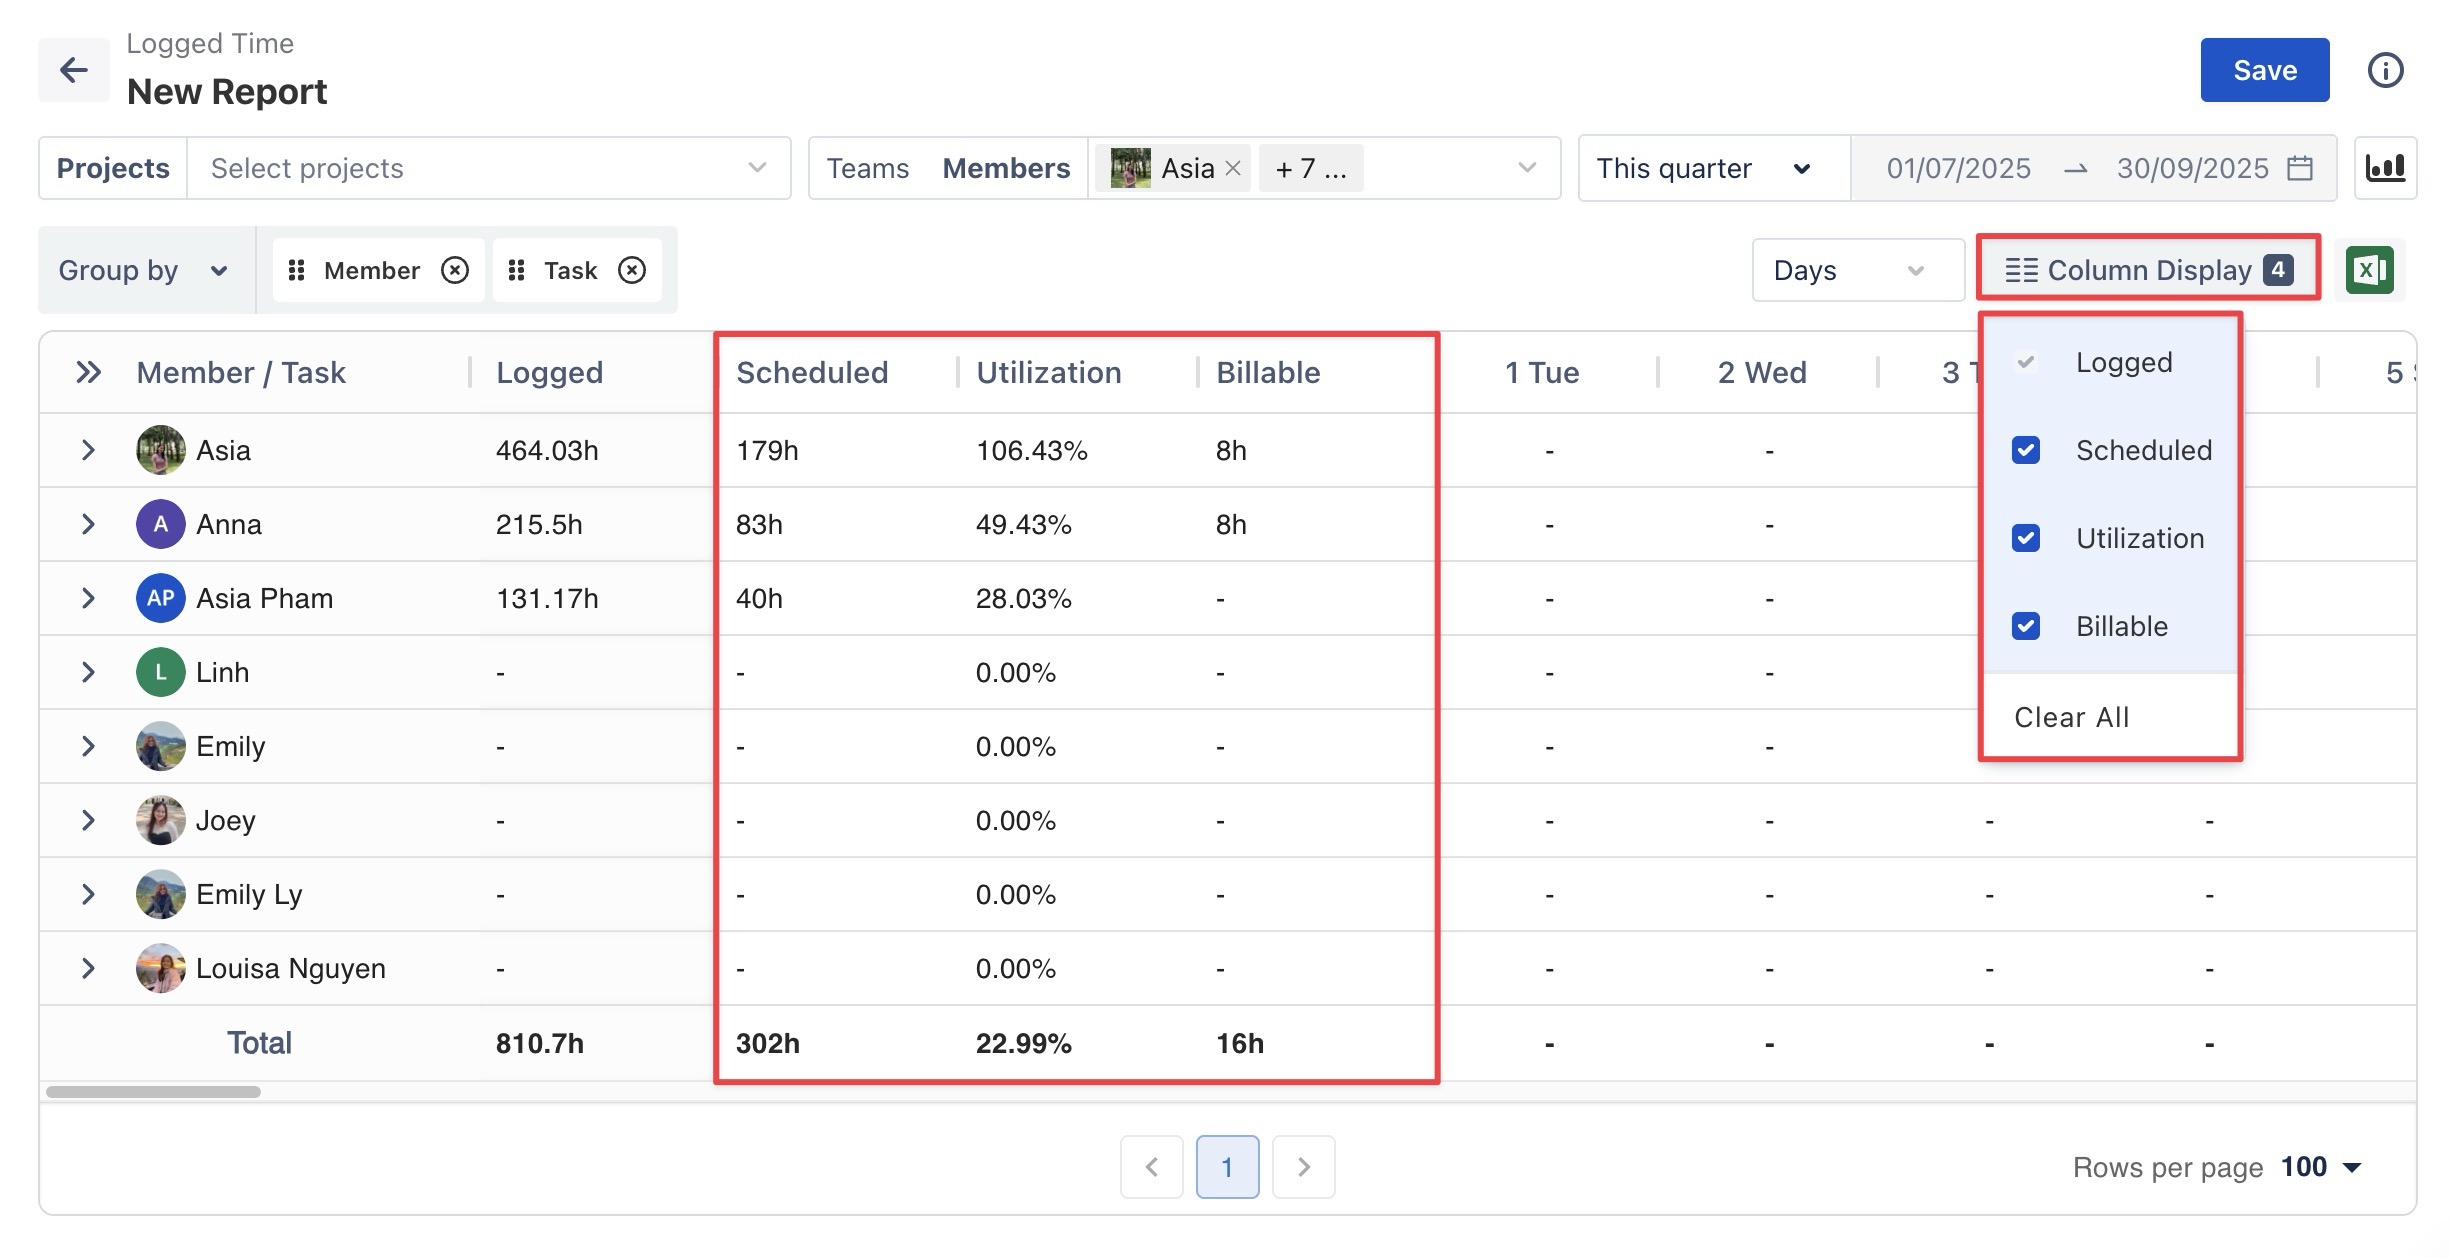
-
Scheduled: Shows the planned time allocated for tasks or activities within the selected period.
-
Utilization: Displays the percentage of Logged Time divided by Capacity.
-
Billable: Helps you track tasks that are billable versus non-billable.
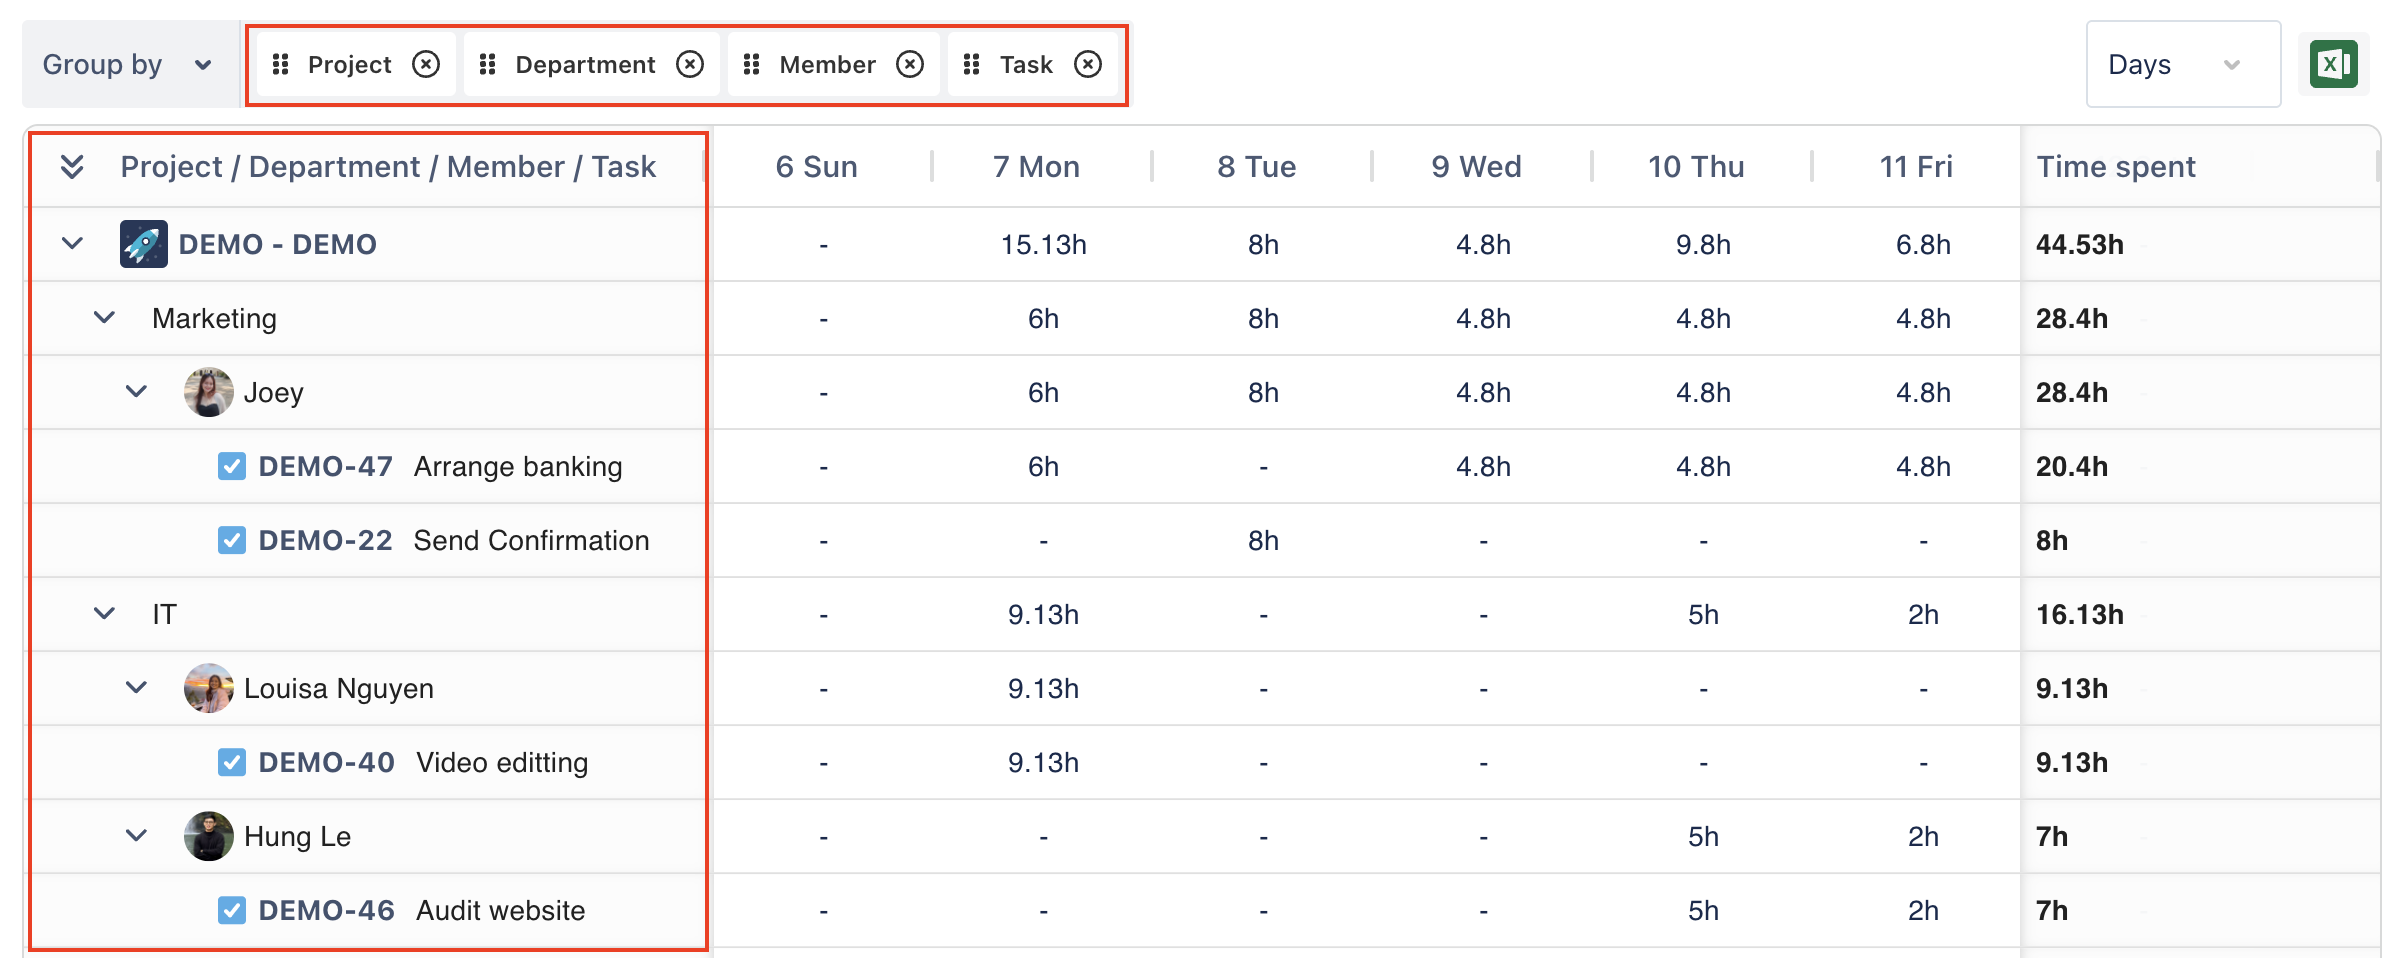
Step 4 Grouping Fields
The Hierarchy Report allows you to customize your report structure using the Group By feature, giving you a clear overview and detailed insights into logged time across each category.
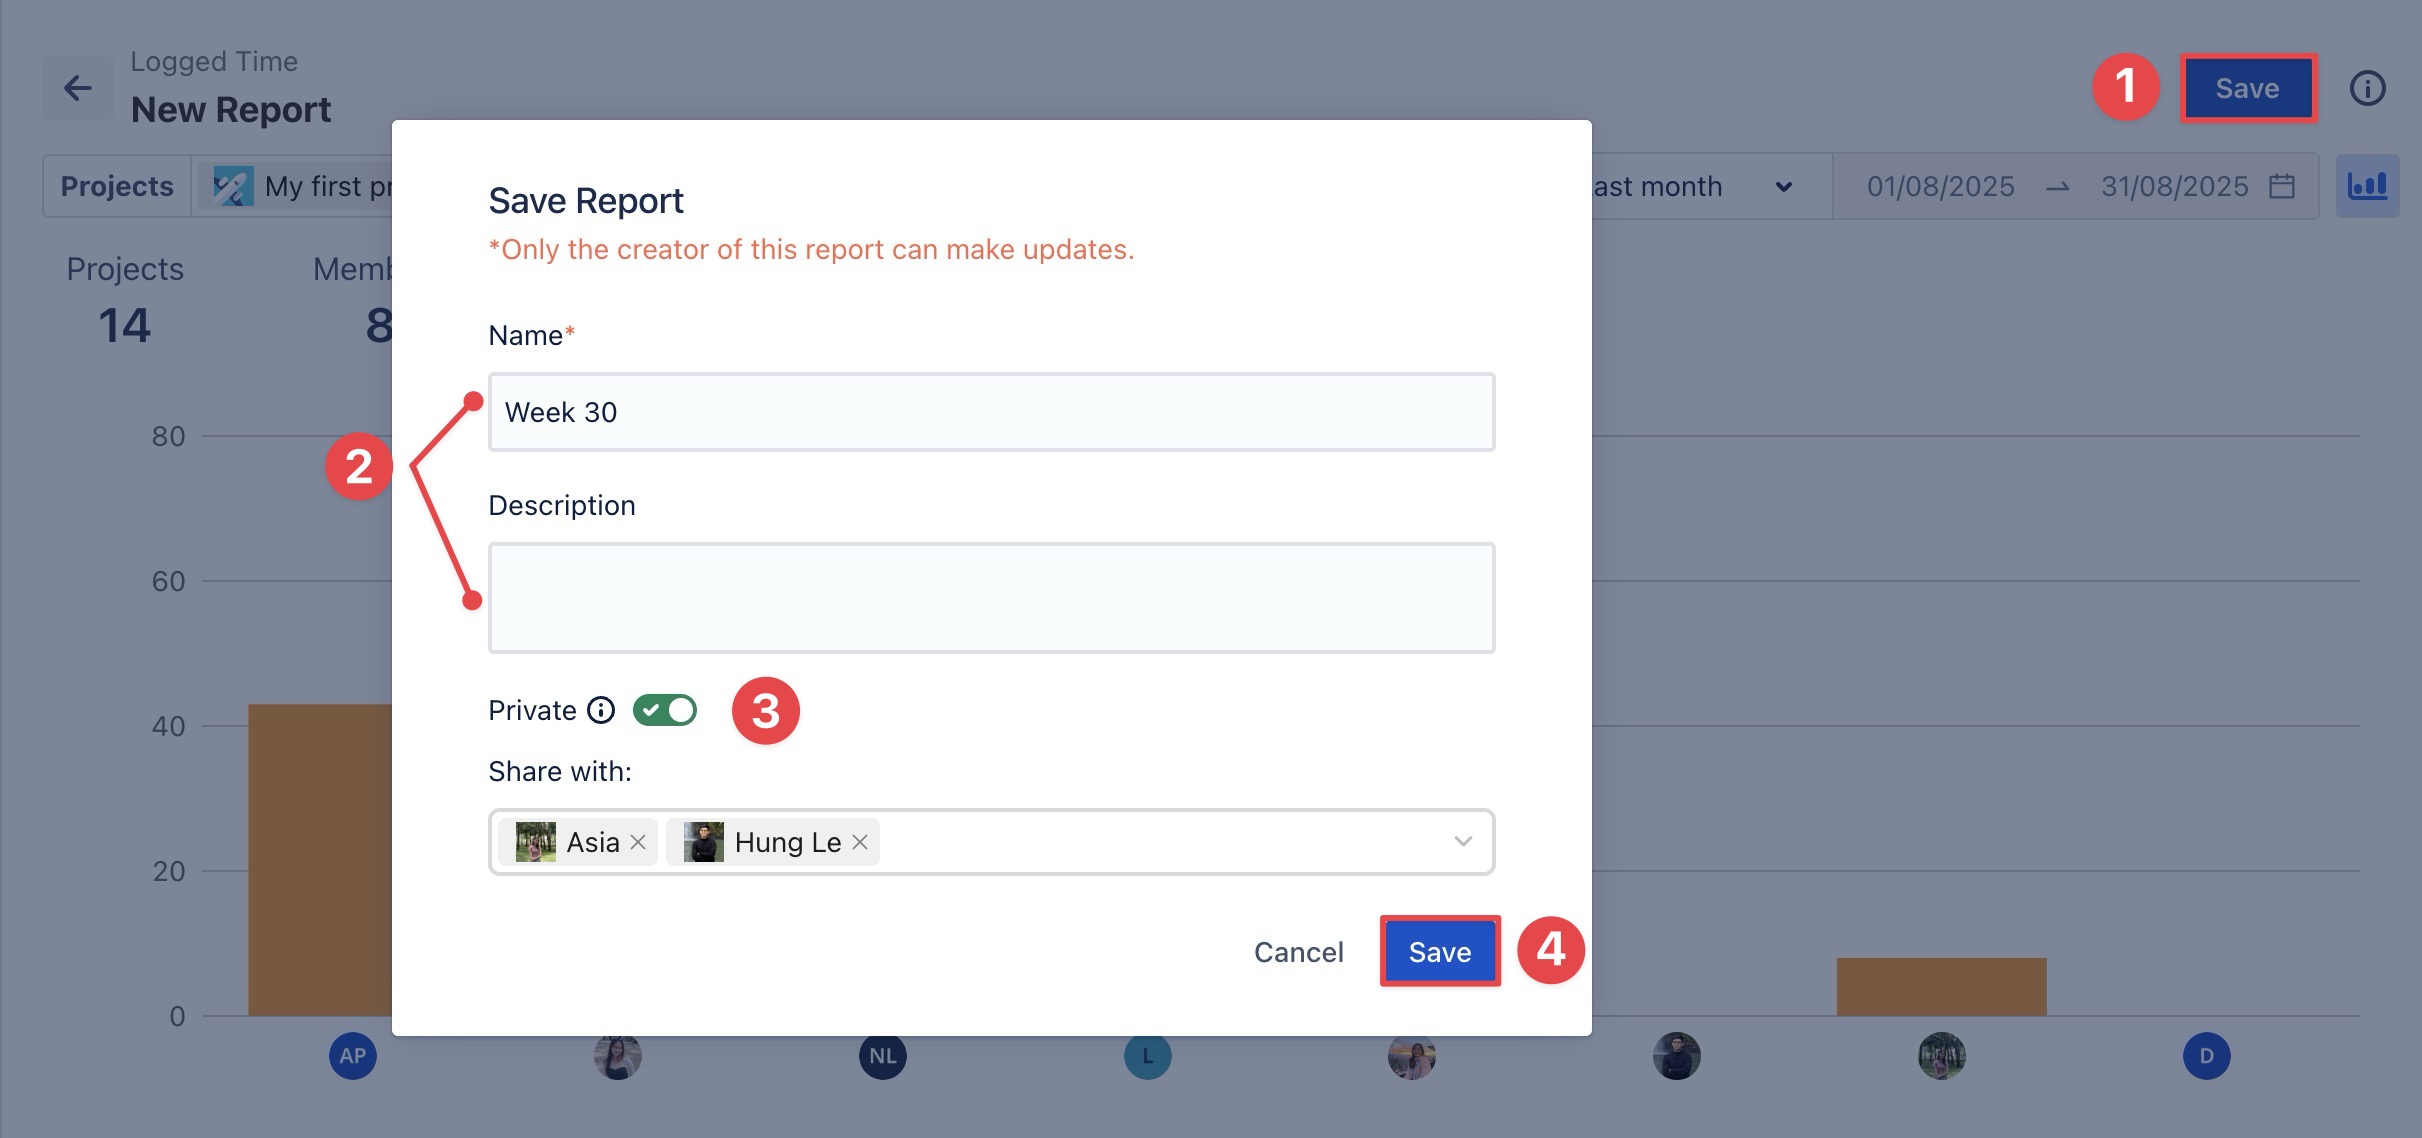
step 5 Save the Report
Once you have applied filters and customized the report, you can save it for future use.
-
Click the Save button in the top-right corner of the page.
-
In the Save Report pop-up:
-
Name: Enter a name for the report (required).
-
Description: Optionally, add details about the report’s purpose or content.
-
-
Choose the visibility setting:
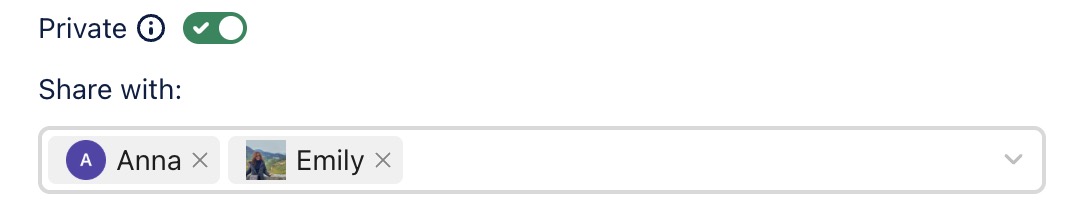
Private Report (toggle ON):
-
Only the members you share the report with can view it. However, only the report owner can edit or delete it.
-
Under Share with, select the members you want to give view-only access to.
-
Public Report (toggle OFF): The report is visible to all users in the workspace. Only the report owner can edit or delete it.

-
Click

Step 6 Export the Report
Reports can be exported for use outside TimePlanner: Click the 
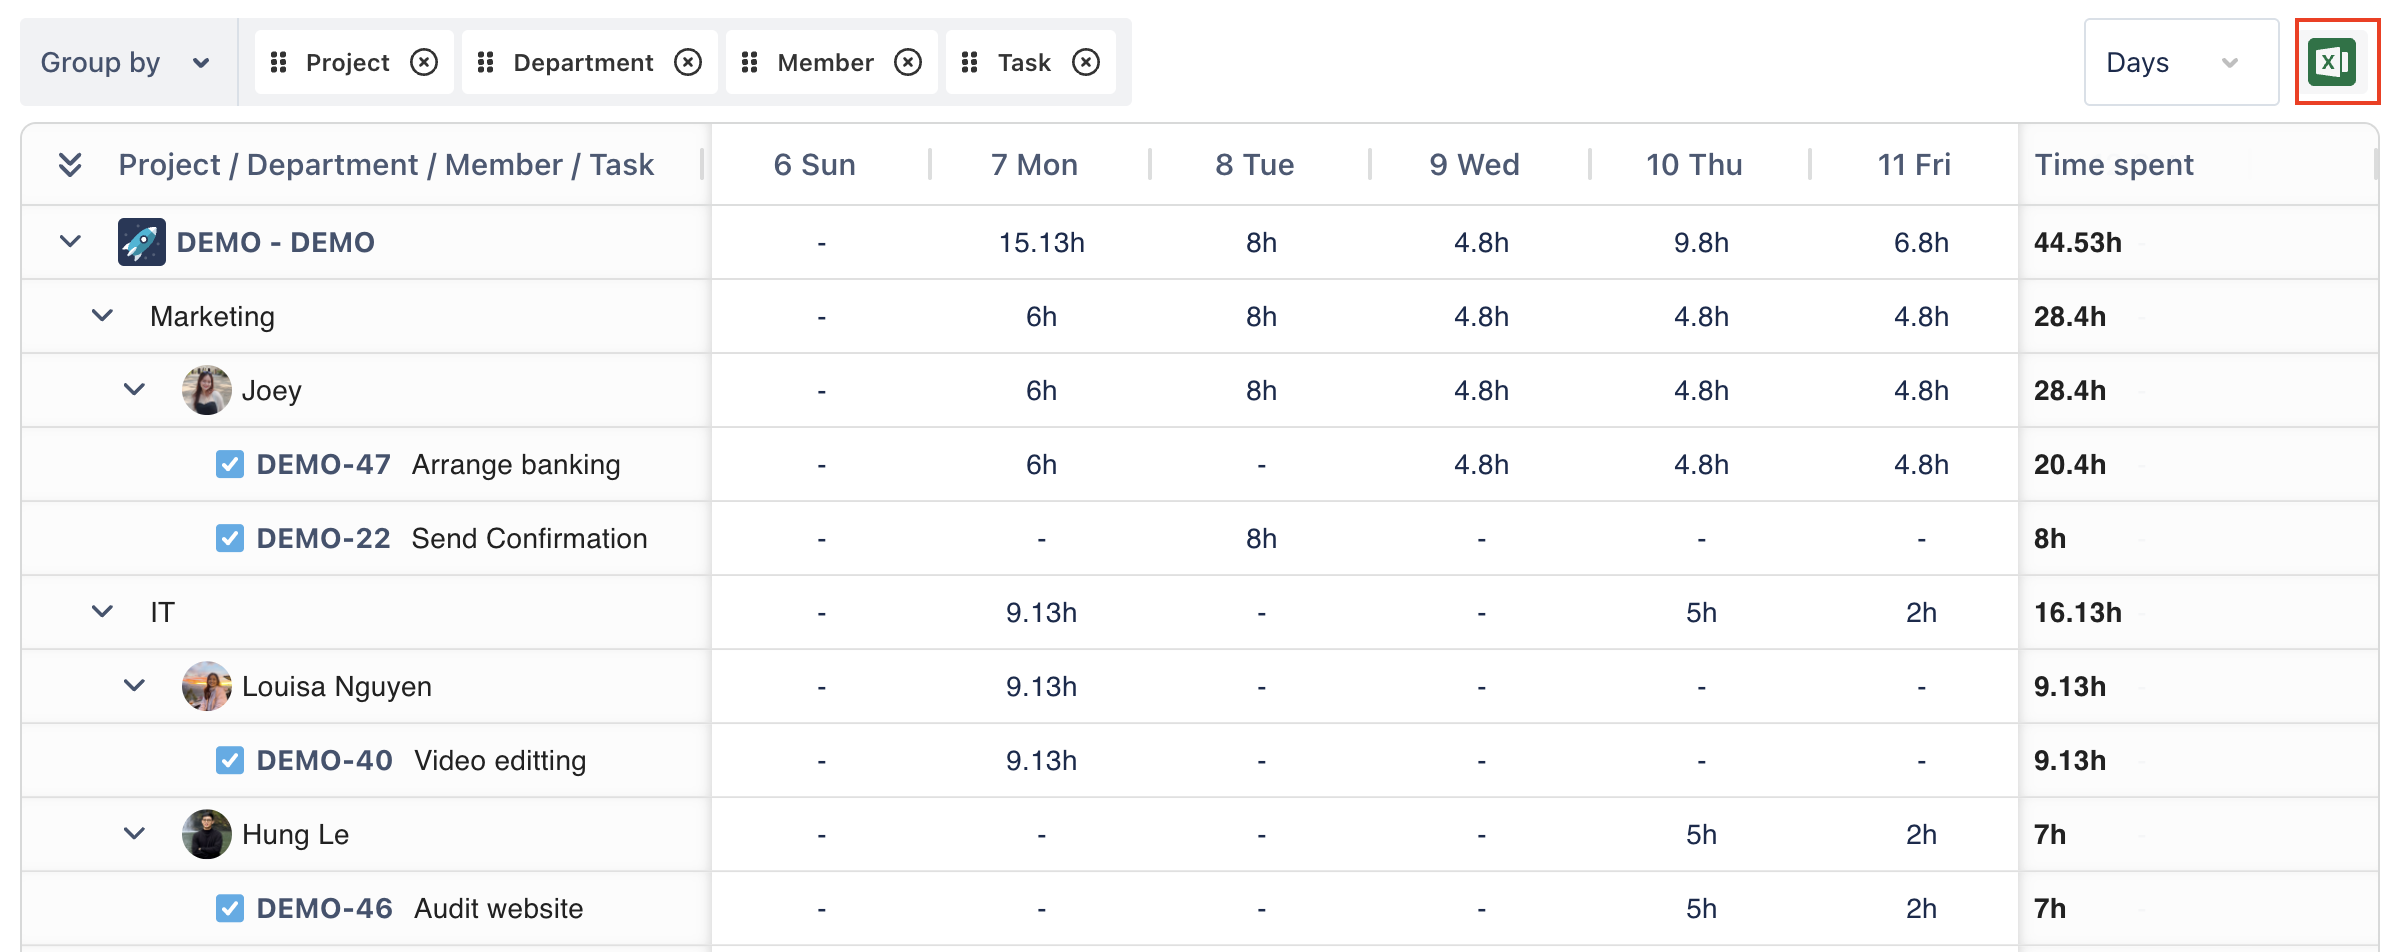
→ The report will be downloaded as an Excel (.xlsx) file.