.png)
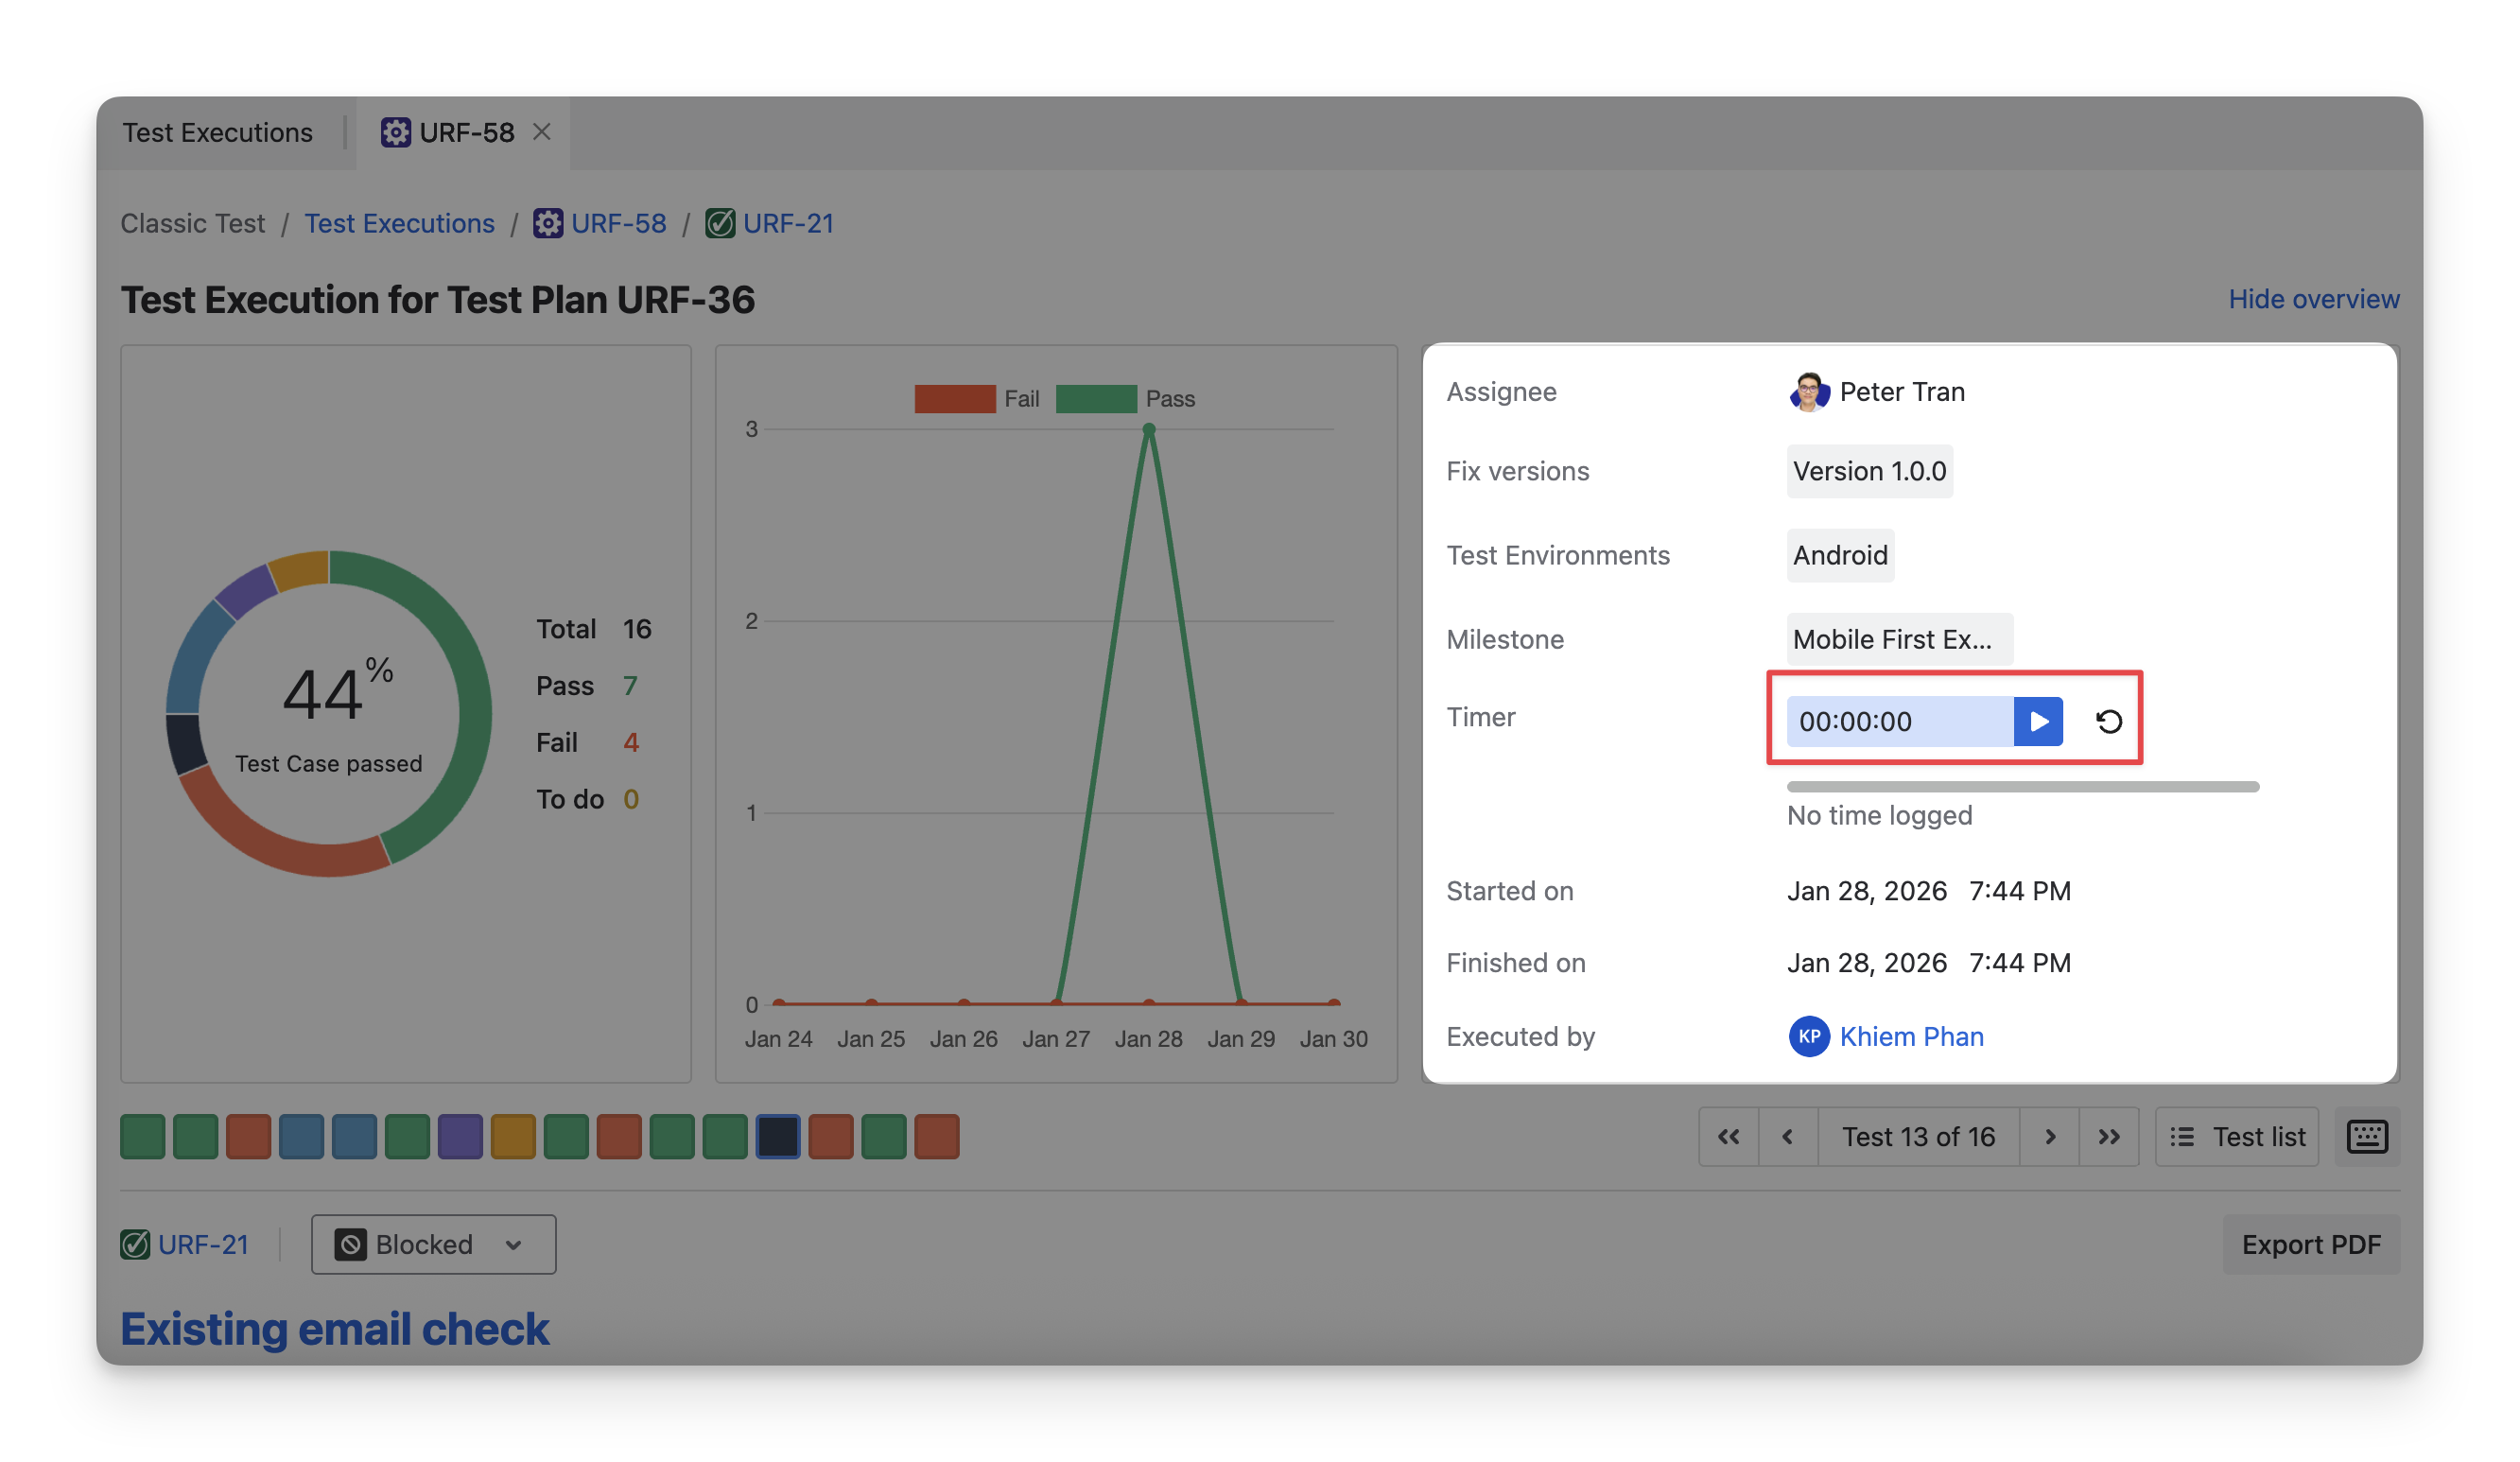
At the top of the Execute Screen, you can locate the Test Execution Results section.
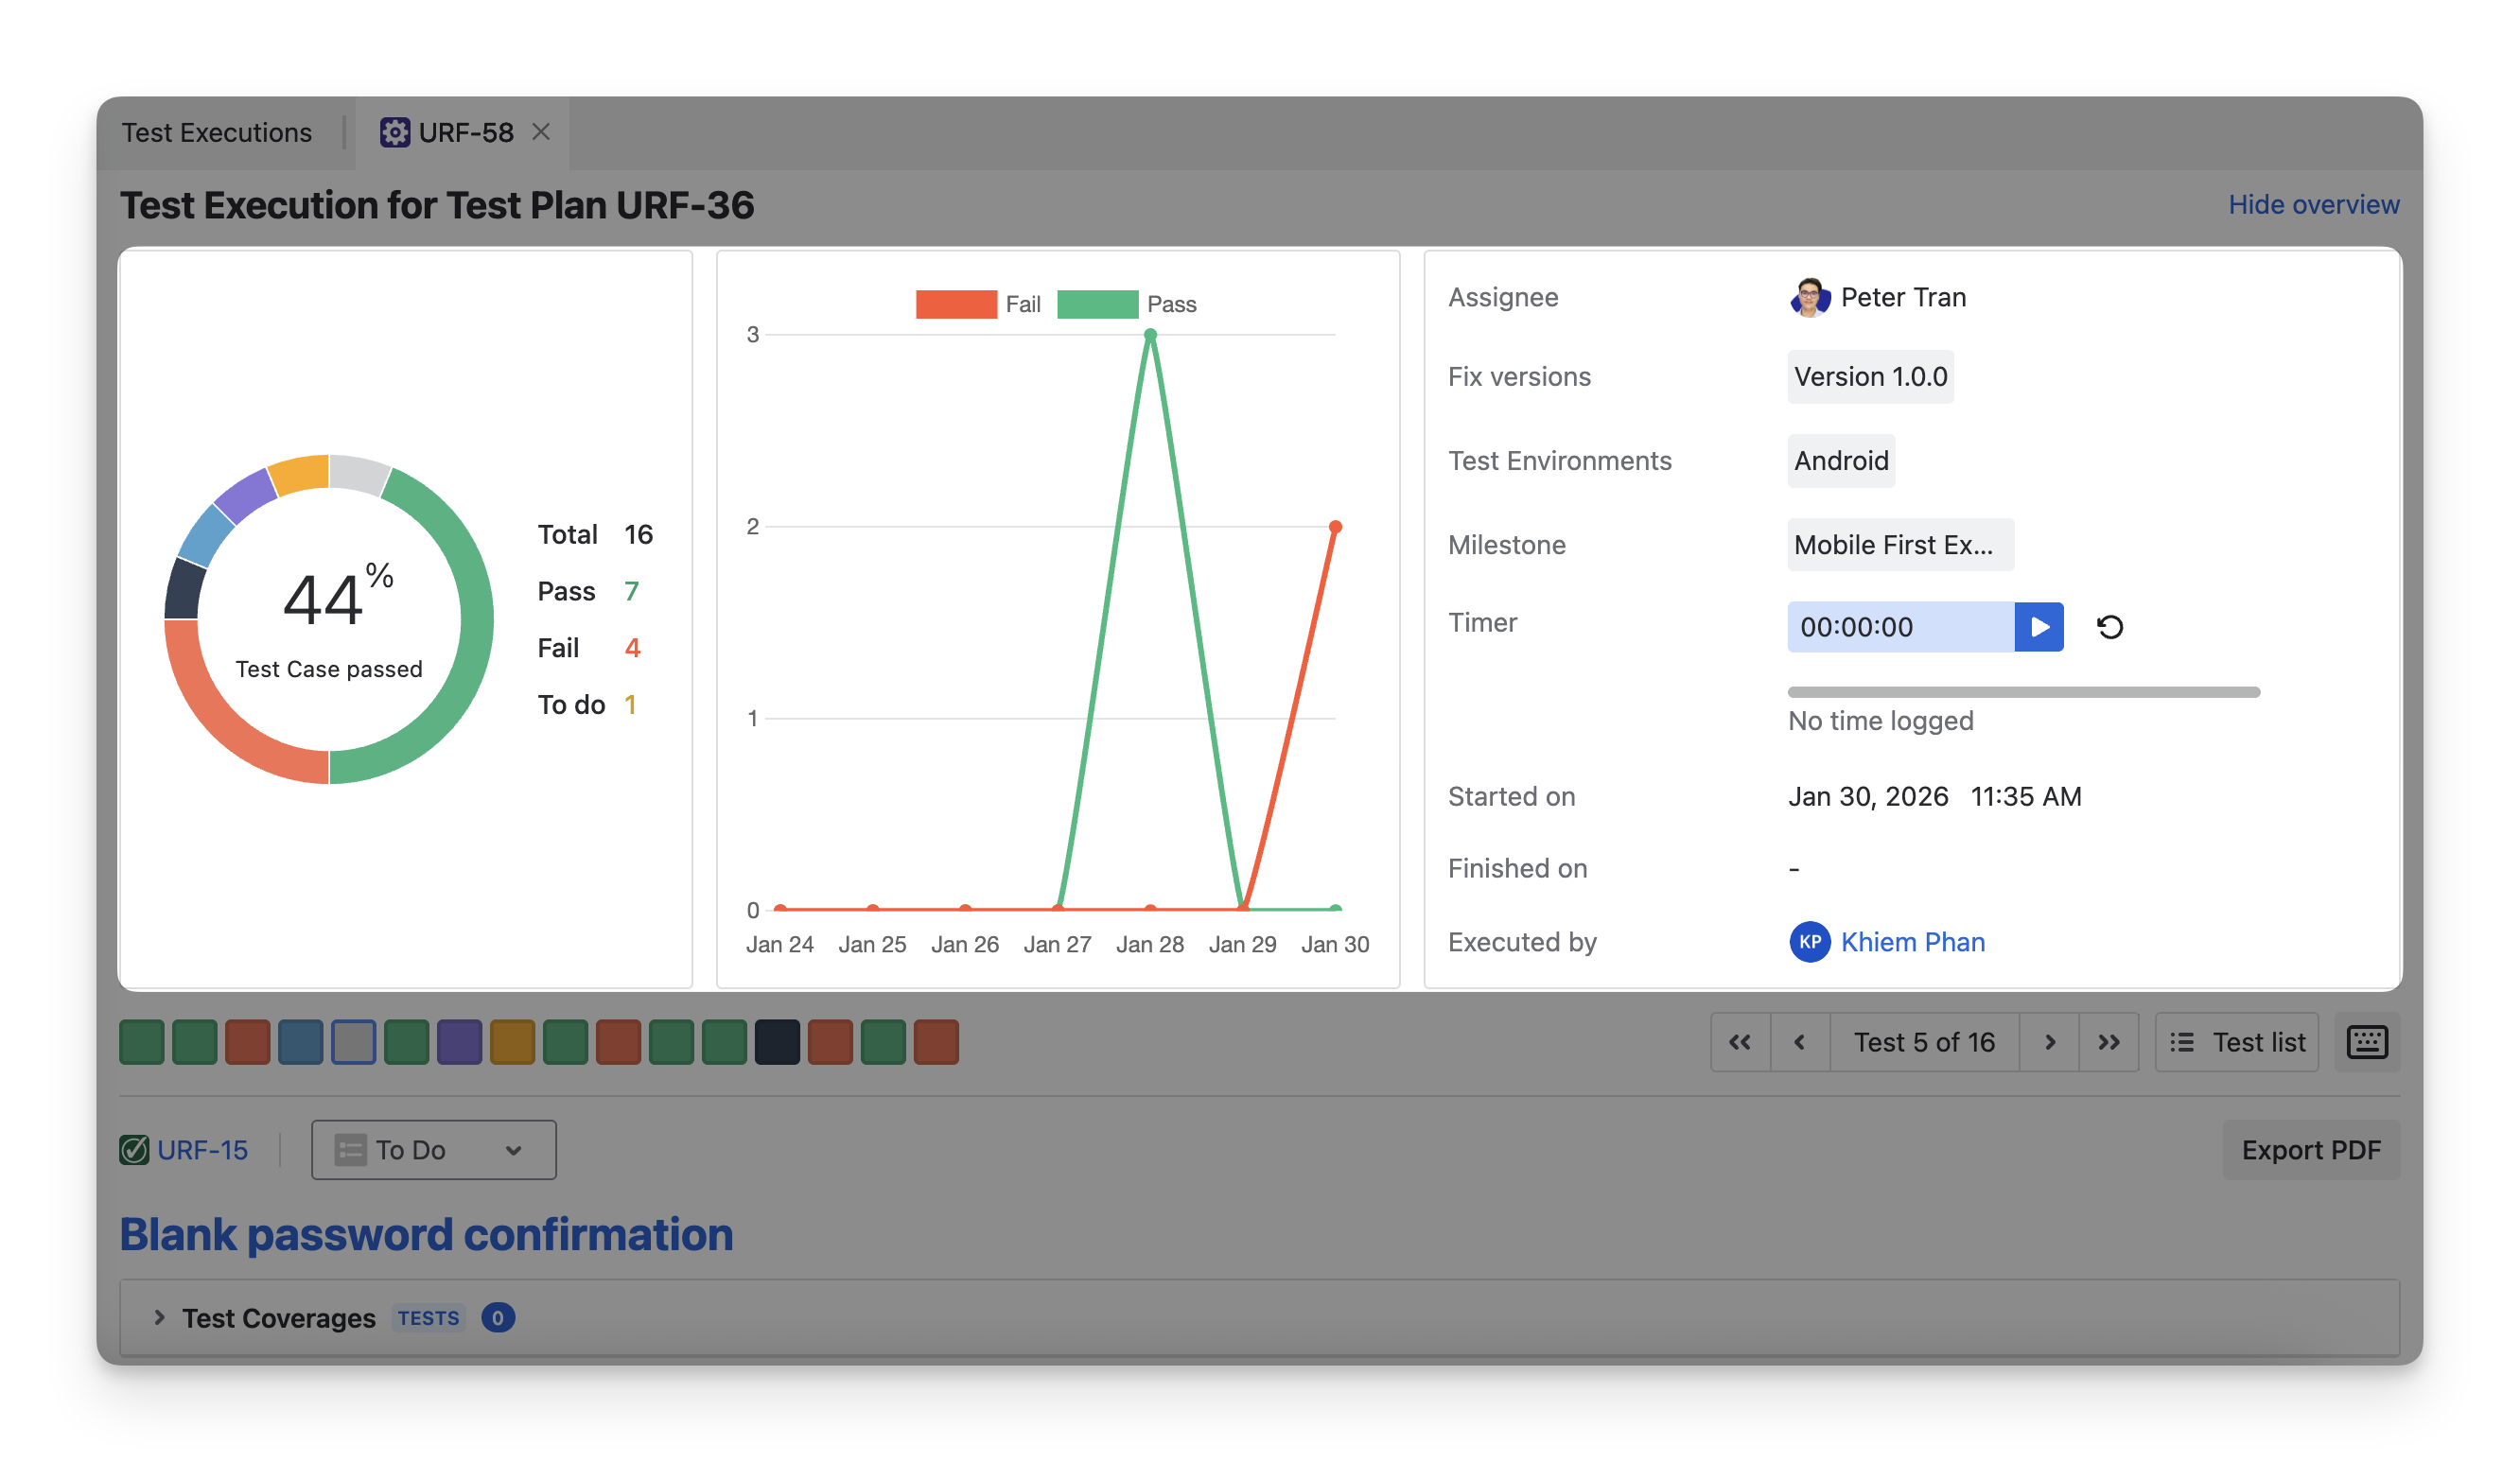
In this section, you can see 3 dashboards that summarize data from your test results.
-
Test Case Status by Percentage: Shows the distribution of test case statuses in percentage form, helping you quickly assess overall test quality.
-
Fail and Pass Trends: Displays how passed and failed test cases change over time, allowing you to track progress and spot issues during the execution period.
-
Execution Information: Provides key execution details such as assignee, test environment, milestone, timer, and execution timeline for better tracking and context.
1. Test Case Status by Percentage
The first dashboard on the left-hand side is the Test Case Status Chart, shown in percentage. It displays the total number of test cases in your test execution, along with the three default execution statuses ( Fail pass todo ). The other custom test case statuses ( query retest Skipped blocked ) will not be displayed.
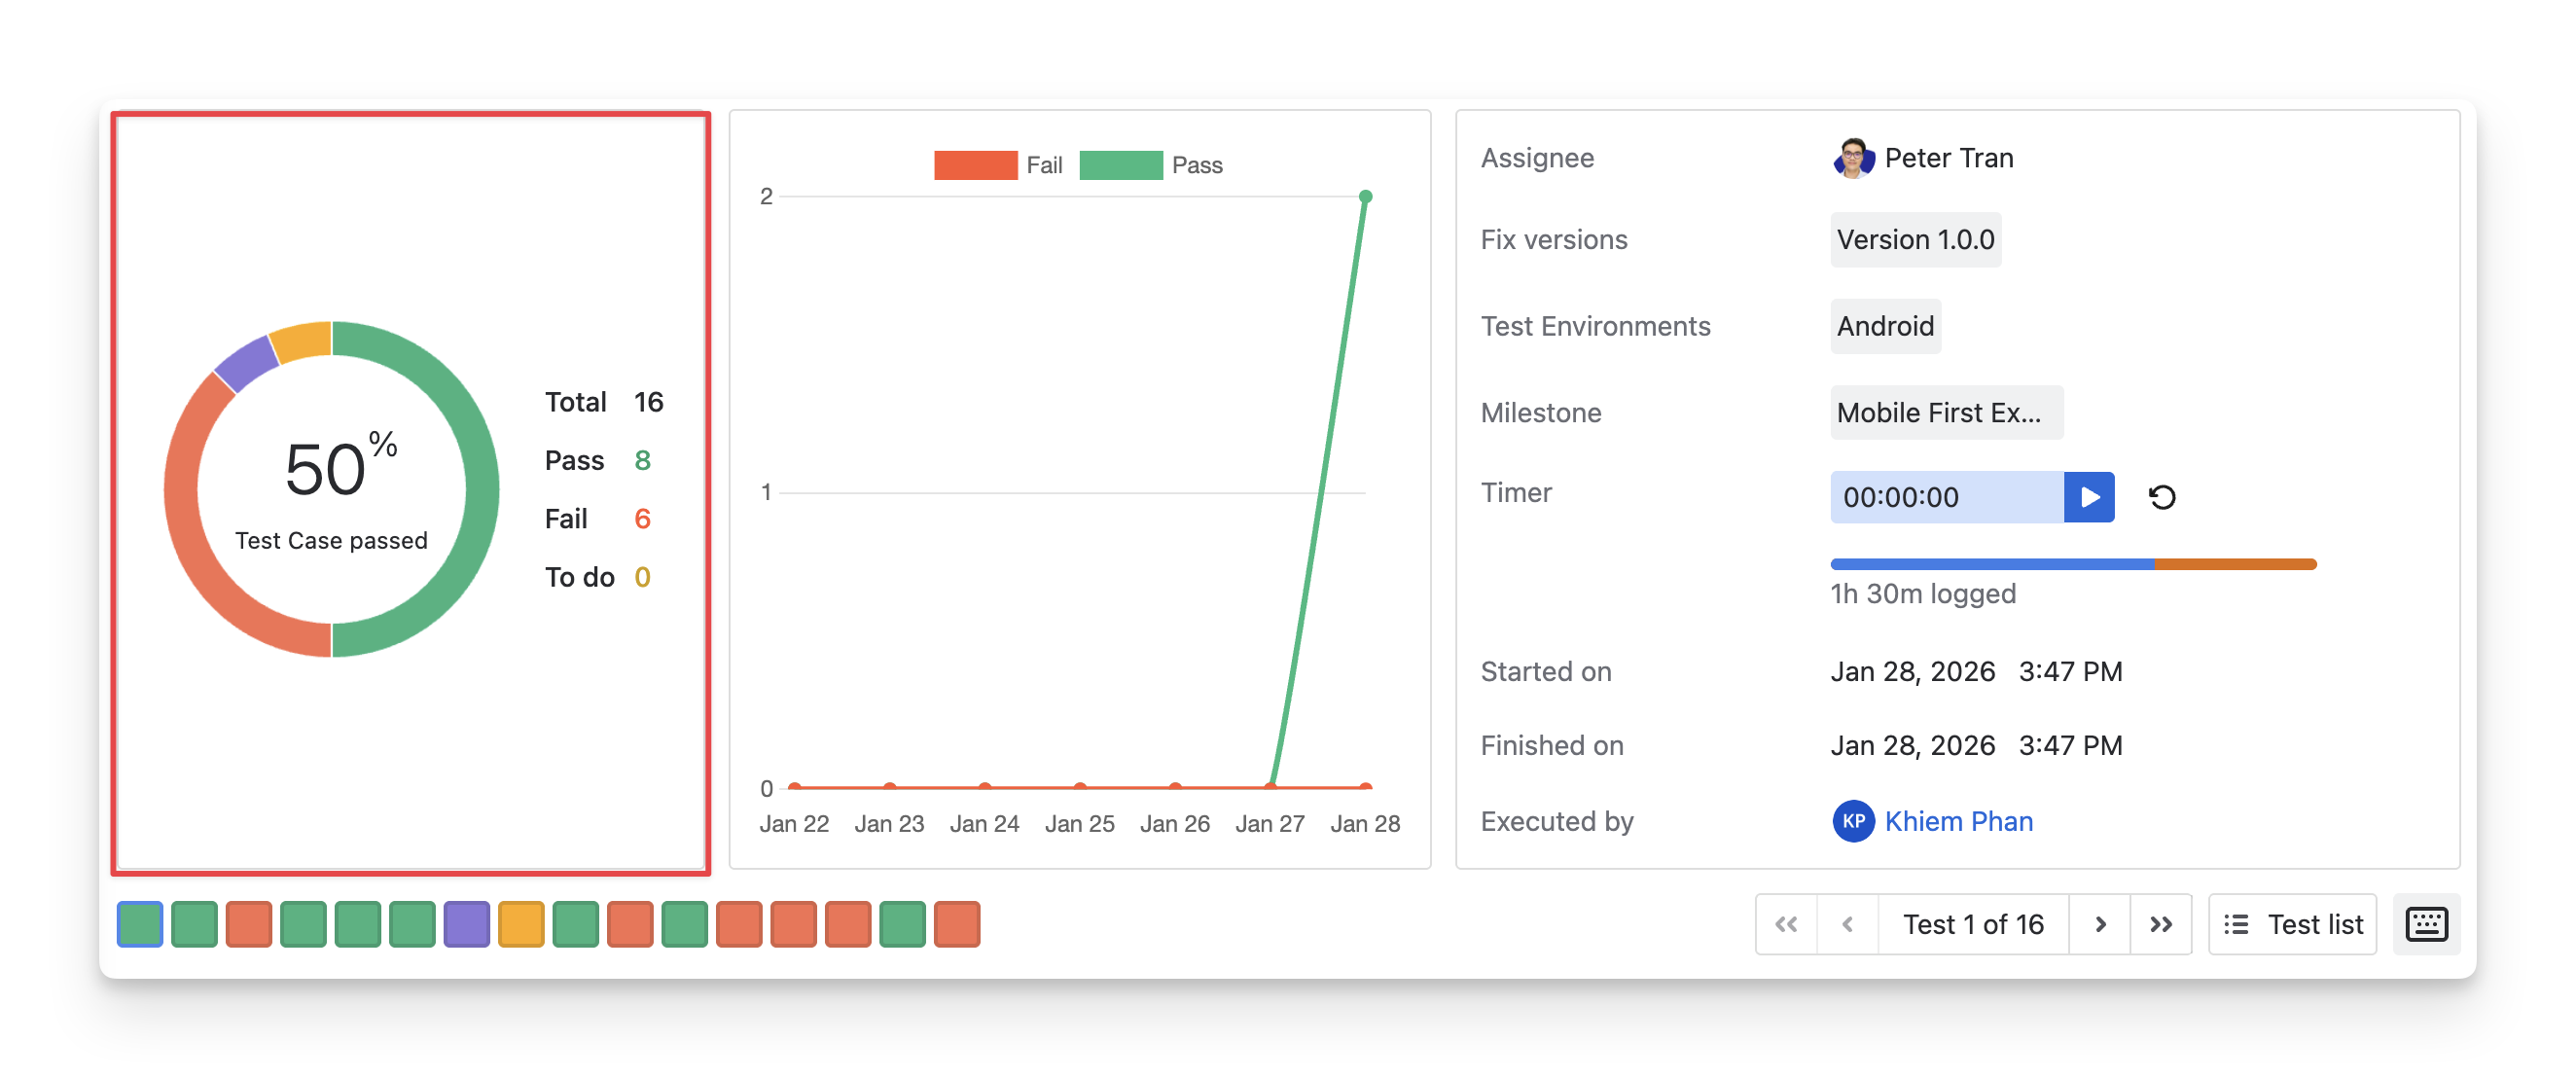
This chart allows QA teams to quickly evaluate the quality of the test execution by looking at the percentage of passed test cases. A high pass rate indicates successful execution, while a lower rate signals potential issues that may need attention.
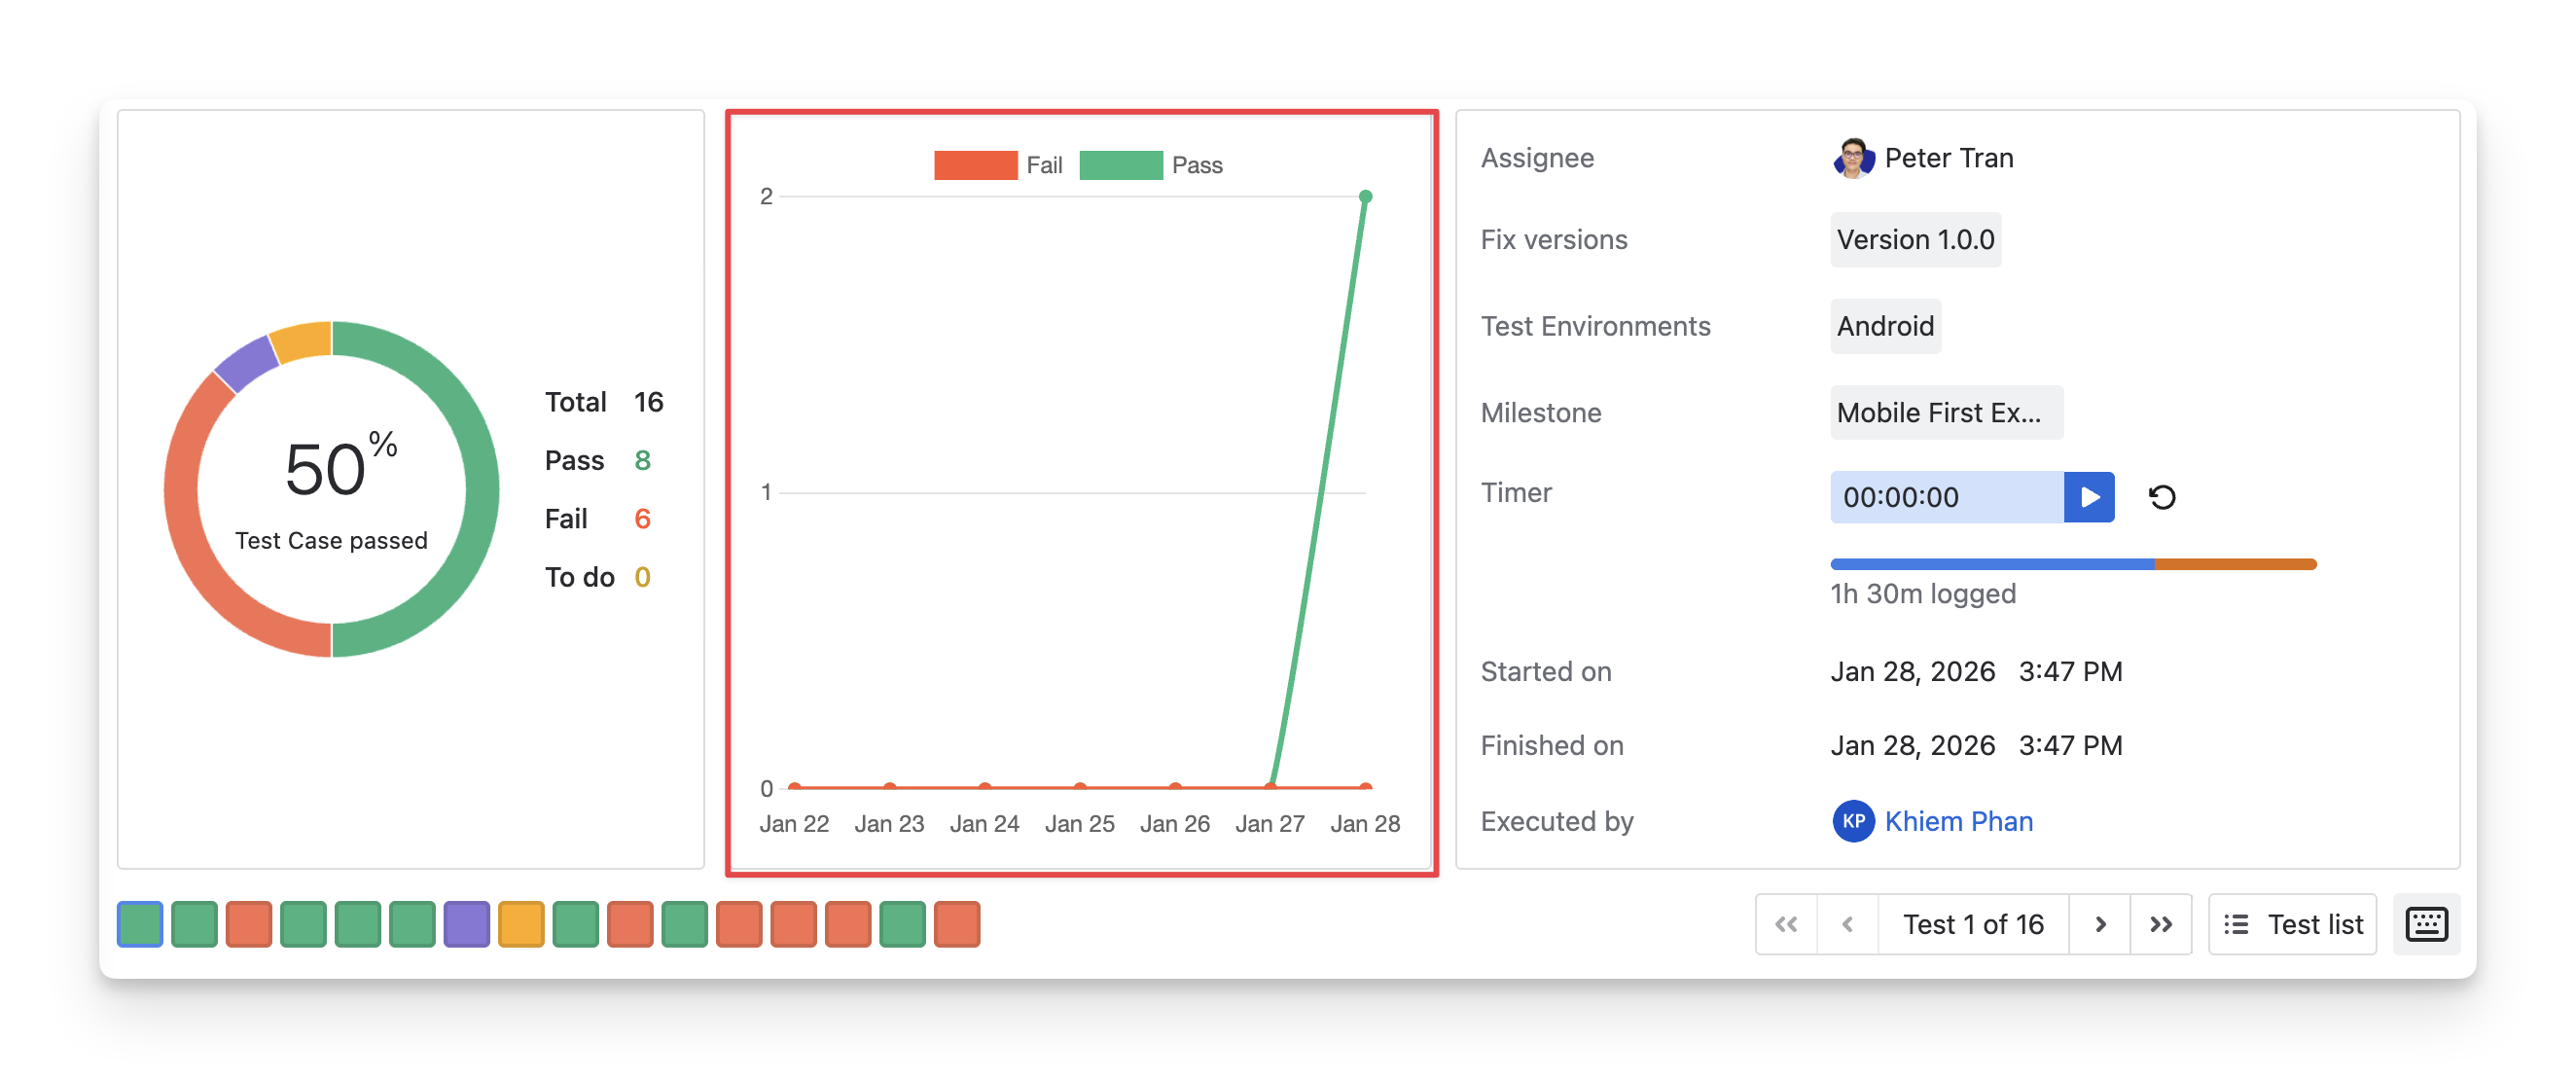
2. Fail And Pass Trends
The second dashboard in the middle is the Fail and Pass Trends of Test Cases. This graph shows the trend of passed and failed test cases over the last 7 days, helping you track test execution progress. A steady increase in passed test cases indicates stable progress, while sudden drops or failures highlight critical areas needing attention.
Note that the fail chart remains after you reassign its Fail status to Pass .
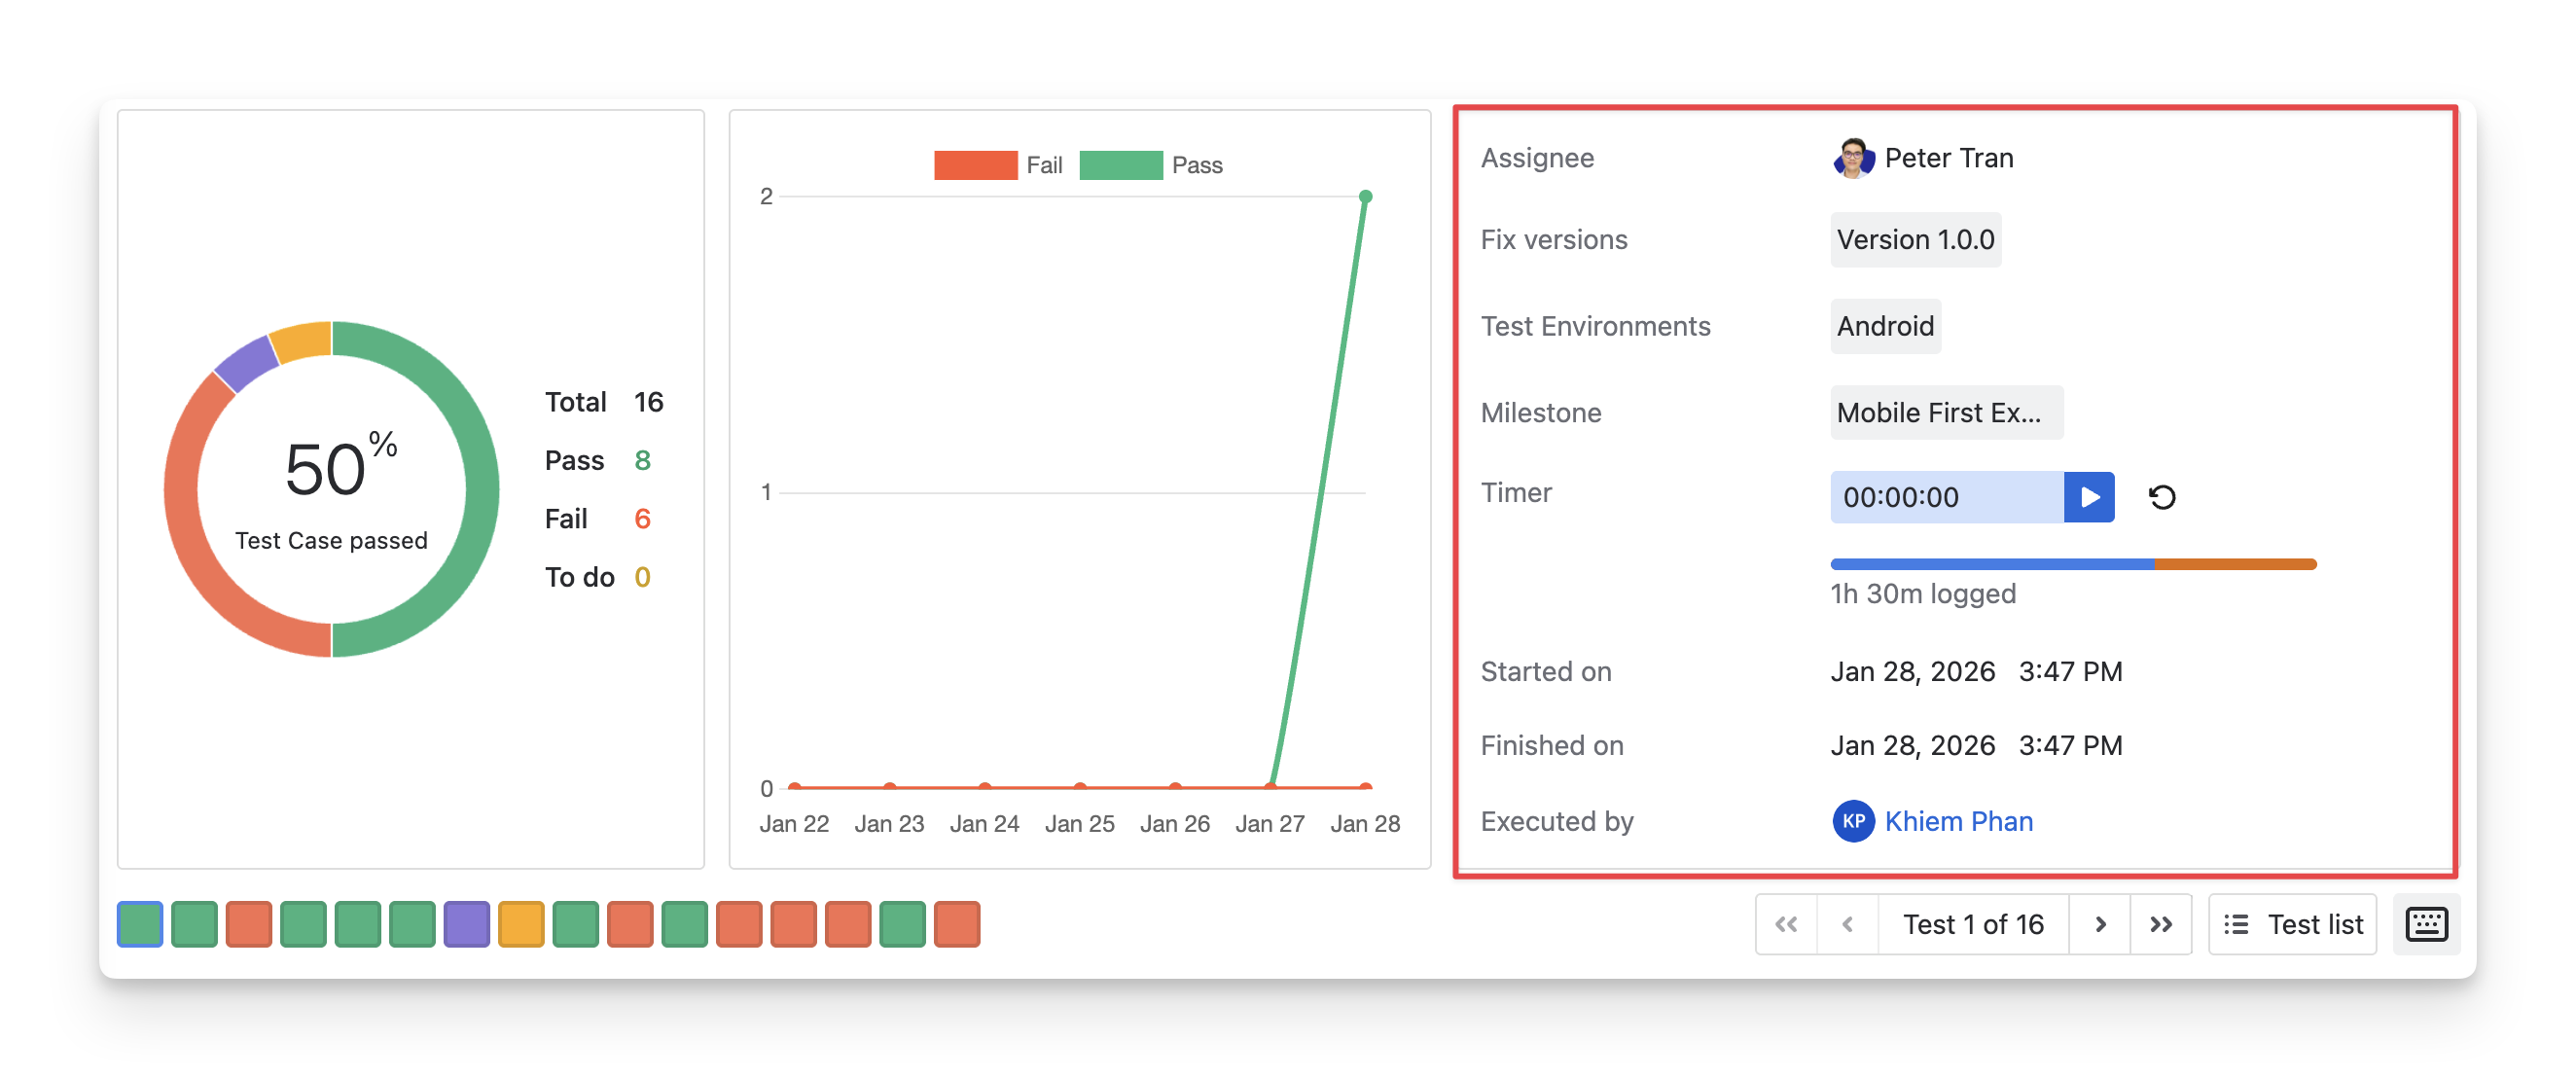
3. Execution Information
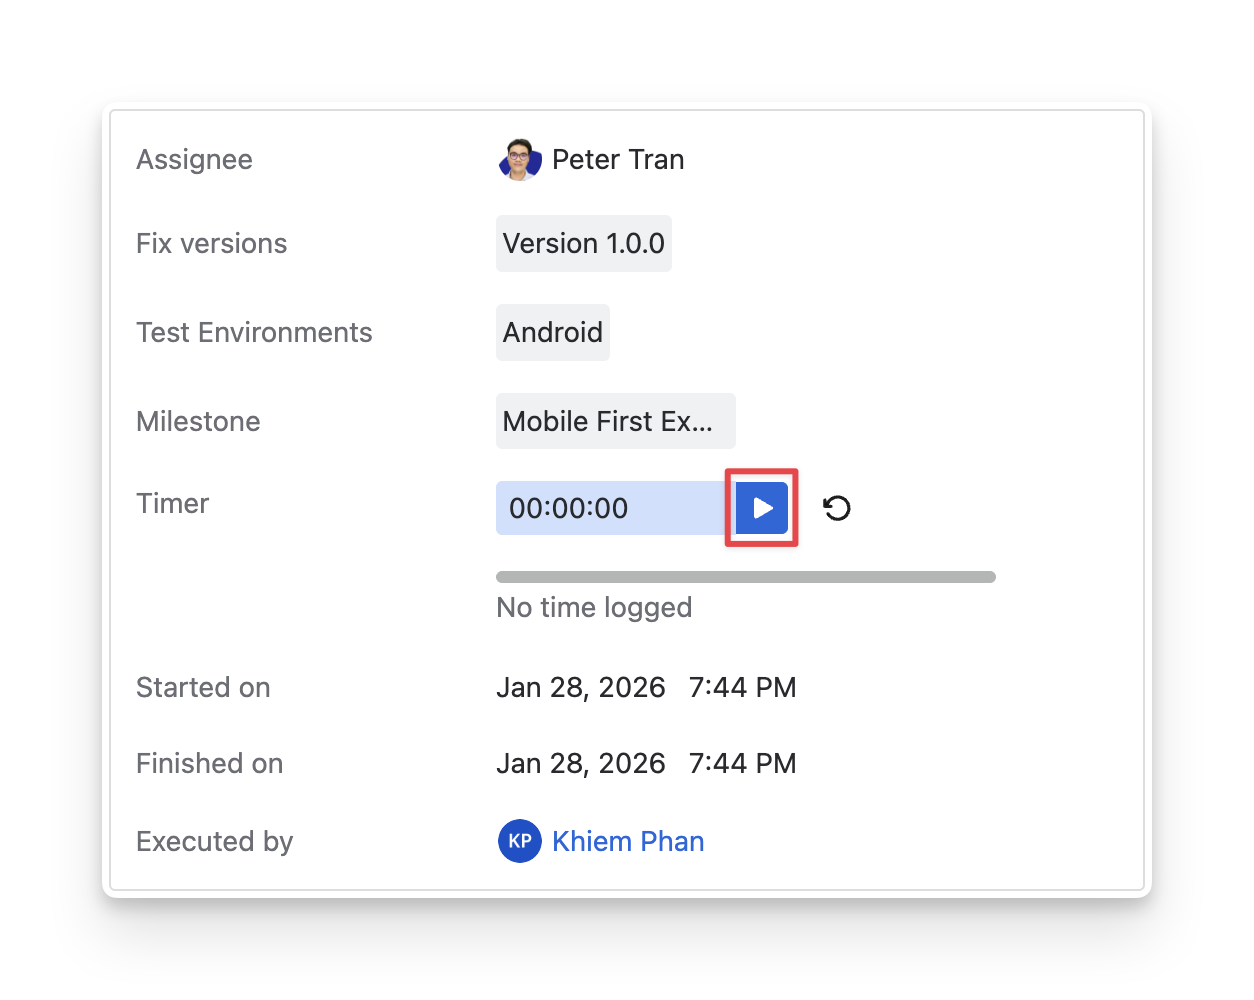
The third dashboard on the right-hand side displays Execution Information, including
-
Assignee: The team member responsible for executing the test.
-
Fix Versions: The version of the product or release associated with the test execution.
-
Test Environments: The environment where the test execution is taking place.
-
Milestone: The milestone this test execution is linked to.
-
Timer: Tracks the time spent on the test execution, showing how long the testing process has taken.
-
Started on: Displays the start date and time of the test execution.
-
Finished on: Shows the end date and time when the test execution was completed.
-
Executed by: The person who performed the test execution.
In this section, you can find the AgileTest Execution Timer. This feature allows you to track the actual time spent on the test execution and monitor if the actual testing time exceeds the planned period.
3.1 Track Execution Time
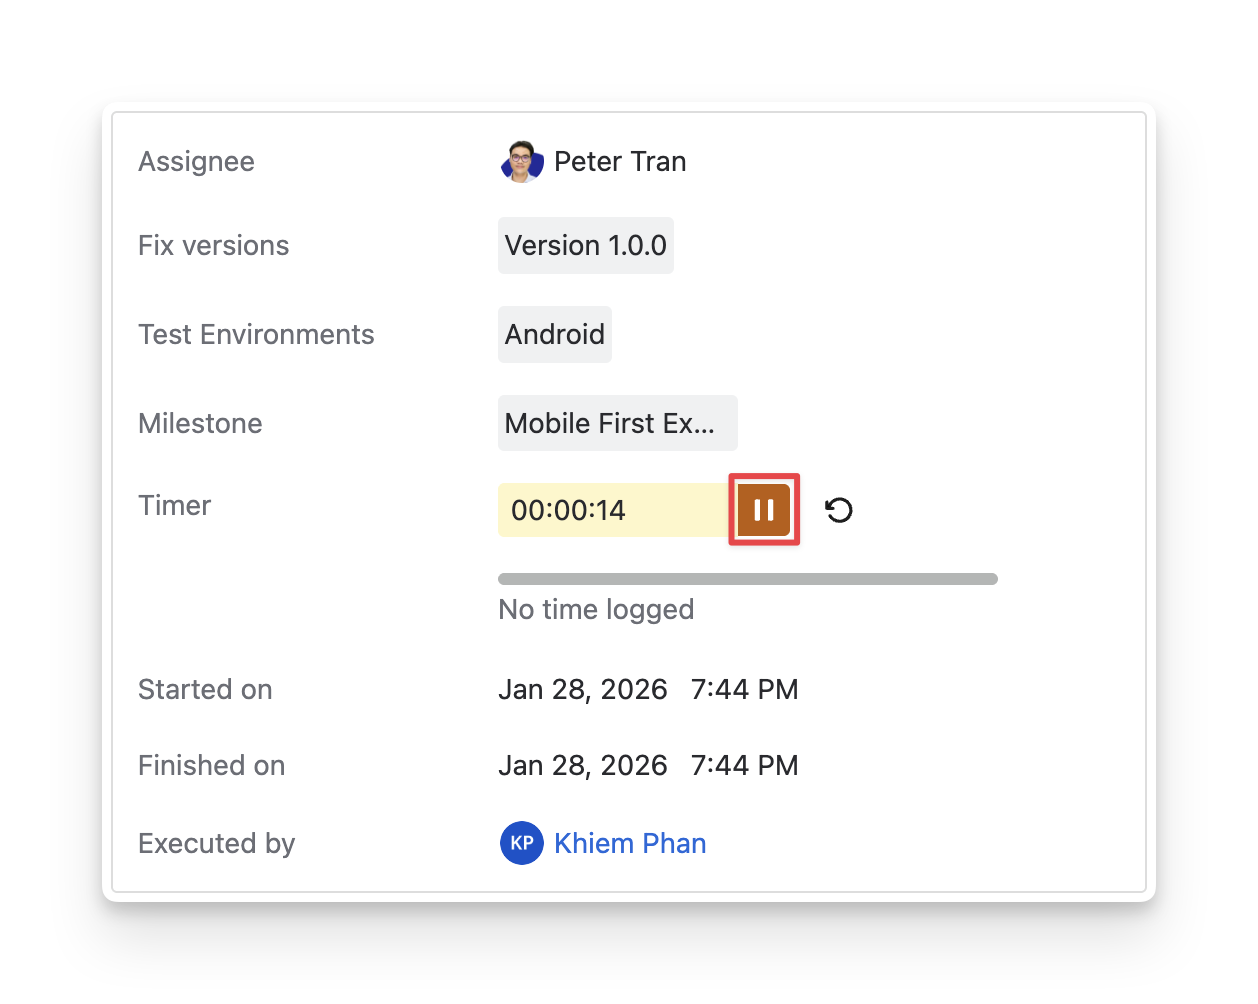
Once you're ready to execute the test cases, start the timer to begin recording the duration of the test execution.
-
When you click the “Start” button, the “Started on” field will record the exact time the execution begins.
-
When you click the “Stop” button, the “Finished on” field will record the exact time the execution ends.
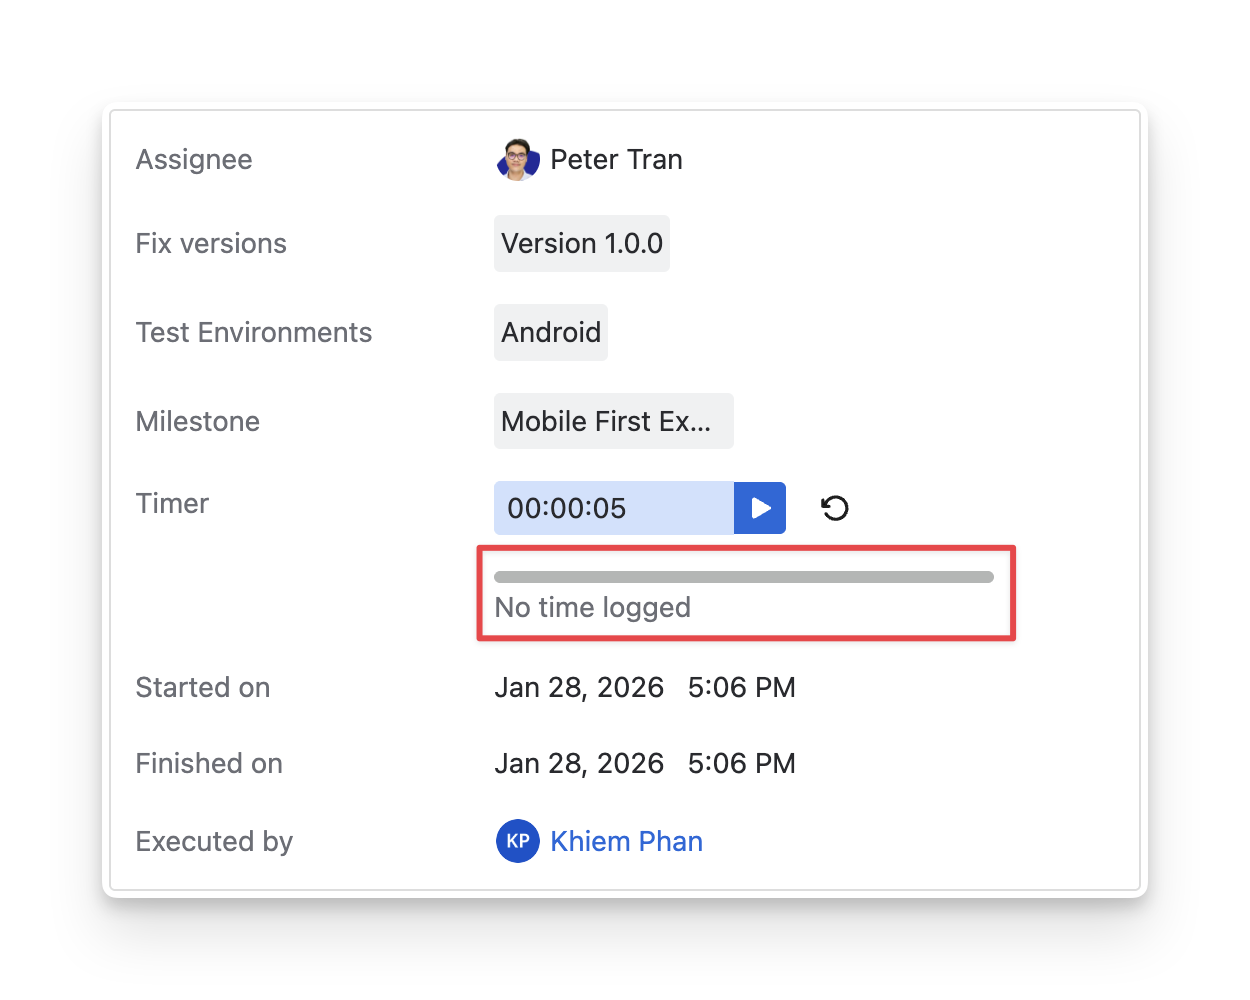
3.2 Monitor Execution Progress
In addition to tracking time, the AgileTest Timer helps you monitor whether the actual execution time exceeds the planned duration, ensuring tests stay on schedule. To do this, follow these steps:
-
Click on the time bar.
-
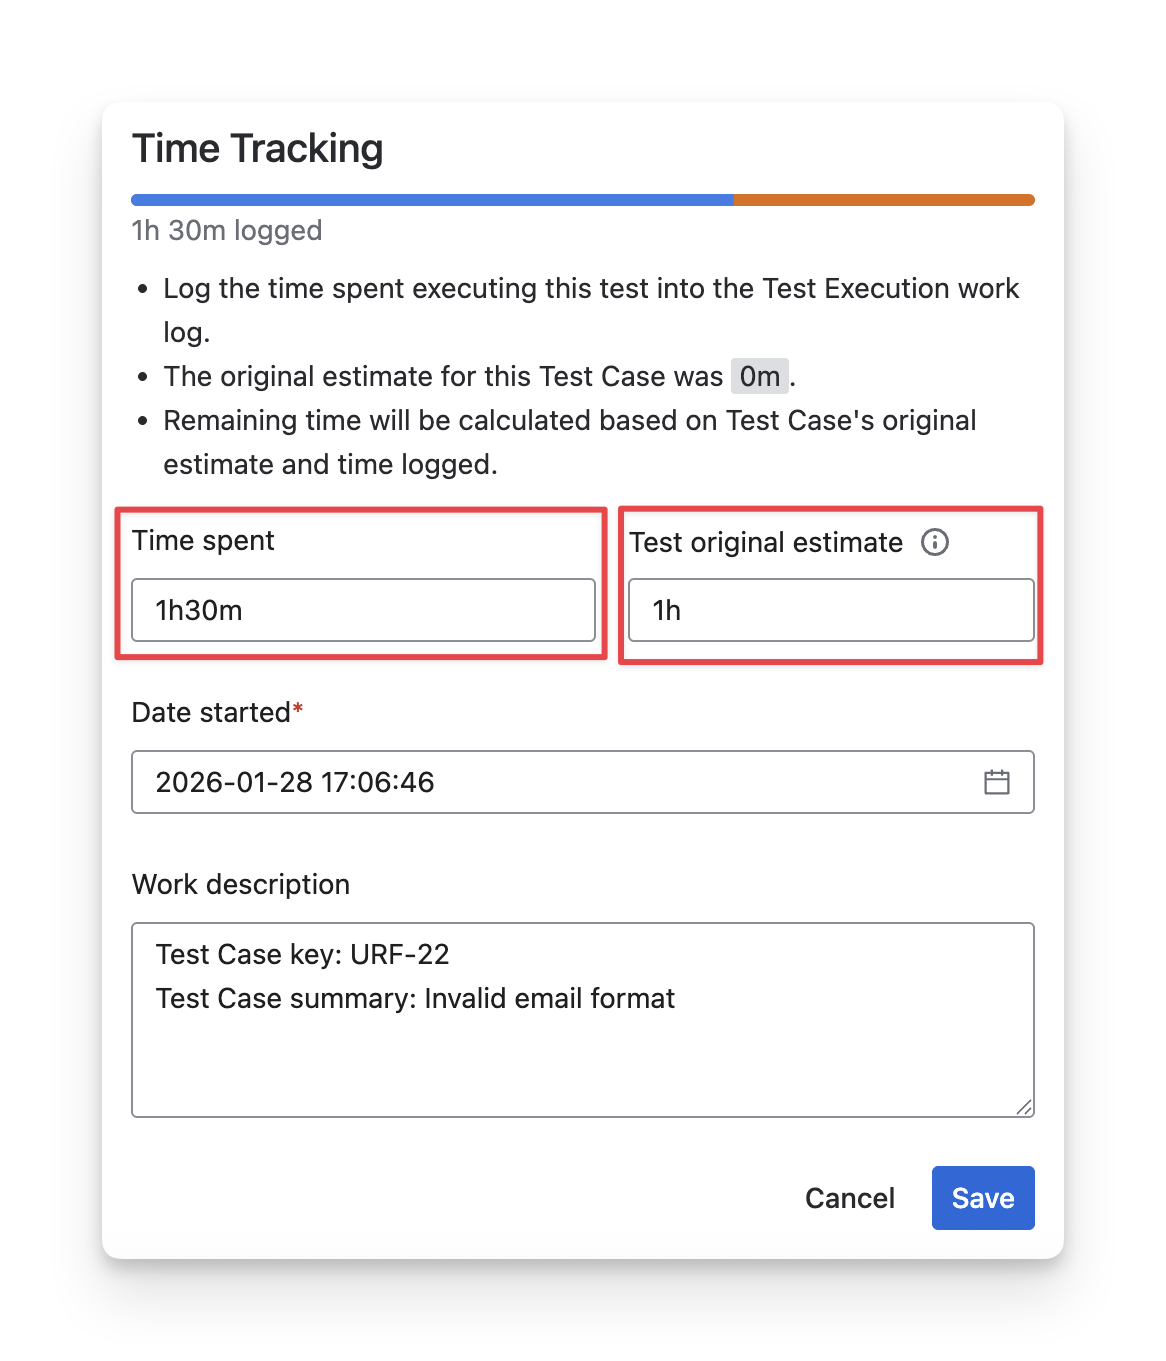
Fill in the time tracking details
-
Fill in your recorded time of the timer in the “Time spent” .
-
Fill in your estimated time to complete this execution in the “Time original estimate” .
-
Click the “Save” button.
-
You will see the record of the test execution on the time bar.
-
The color indicates the estimated time.
-
The orange color indicates the exceeded time.
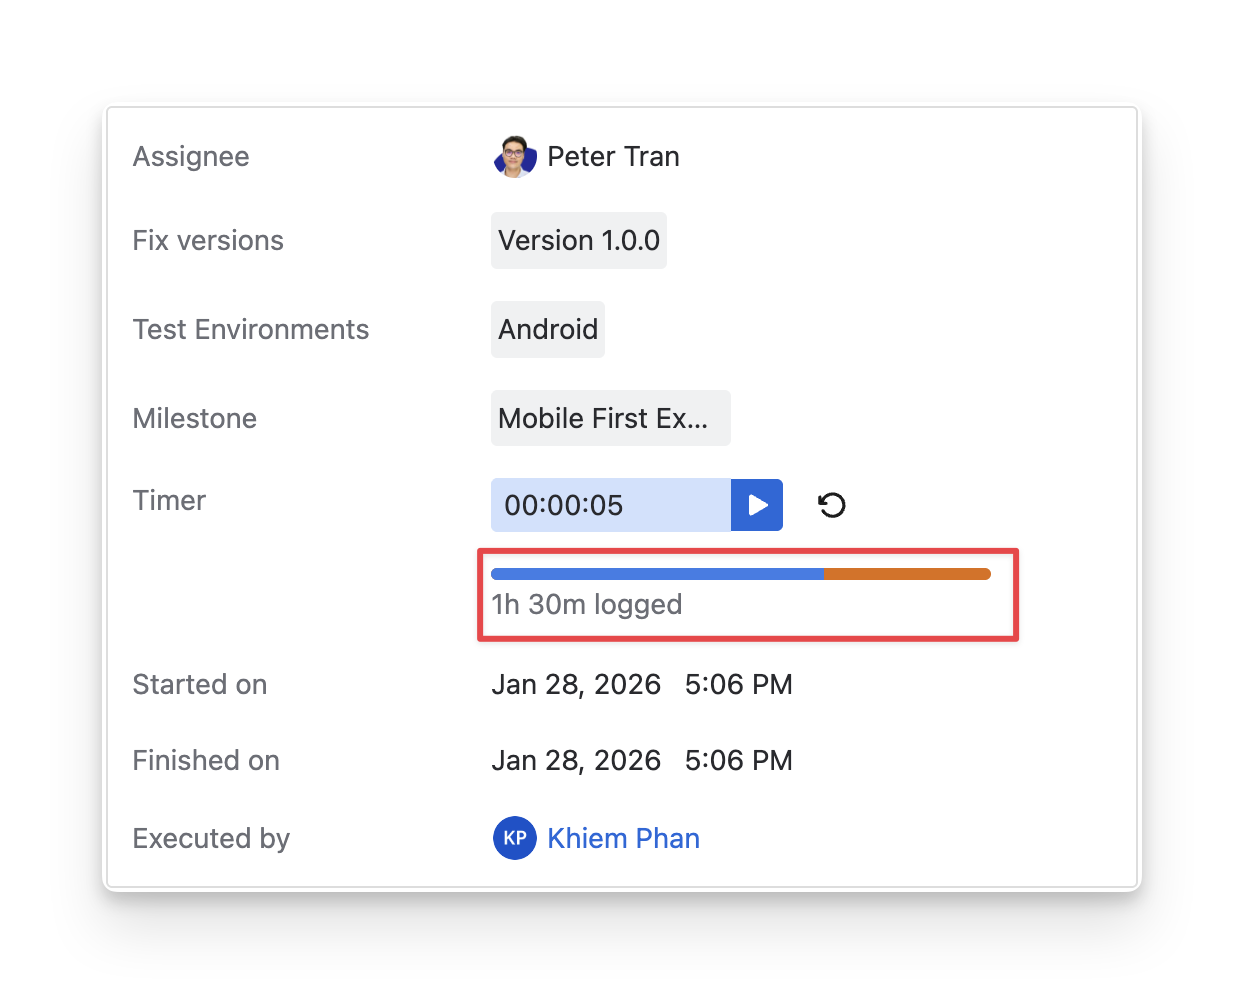
When the orange progress bar dominates the one, it indicates that the test execution has exceeded the planned time. This may suggest potential issues with time planning or unexpected delays during testing.
Should you need any assistance or further AgileTest inquiries, contact our 24/7 Support Desk!