.png)
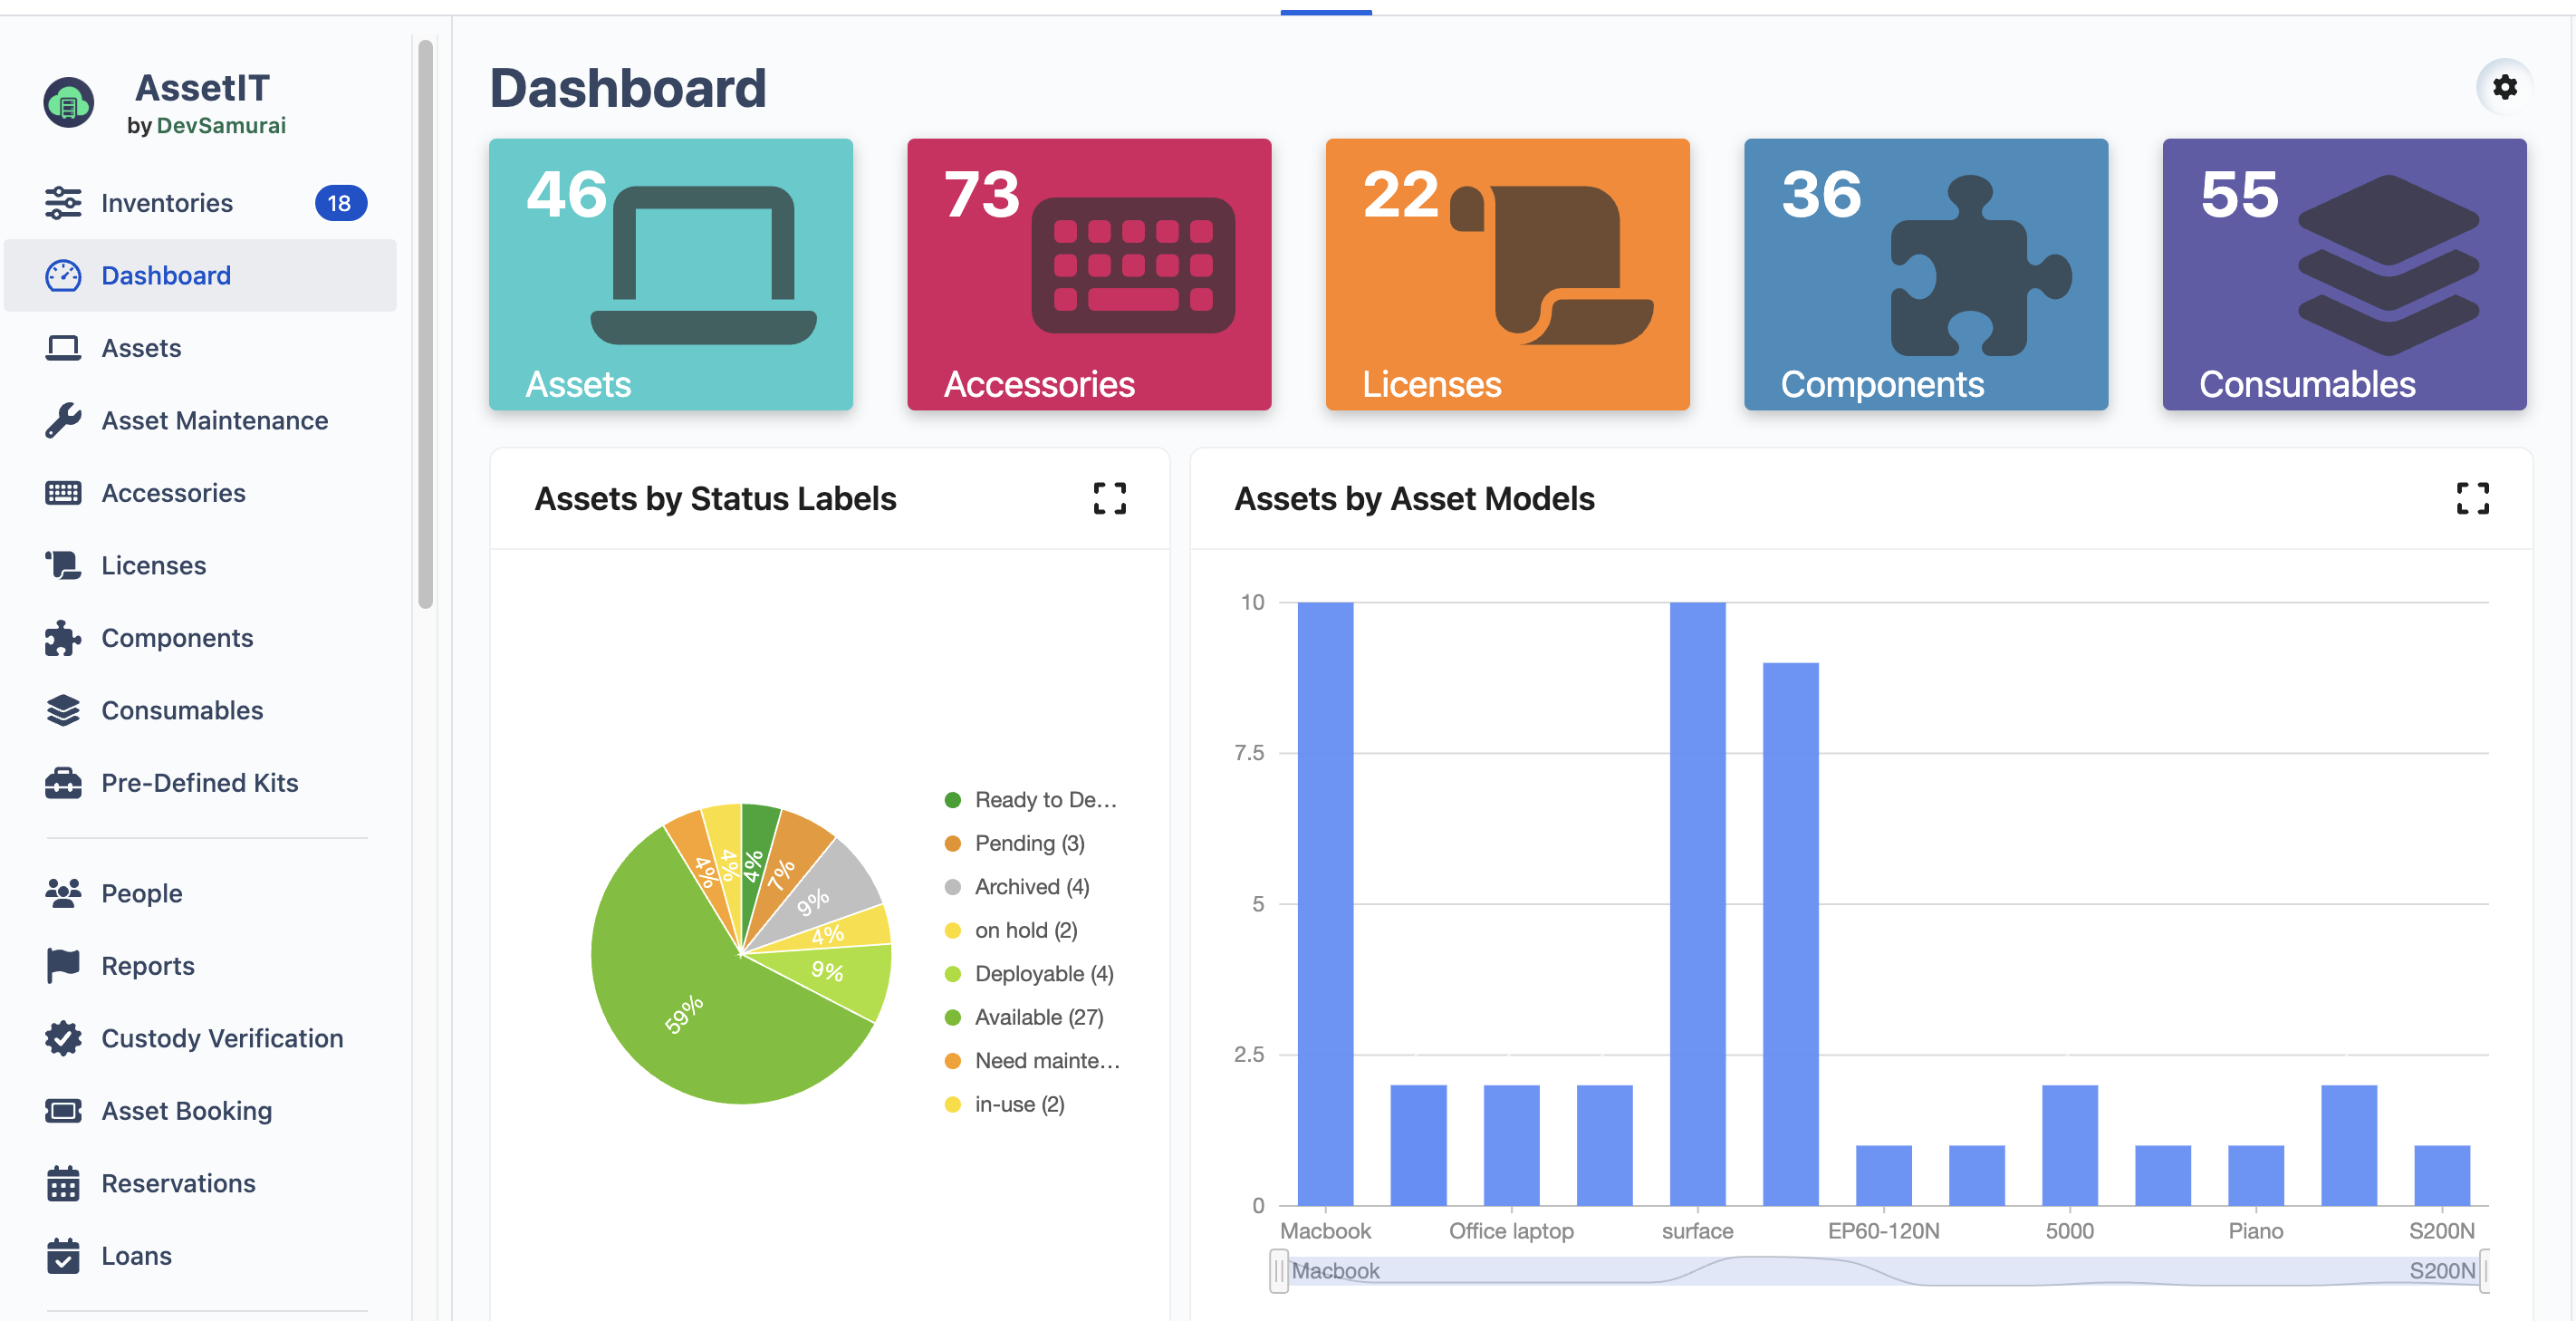
The Dashboard in AssetIT provides a comprehensive view of key data metrics. It offers customizable options to tailor the data visualization according to user preferences.
How to Customize the Dashboard:
Click on the 
-
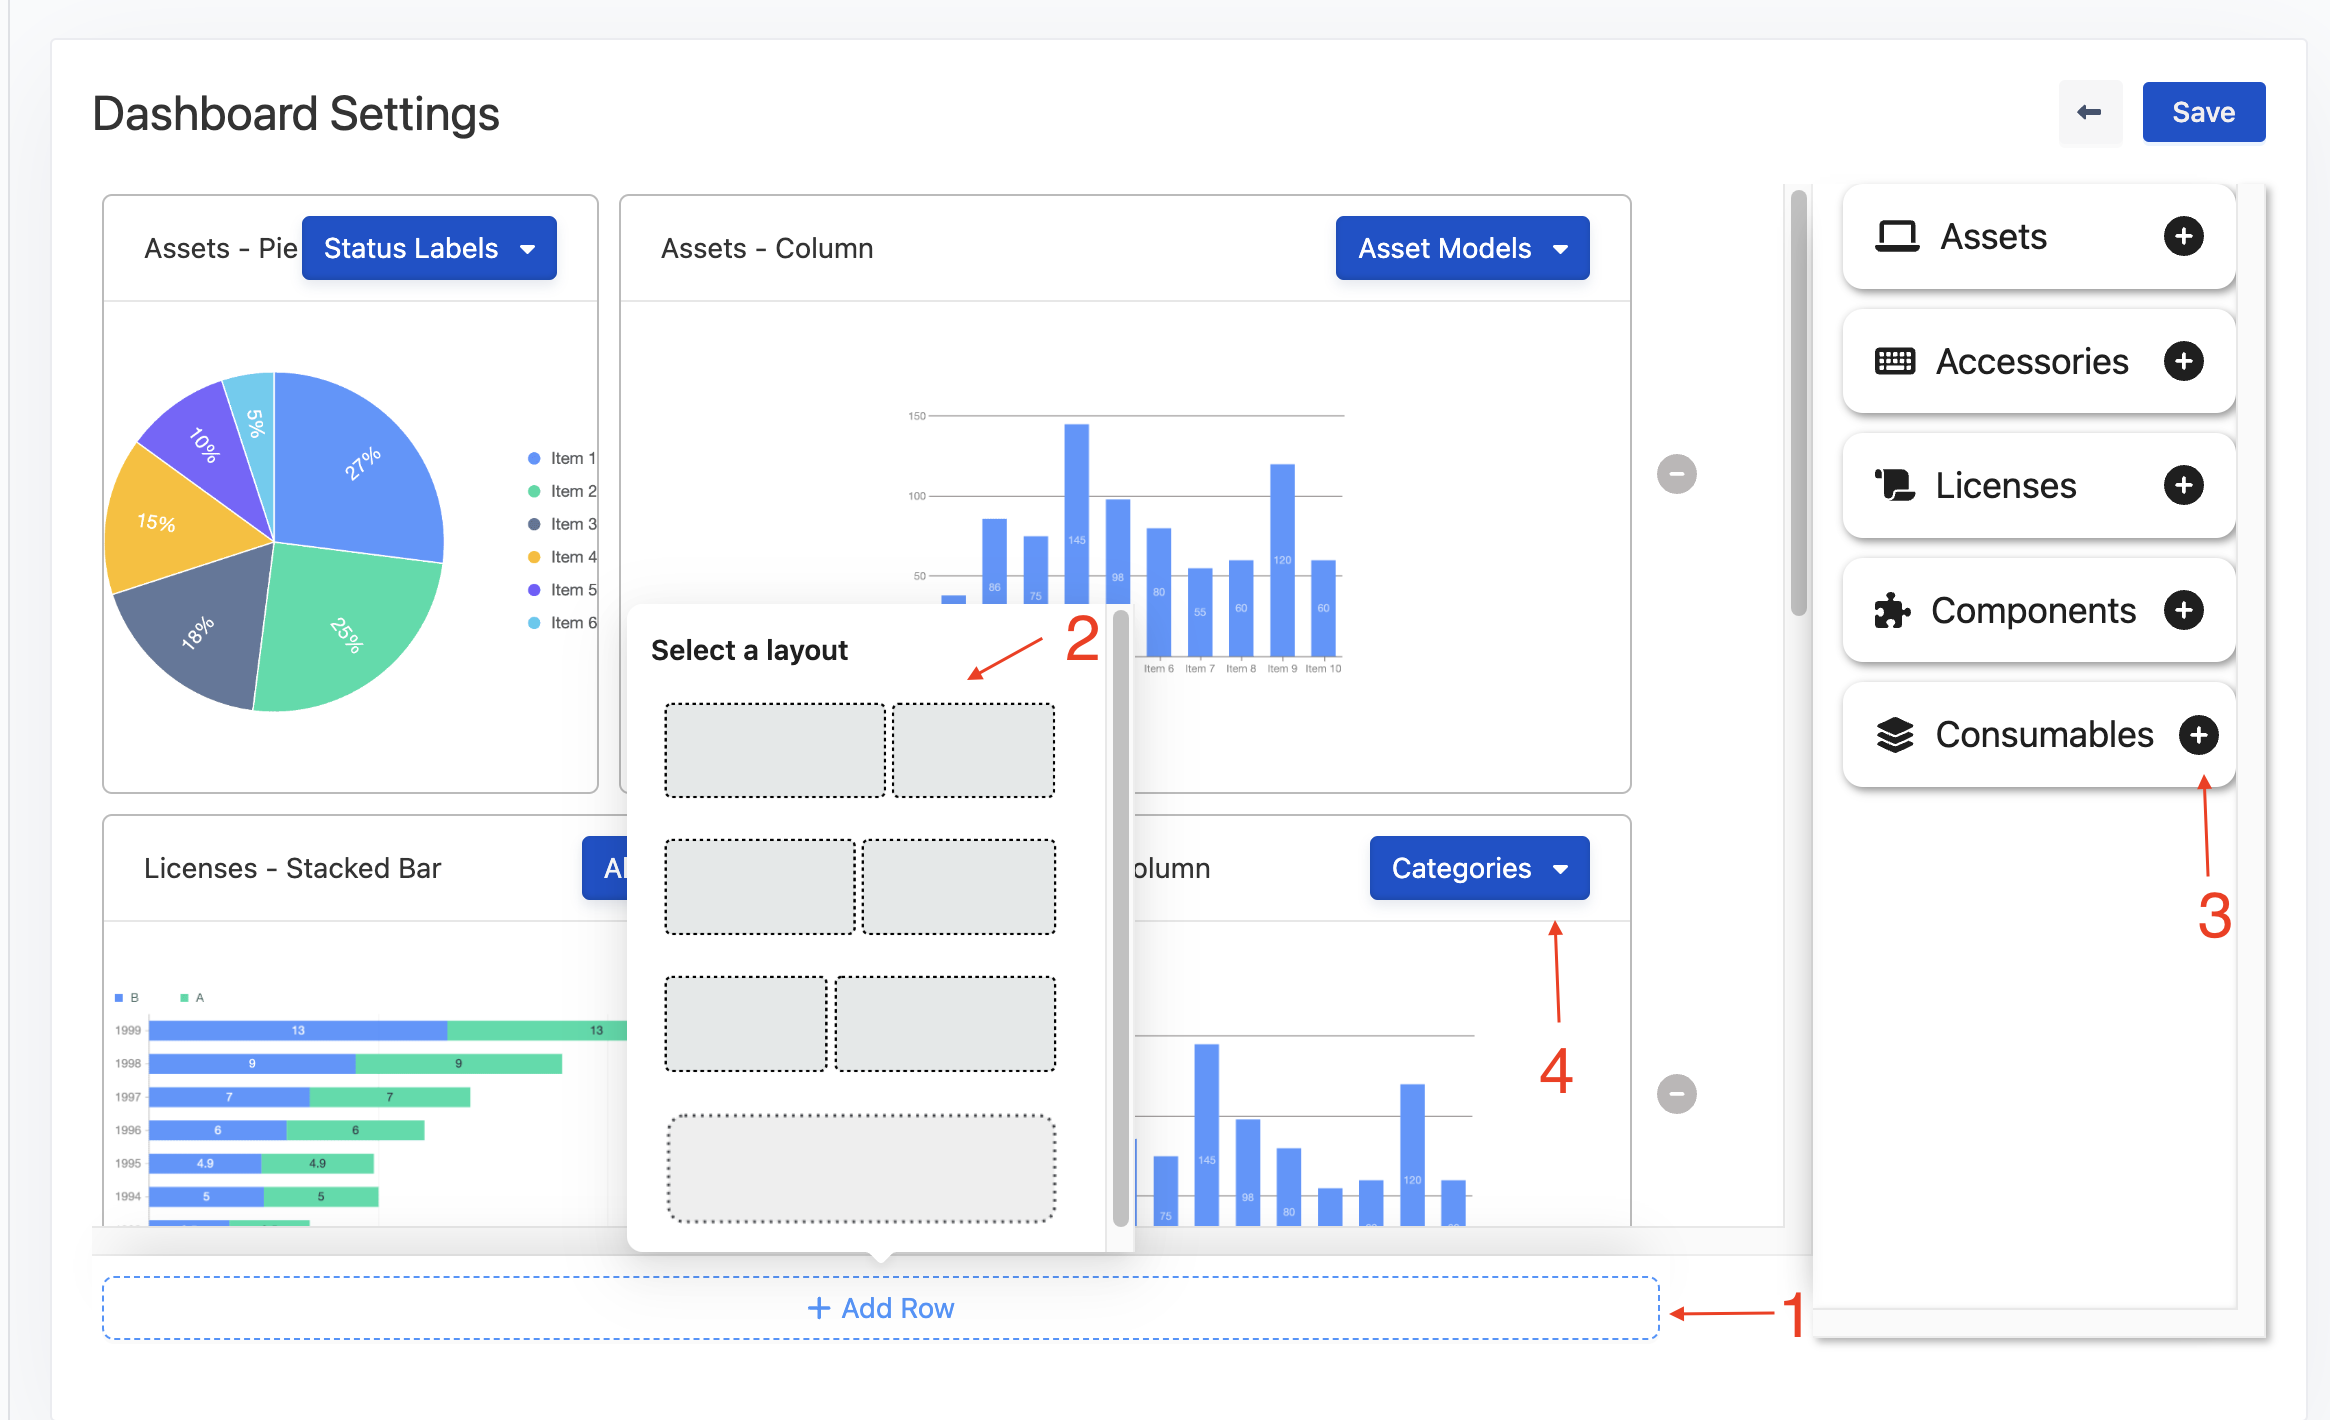
Click Add Row
-
Select a preferred layout.
-
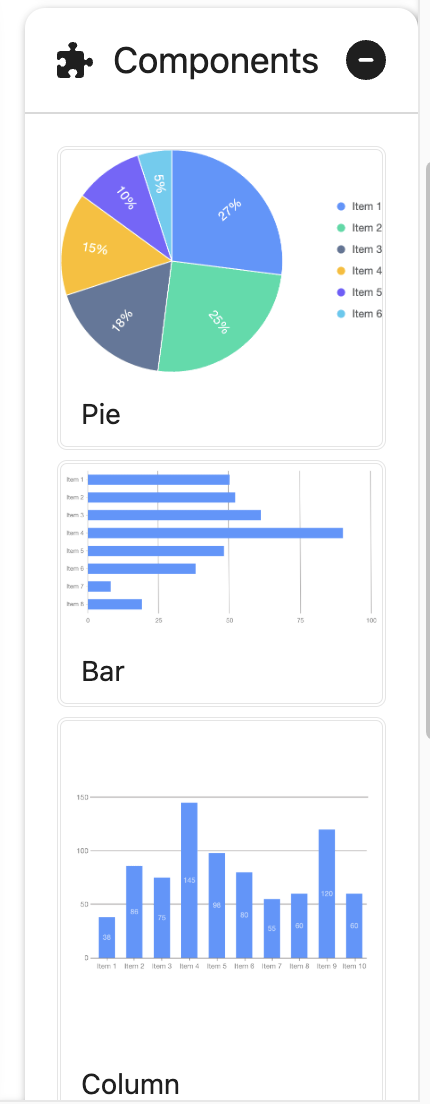
Use the right sidebar to choose a data resource you want to display. Drag and drop chart types (e.g., pie, bar, column, stacked bar, table) to the board.
-
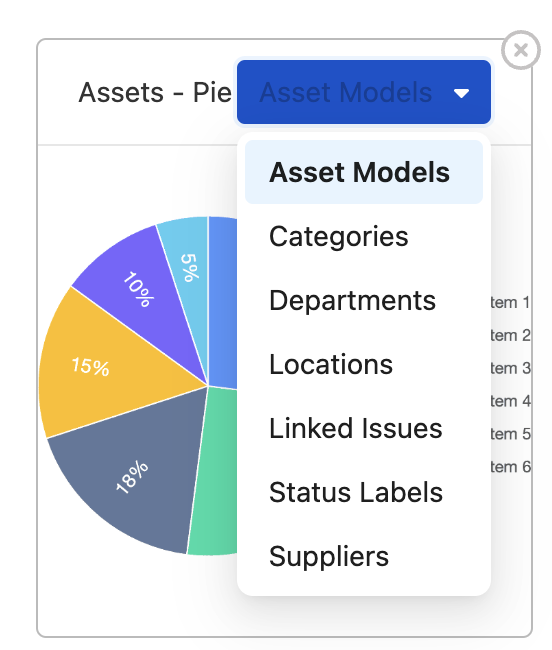
Select data types to display, such as Status Labels, Asset Models, etc. for Assets.