
Use the Cost Report to review financial performance across scheduled and actual work.
It helps Admins and Financial Managers compare billing, cost, margin, and billable hours for selected spaces, members, teams, and time periods.
Permission required: Only Admins and Financial Managers can access financial insights through the Cost Report.
Create a Cost Report
-
From the Reports screen, select the Cost report type.
-
Fill in the report details:
-
Name: Enter a report name. The name can contain up to 255 characters.
-
Access: Choose whether the report is Public or Private.
-
-
Click Save to create the report and open the report details screen.
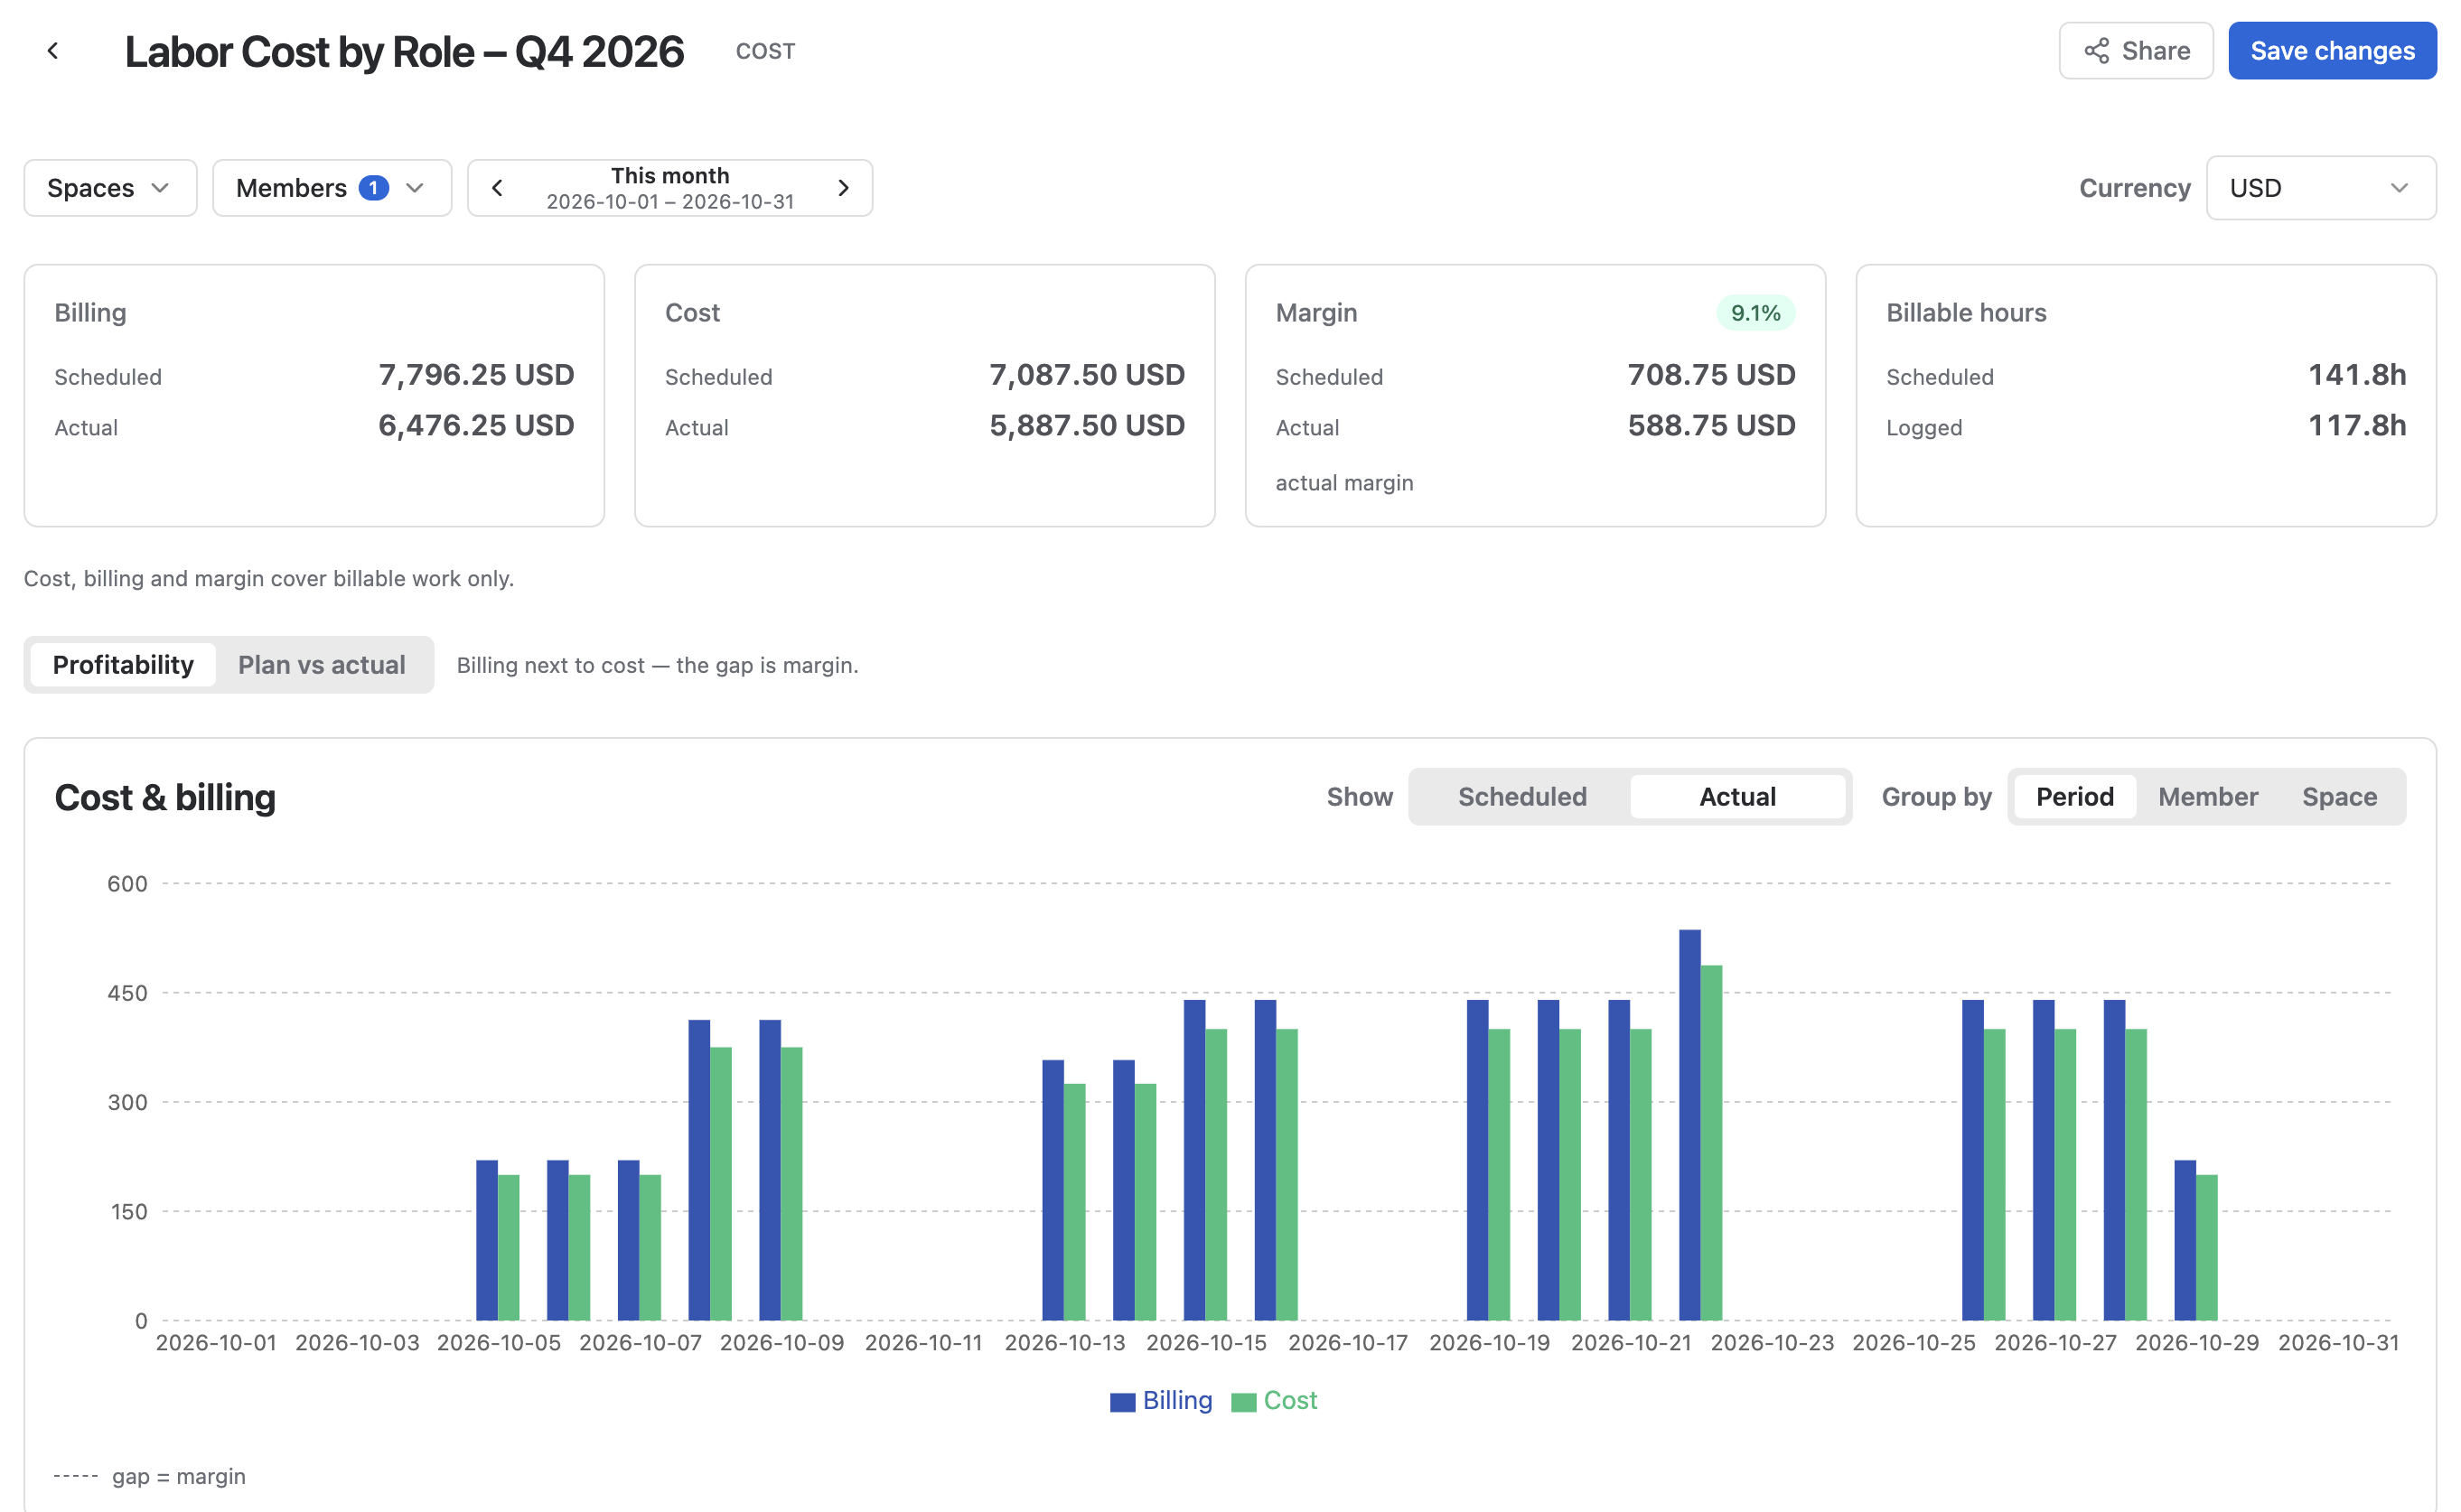
Set report filters
Use filters to define which financial data is included in the report.
|
Filter |
Description |
|---|---|
|
Spaces |
Select one or more spaces to include in the report. |
|
Members or Teams |
Choose the members or teams whose financial data you want to analyze. |
|
Time Range |
Choose the reporting period. Use Dynamic Range for rolling periods, such as This Week or Last 30 Days. Use Fixed Range to select a specific start and end date. |
|
Currency |
Select the currency available for the filtered spaces and members. |
Dynamic ranges update automatically as time progresses. Fixed ranges keep the report locked to the selected dates.
Report overview
The report overview summarizes key financial metrics based on the selected filters.

|
Metric |
Description |
|---|---|
|
Billing |
Shows scheduled and actual billable amounts. |
|
Cost |
Shows scheduled and actual cost amounts. |
|
Margin |
Shows scheduled margin, actual margin amount, and actual margin percentage. |
|
Billable hours |
Shows scheduled and actual billable hours. |
Cost, billing, and margin calculations include billable work only.
Report charts
The Cost report includes two chart views. Use the chart switcher in the top-left corner of the chart area to change views.
Profitability chart
The Profitability chart compares billing and cost side by side. The difference between them represents margin.
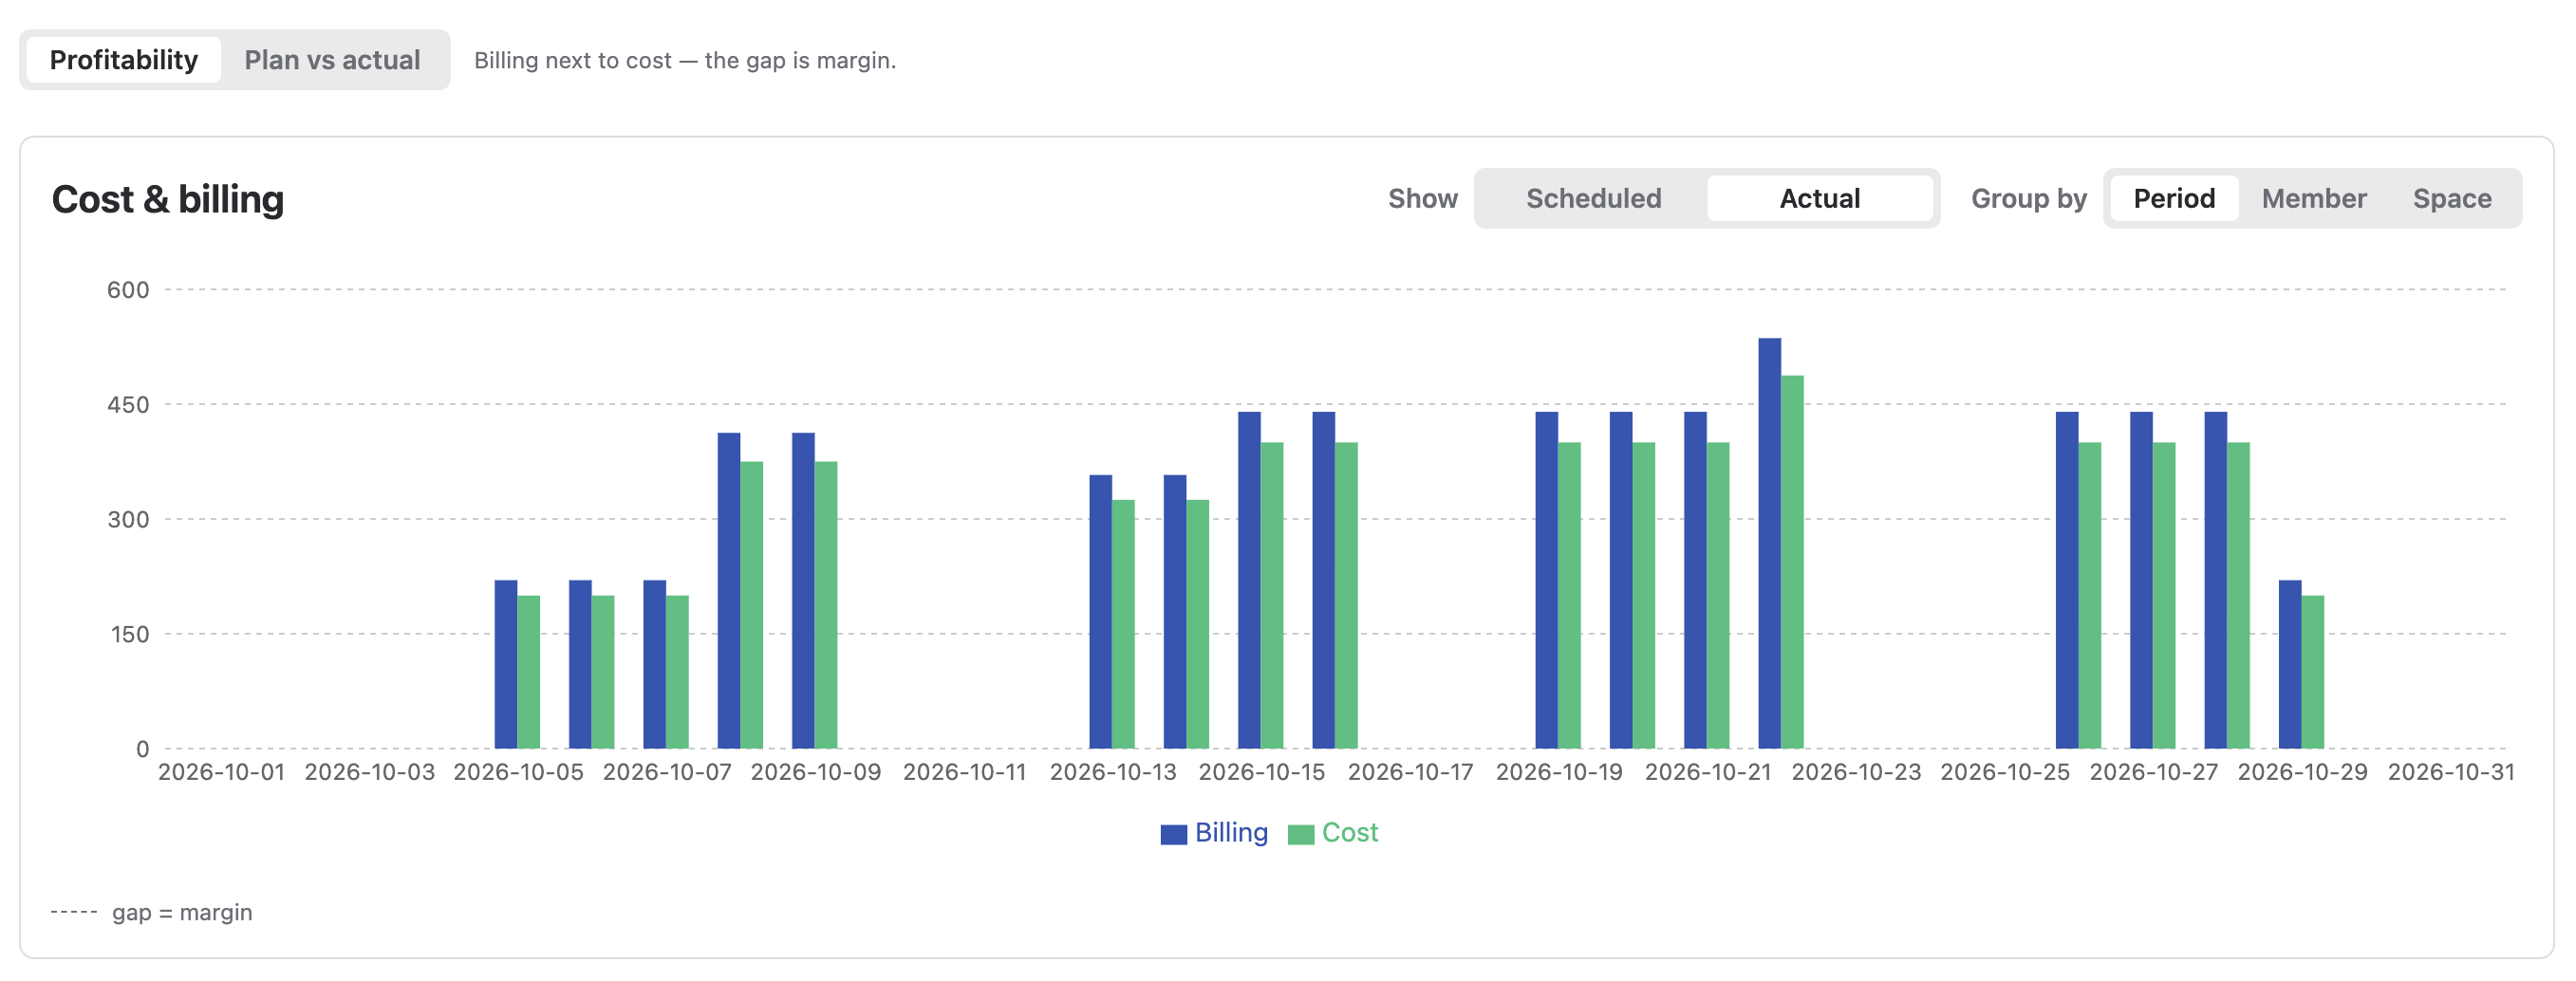
Use this chart to review the profitability of the selected spaces, members, or teams. You can switch between Scheduled and Actual profitability to compare planned financial performance with real results.
You can also group the chart by:
-
Period: Review profitability over time.
-
Member: Compare profitability by team member.
-
Project: Compare profitability by project.
Plan vs actual chart
The Plan vs actual chart compares planned values with actual results.
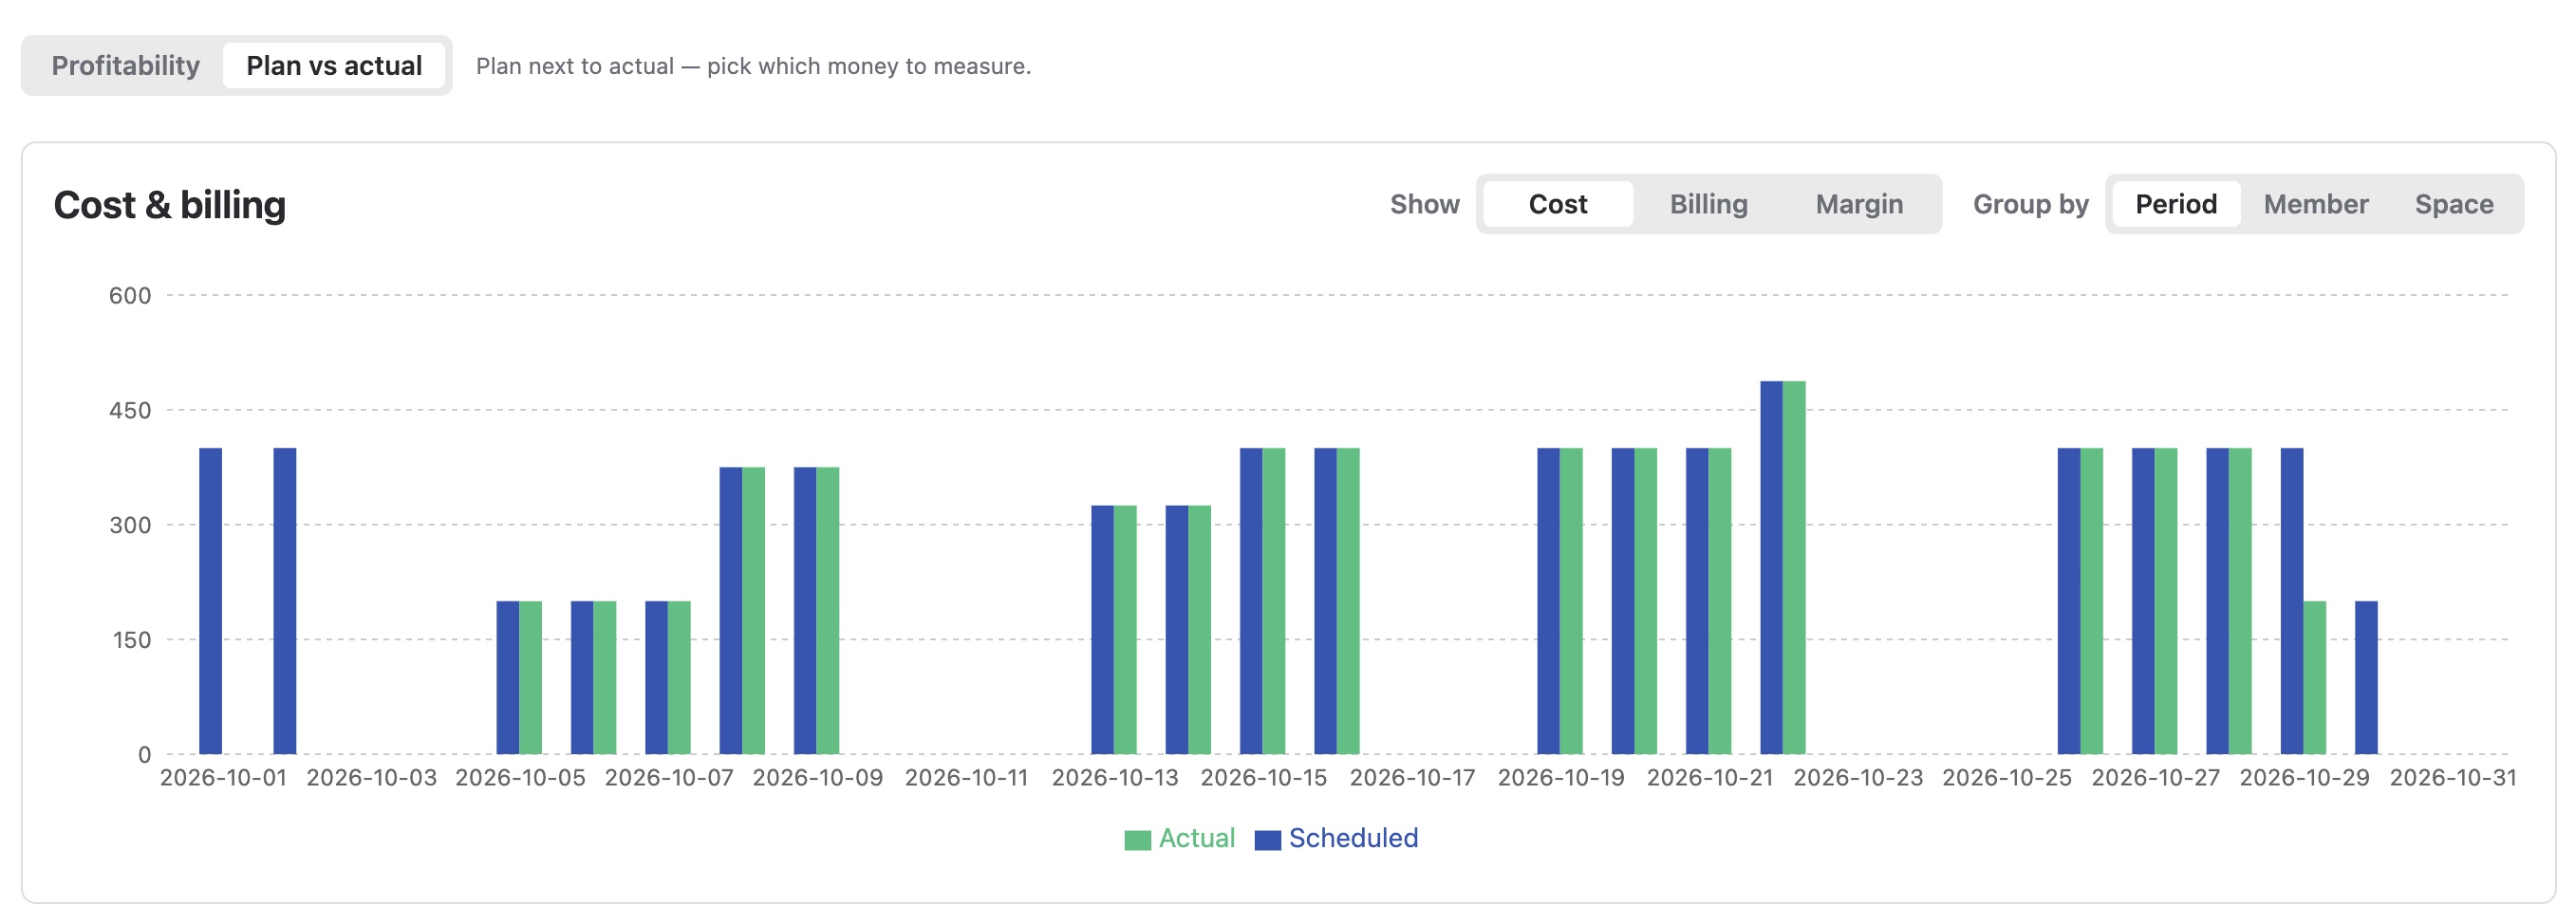
Use this chart to review whether cost, billing, or margin is performing as expected. You can switch between Cost, Billing, and Margin to focus on the financial metric you want to analyze.
You can group the chart by:
-
Period: Compare planned and actual values over time.
-
Member: Compare planned and actual values by team member.
-
Project: Compare planned and actual values by project.
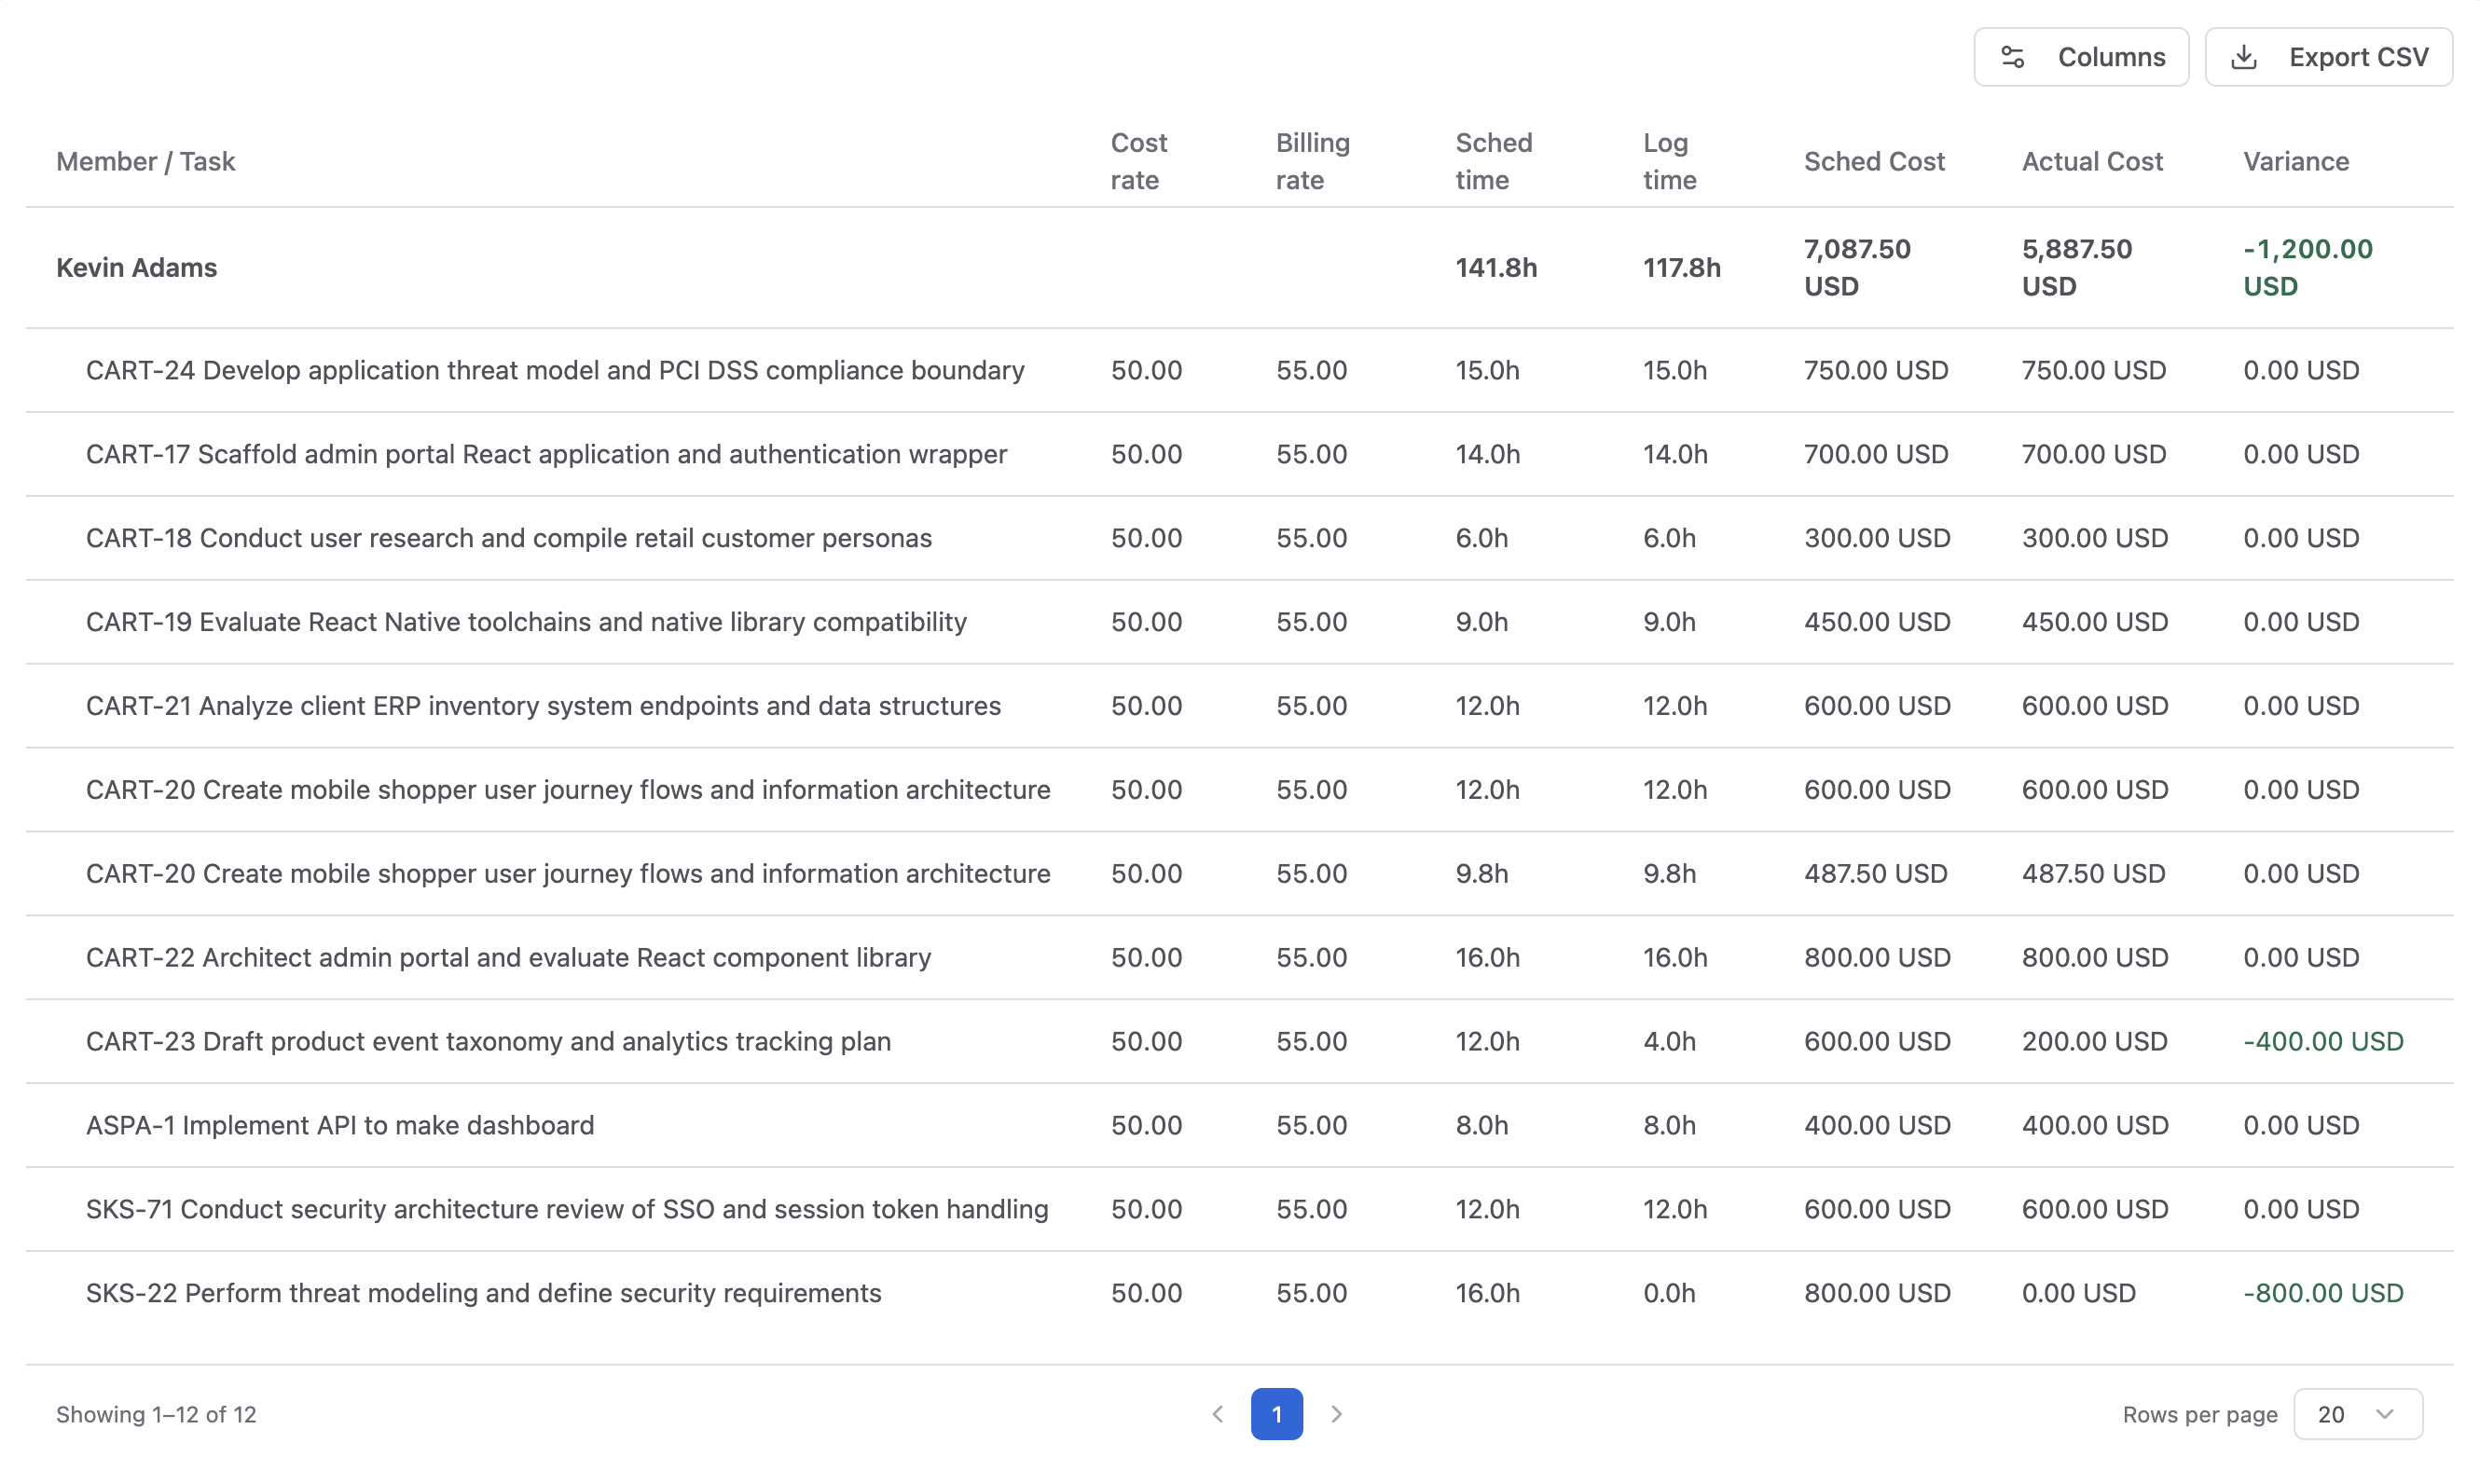
Table report
The table report provides a detailed flat view of cost and billing data for the selected filters.
|
Column |
Description |
|---|---|
|
Member / Task |
Shows the member and the related task with billing details from Schedules. |
|
Cost rate |
Shows the cost rate used to calculate internal cost. |
|
Billing rate |
Shows the billing rate used to calculate billable amount. |
|
Scheduled time |
Shows the planned billable time. |
|
Logged time |
Shows the actual logged billable time. |
|
Scheduled cost |
Shows the planned cost based on scheduled time and cost rate. |
|
Actual cost |
Shows the actual cost based on logged time and cost rate. |
|
Variance |
Shows the difference between planned and actual values. |
Adjust table columns
Click Select Column, then choose which columns to show or hide in the table.
Export the table to CSV
Click Export CSV to export the current table view as a CSV file for billing, financial review, or external reporting.
Share your report
Private reports can be shared with specific members or teams.
-
Open the report and click Share in the upper-right corner.
-
Search for the members or teams you want to add.
-
Click Save to apply the sharing settings.
To remove access, open the Share screen and click the Trash icon next to the member or team.
Only Private reports can be shared with selected members or teams.
Save report changes
After editing filters, chart settings, sharing settings, or table configuration, click Save changes to keep your updates.