
The Scheduled Time Report helps you review how planned time is allocated across tasks, events, members, and projects over a selected period.
Use it to understand scheduled workload, compare planned hours across teams, and organize planning data in a structured report.
Use this report when you want to analyze planned or scheduled hours. If you need to review actual time entries, use the Logged Time Report instead.
Create a scheduled time report
-
From the Reports screen, select the Scheduled time report type.
-
Enter the report details:
-
Name: Enter a report name, up to 255 characters.
-
Access: Choose whether the report is Public or Private.
-
-
Click Save to create the report and open the report details screen.
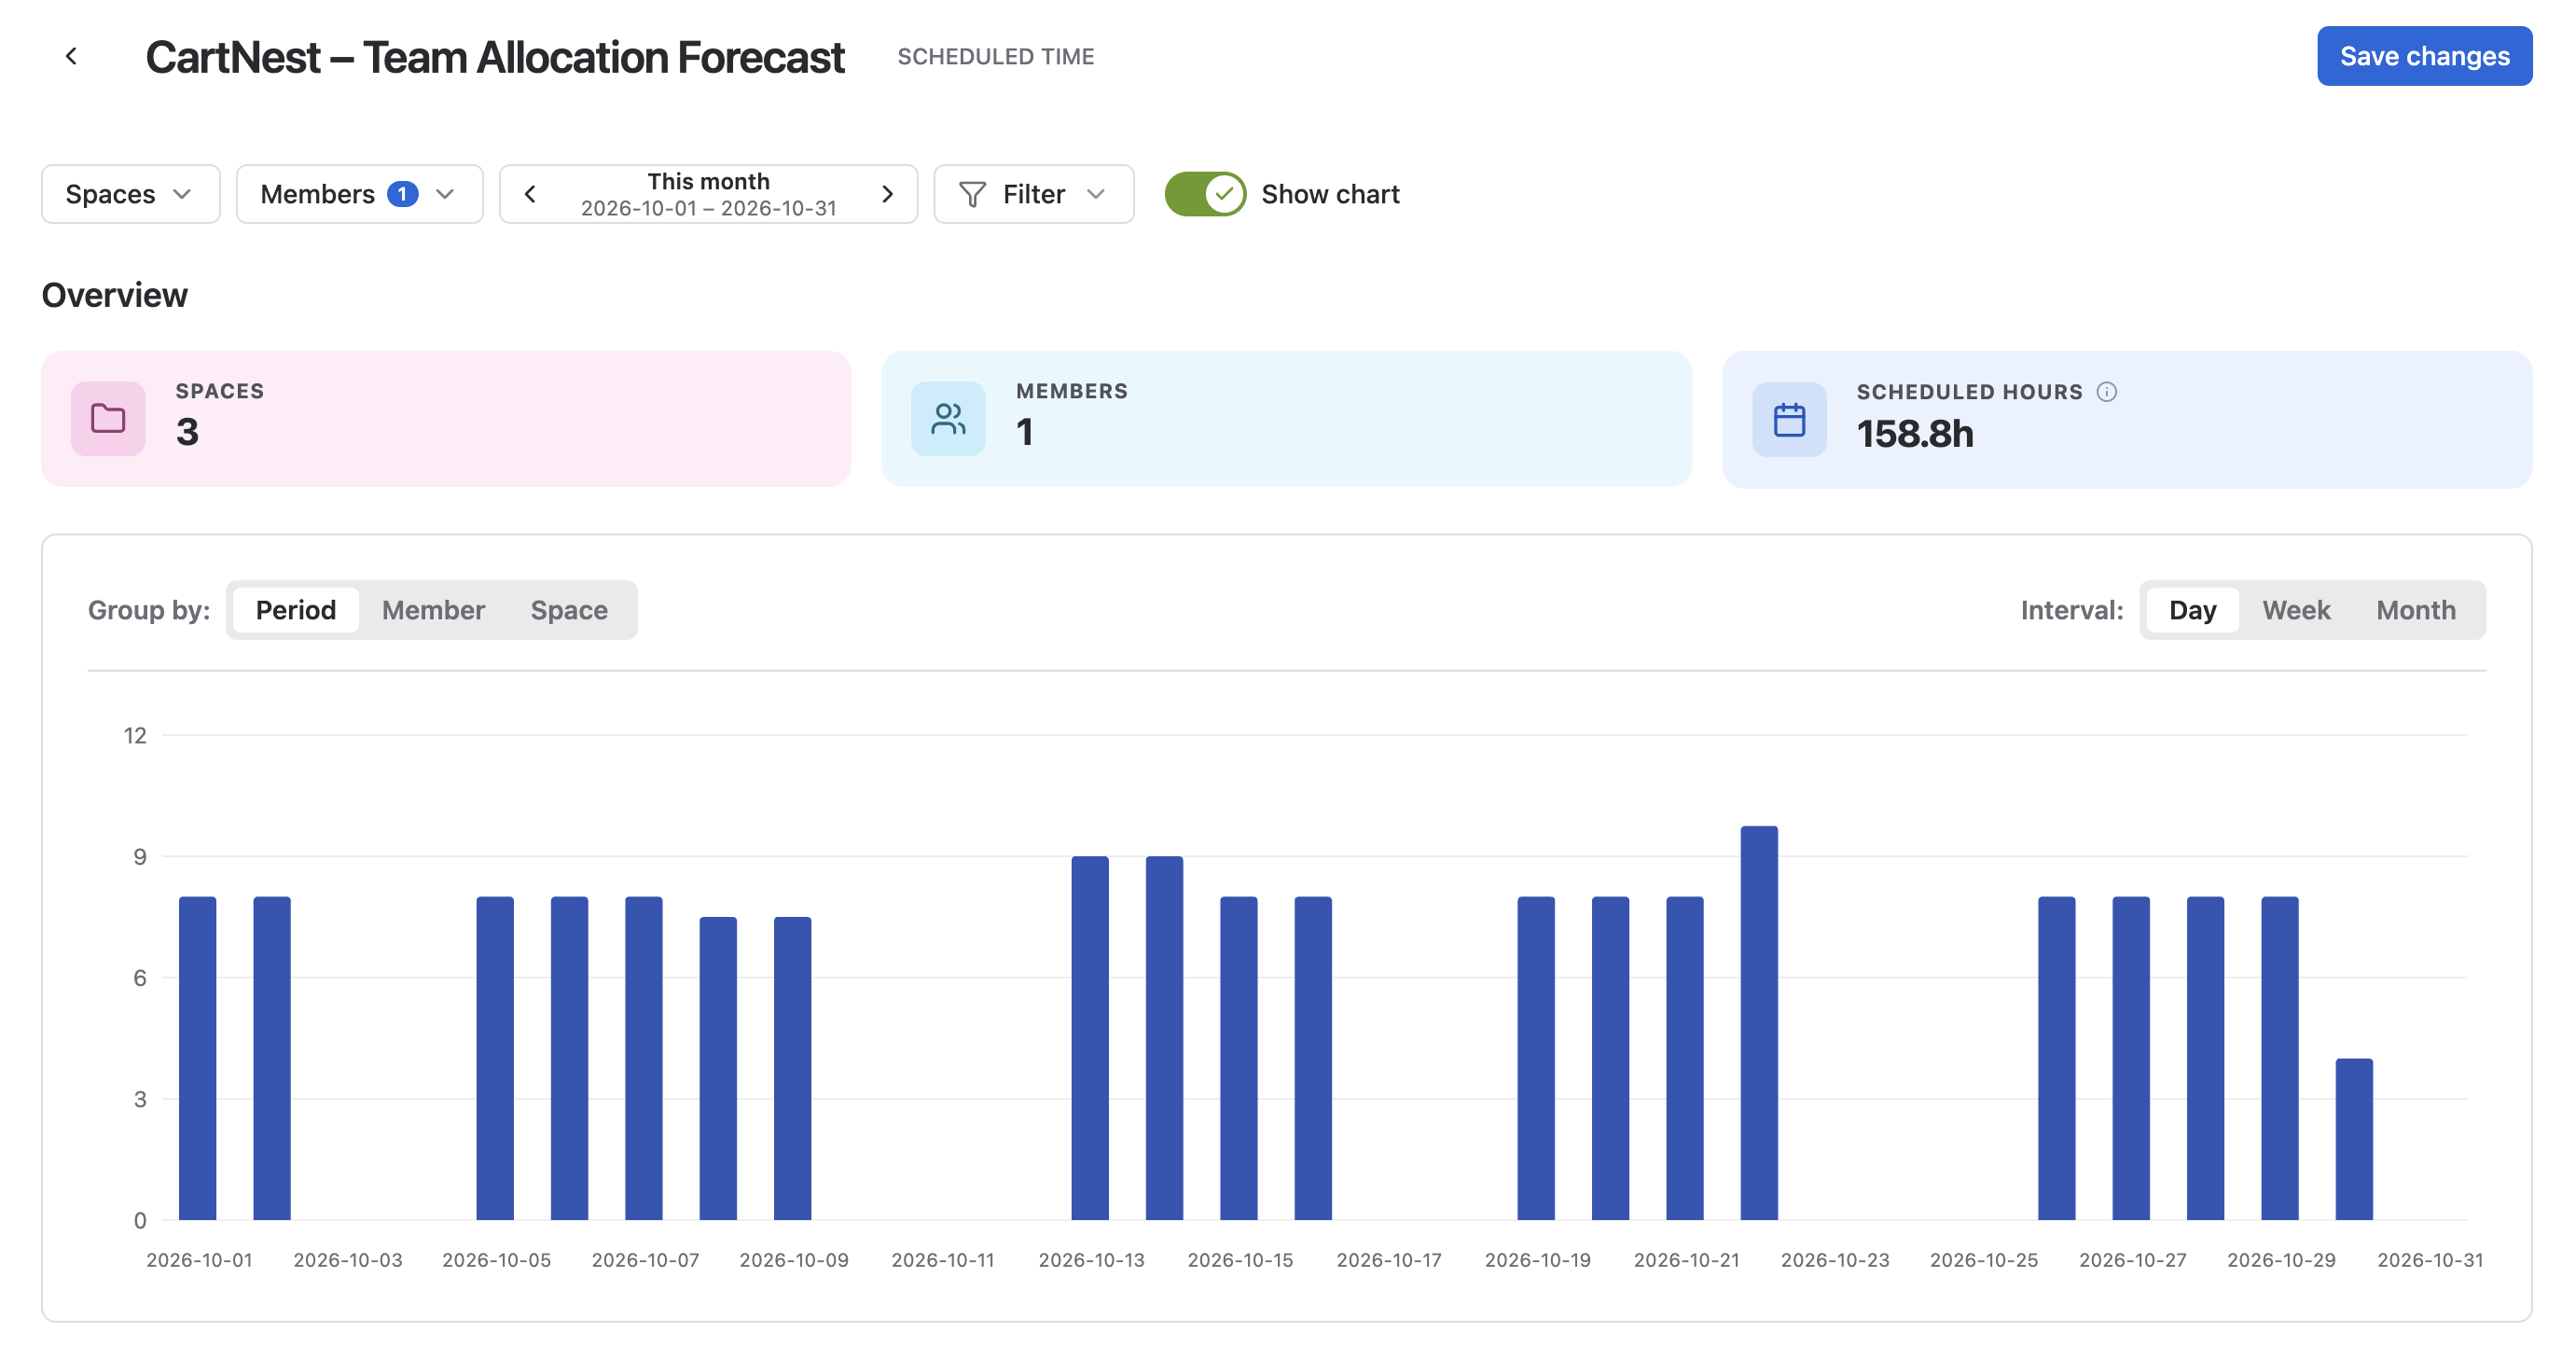
Set report filters
Use filters to define which scheduled time data appears in the report.
|
Filter |
Description |
|---|---|
|
Spaces |
Select one or more spaces to include in the report. |
|
Members or Teams |
Choose the individual members or teams whose scheduled time you want to analyze. |
|
Time Range |
Define the reporting period. Use Dynamic Range for rolling periods, such as This Week or Last 30 Days. Use Fixed Range to select a specific start and end date. |
|
Filters |
Filter the report by additional fields, such as role, skill, sprint, work type, status, or priority. |
|
Show chart |
Turn this on to display a chart above the table report. |
Report overview
The overview shows key totals based on the filters you selected.

|
Metric |
Description |
|---|---|
|
Spaces |
The number of projects included in the report. |
|
Members |
The number of members included in the report. |
|
Scheduled hours |
The total planned hours from scheduled tasks and events. |
Report chart
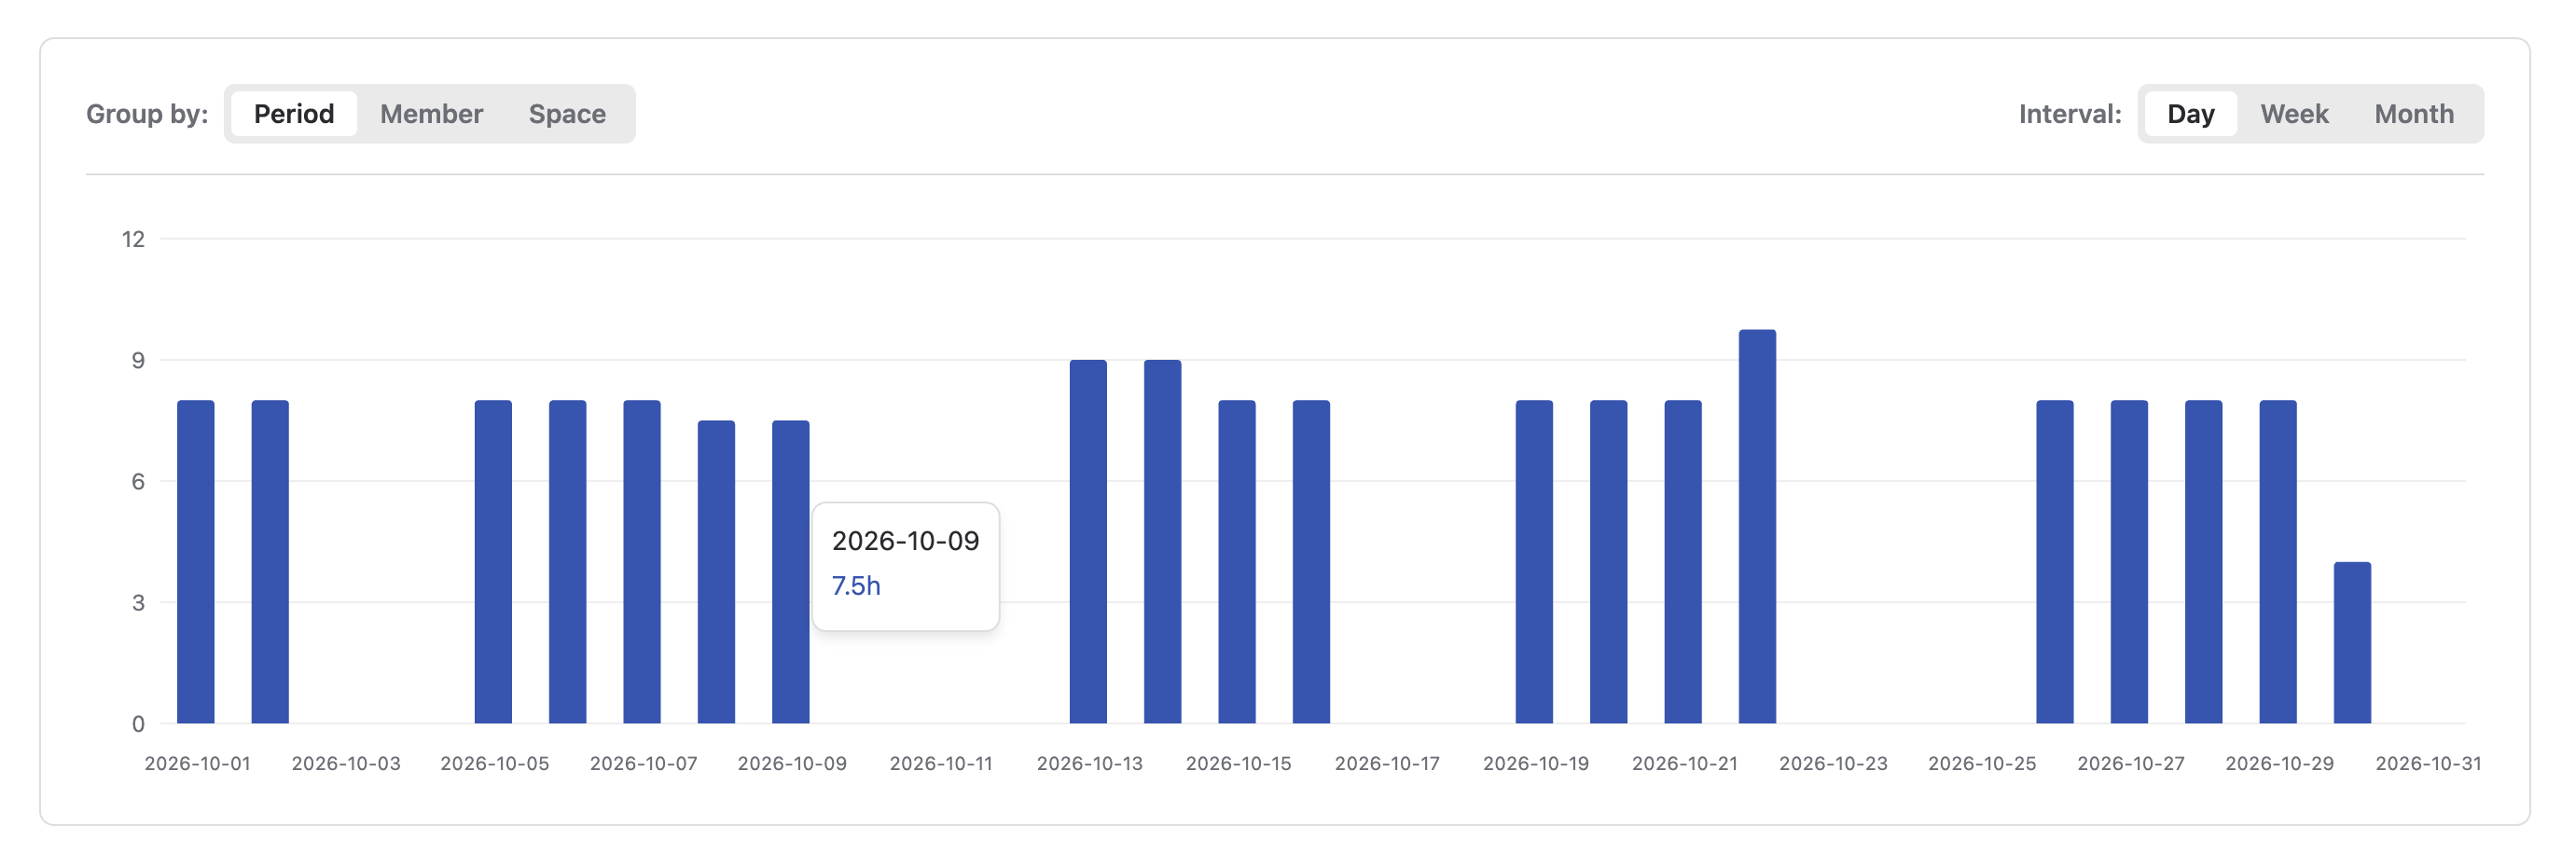
The chart provides a visual breakdown of scheduled time. You can change how the chart is grouped by using the Group by options.
|
Group by |
Description |
|---|---|
|
Period |
View scheduled time by day, week, or month. |
|
Member |
View scheduled time by member. |
|
Space |
View scheduled time by project. |
You can hide the chart by turning off the Show chart option in the filter settings.
Table report
The table report uses a hierarchy view to help you explore scheduled time in more detail.
You can group the table by Member, Space, and Task. The table displays scheduled time and logged time for each grouping level, so you can compare planned work with actual time recorded.
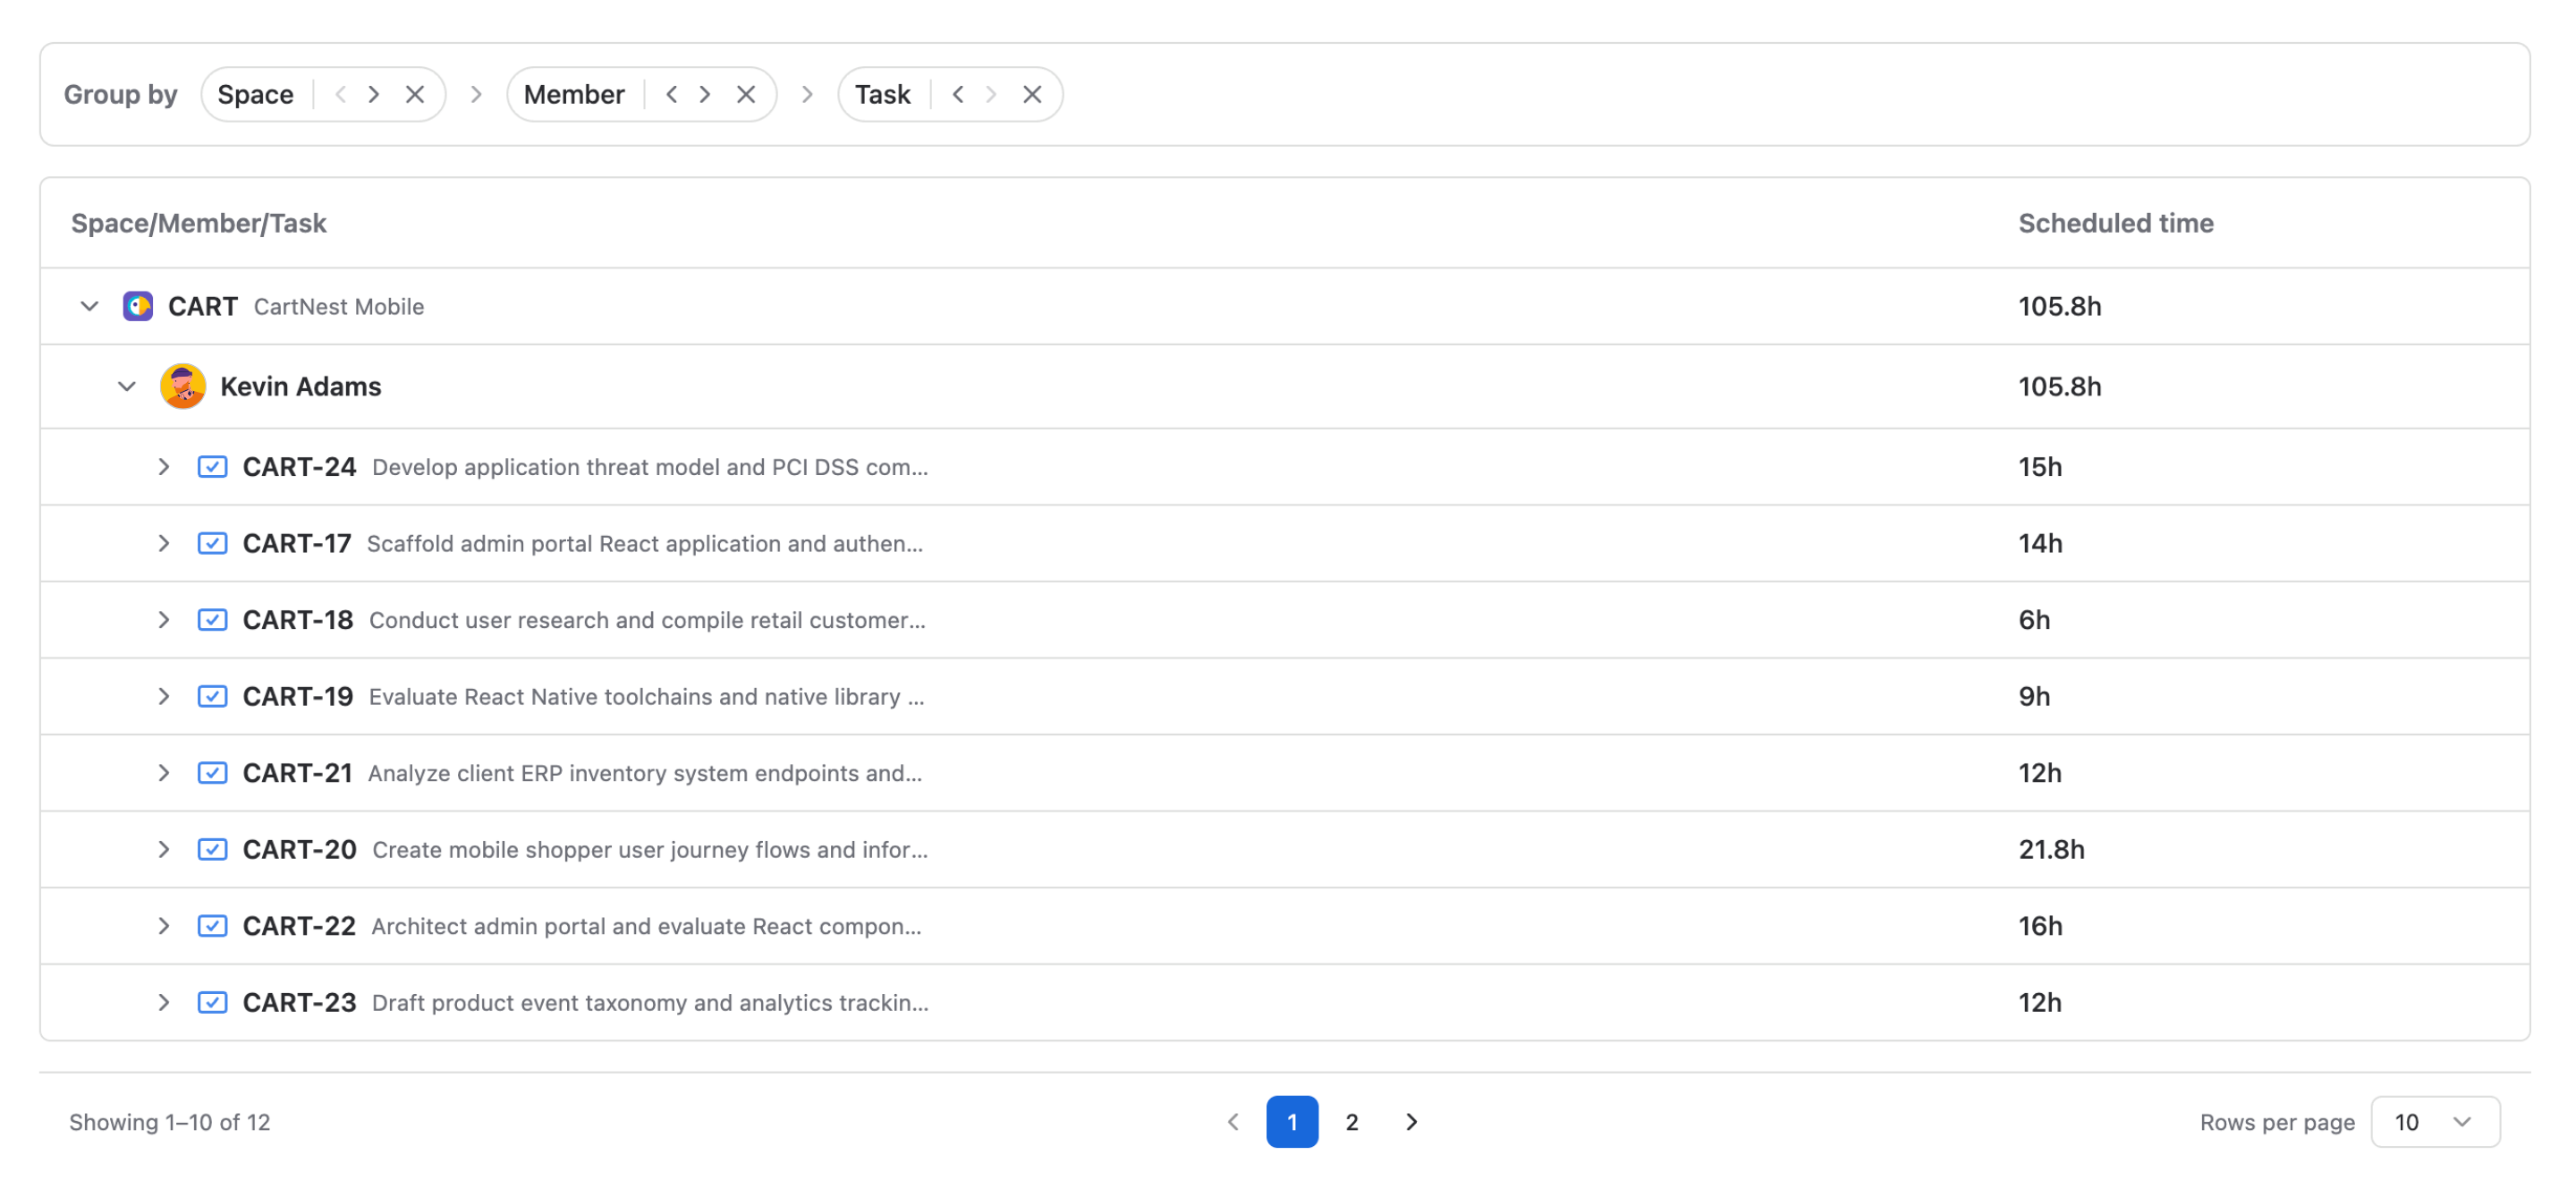
To expand a group and view its details, click the down arrow icon next to the group name.
Arrange the hierarchy structure
The grouping order controls the hierarchy of the table. The leftmost group has the highest hierarchy level, and the rightmost group has the lowest hierarchy level.
Use the navigation buttons on each group to change its position:
-
Increase hierarchy: Click the < icon to move the group left.
-
Decrease hierarchy: Click the > icon to move the group right.
Add or remove a grouping aspect
-
To remove a grouping aspect, click the X icon on that aspect.
-
To add a grouping aspect, click Add grouping, then select an option from the dropdown.
If all available groups are already added, the Add grouping button is hidden.
Share your report
You can share a private report with specific members or teams.
-
Open the private report you want to share.
-
Click Share in the upper-right corner.
-
Search for members or teams, then add them to the report.
-
Click Save.
To remove access, open the Share screen and click the Trash icon next to the member or team.
Only Private reports can be shared with selected members or teams.
Save report changes
After editing the report, click Save changes to keep your updates.