.png)
This page guides you through exploring, organizing, and exporting report data in a structured table format. You can customize how data is displayed, grouped, and filtered to match your analysis needs.
View Options
You can choose how report data is displayed using two view modes:
Flat View
Flat View displays report data in a simple, single-level table where each work item appears as an individual row without grouping or hierarchy.
In this view, Tasks, Groups, or Members are listed in a straightforward format, making it easy to scan, sort, and compare values across key fields such as Scheduled, Logged, Utilization, Time Remaining, Remaining Effort, and Original Estimate.
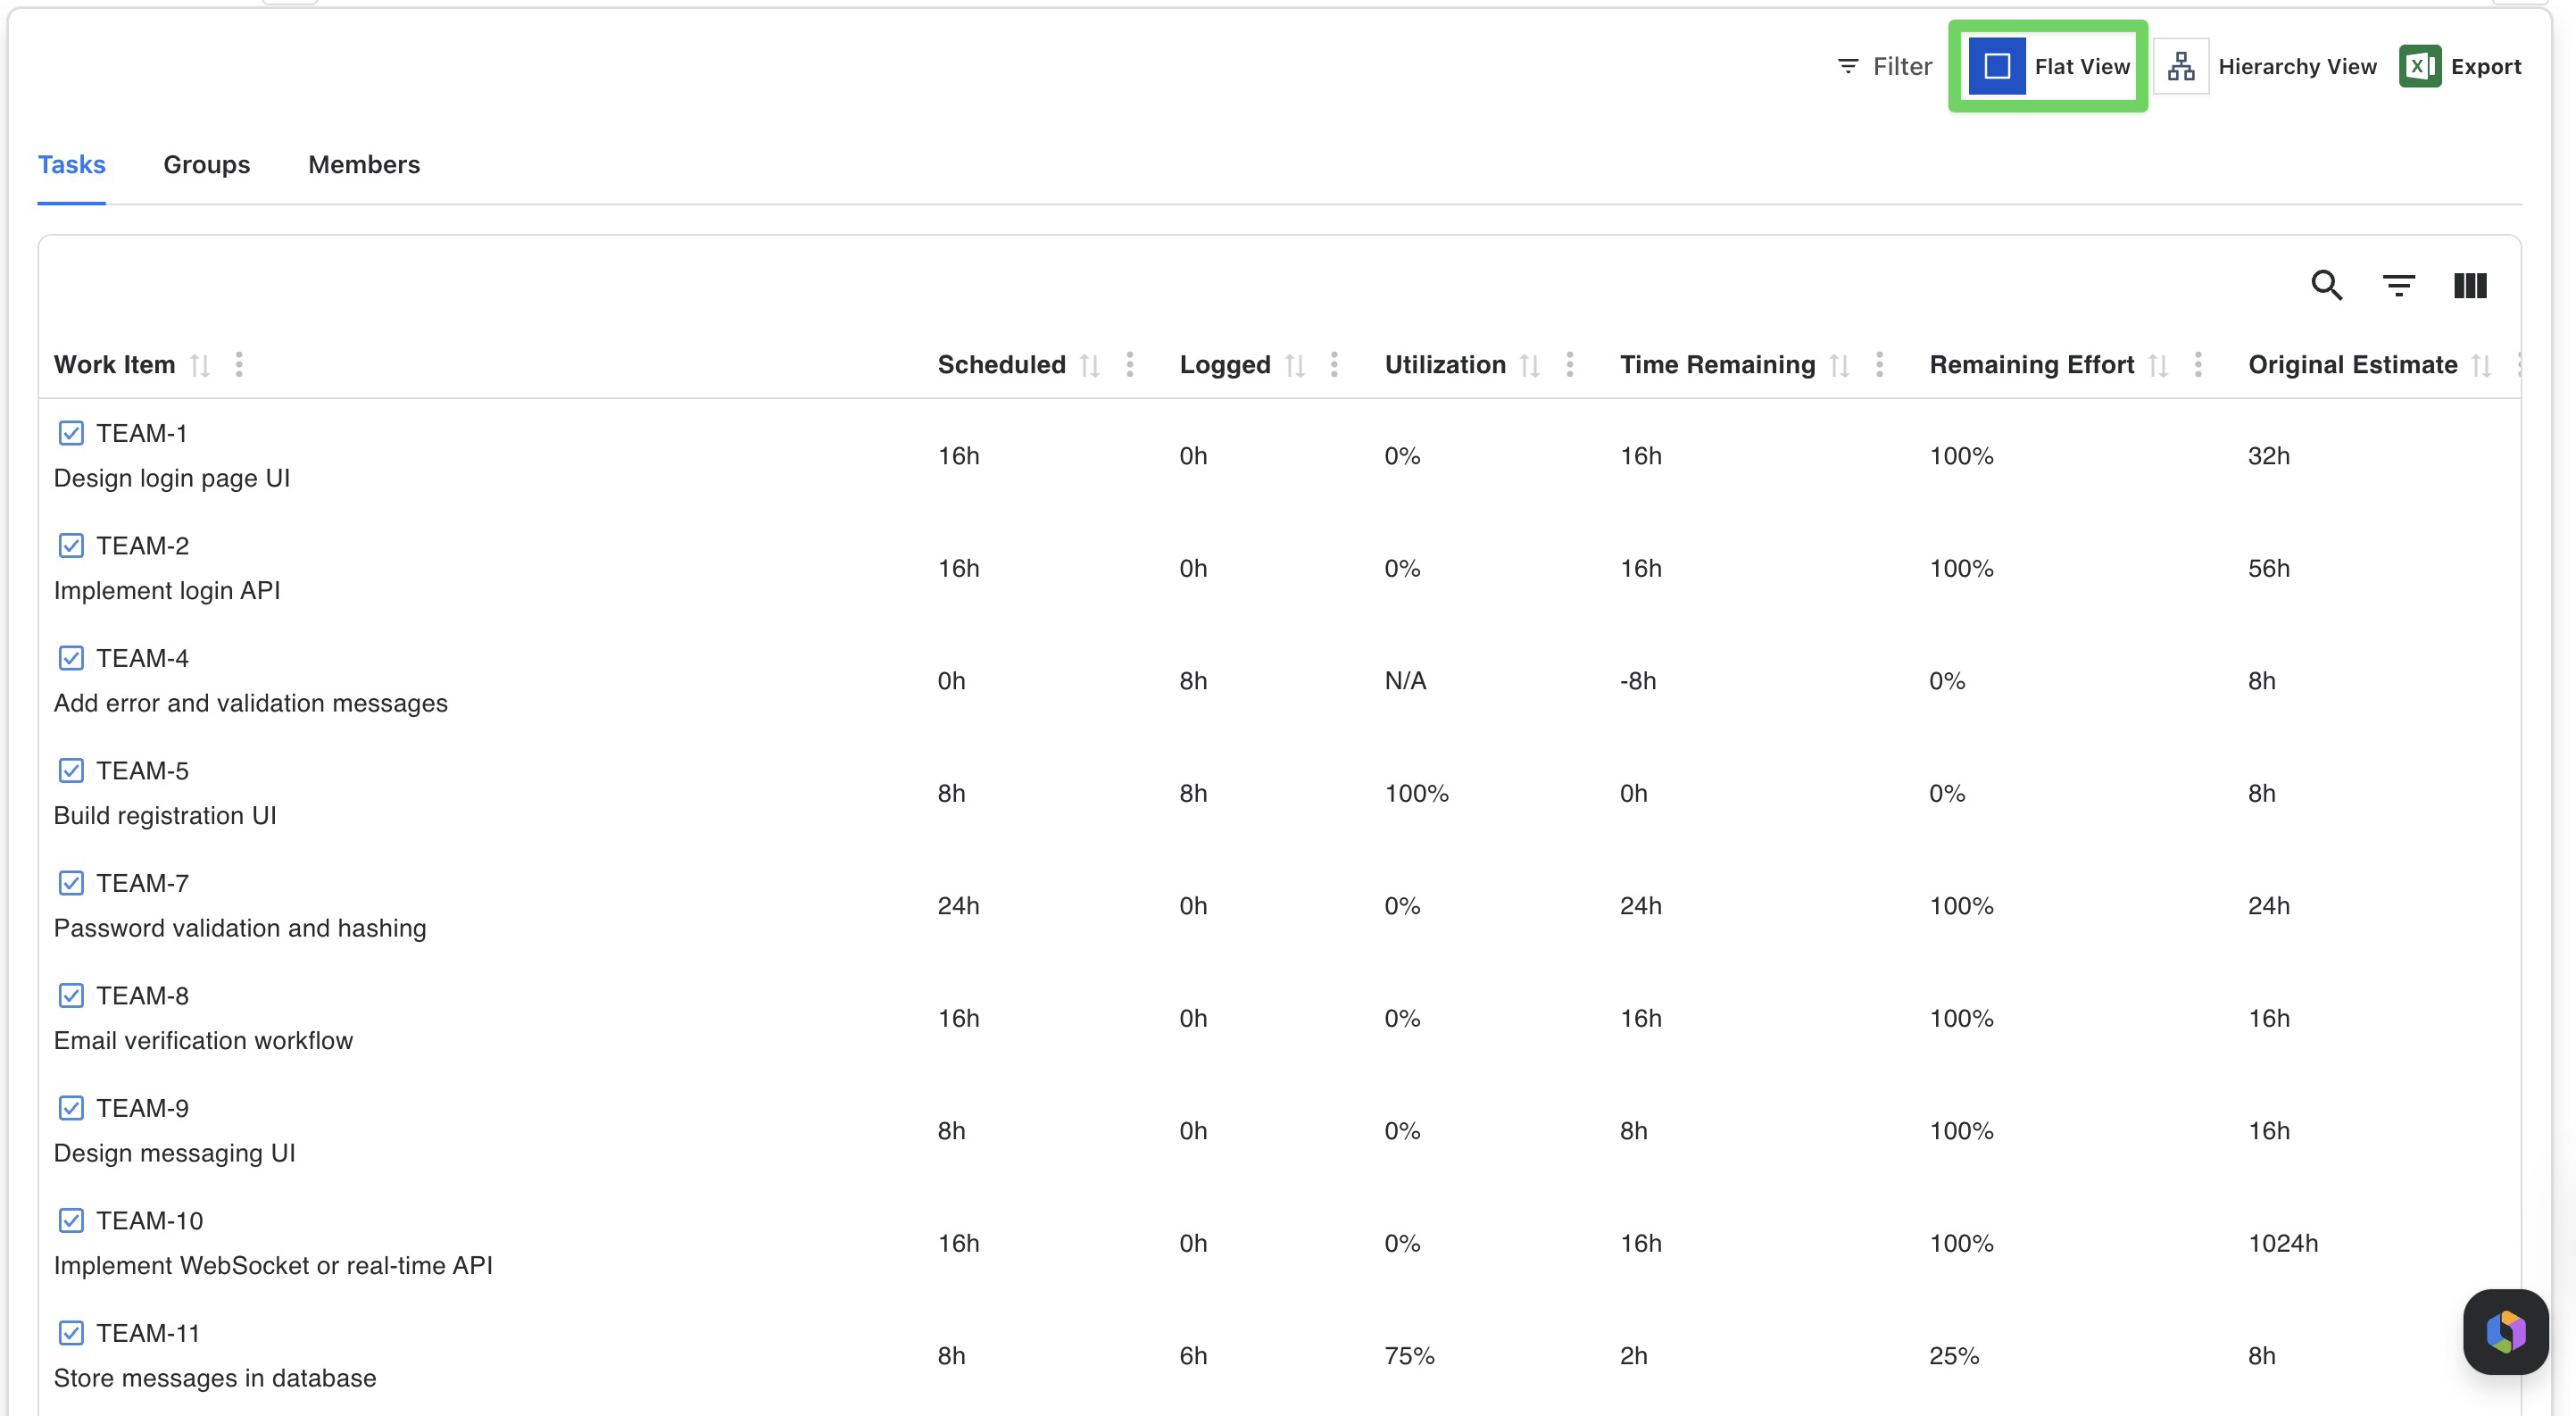
You can switch between report types depending on the level of analysis you need:
-
Tasks – Displays detailed information for individual tasks assigned to team members
-
Groups – Shows aggregated data at the group or team level
-
Members – Provides a summary of workload and performance metrics for each team member
Hierarchy View
Hierarchy View displays report data in a multi-level structure, allowing you to group information into nested levels such as: (Project → Assignee → Task).
You can expand or collapse each level to focus on specific sections of the data while maintaining an aggregated overview at higher levels.
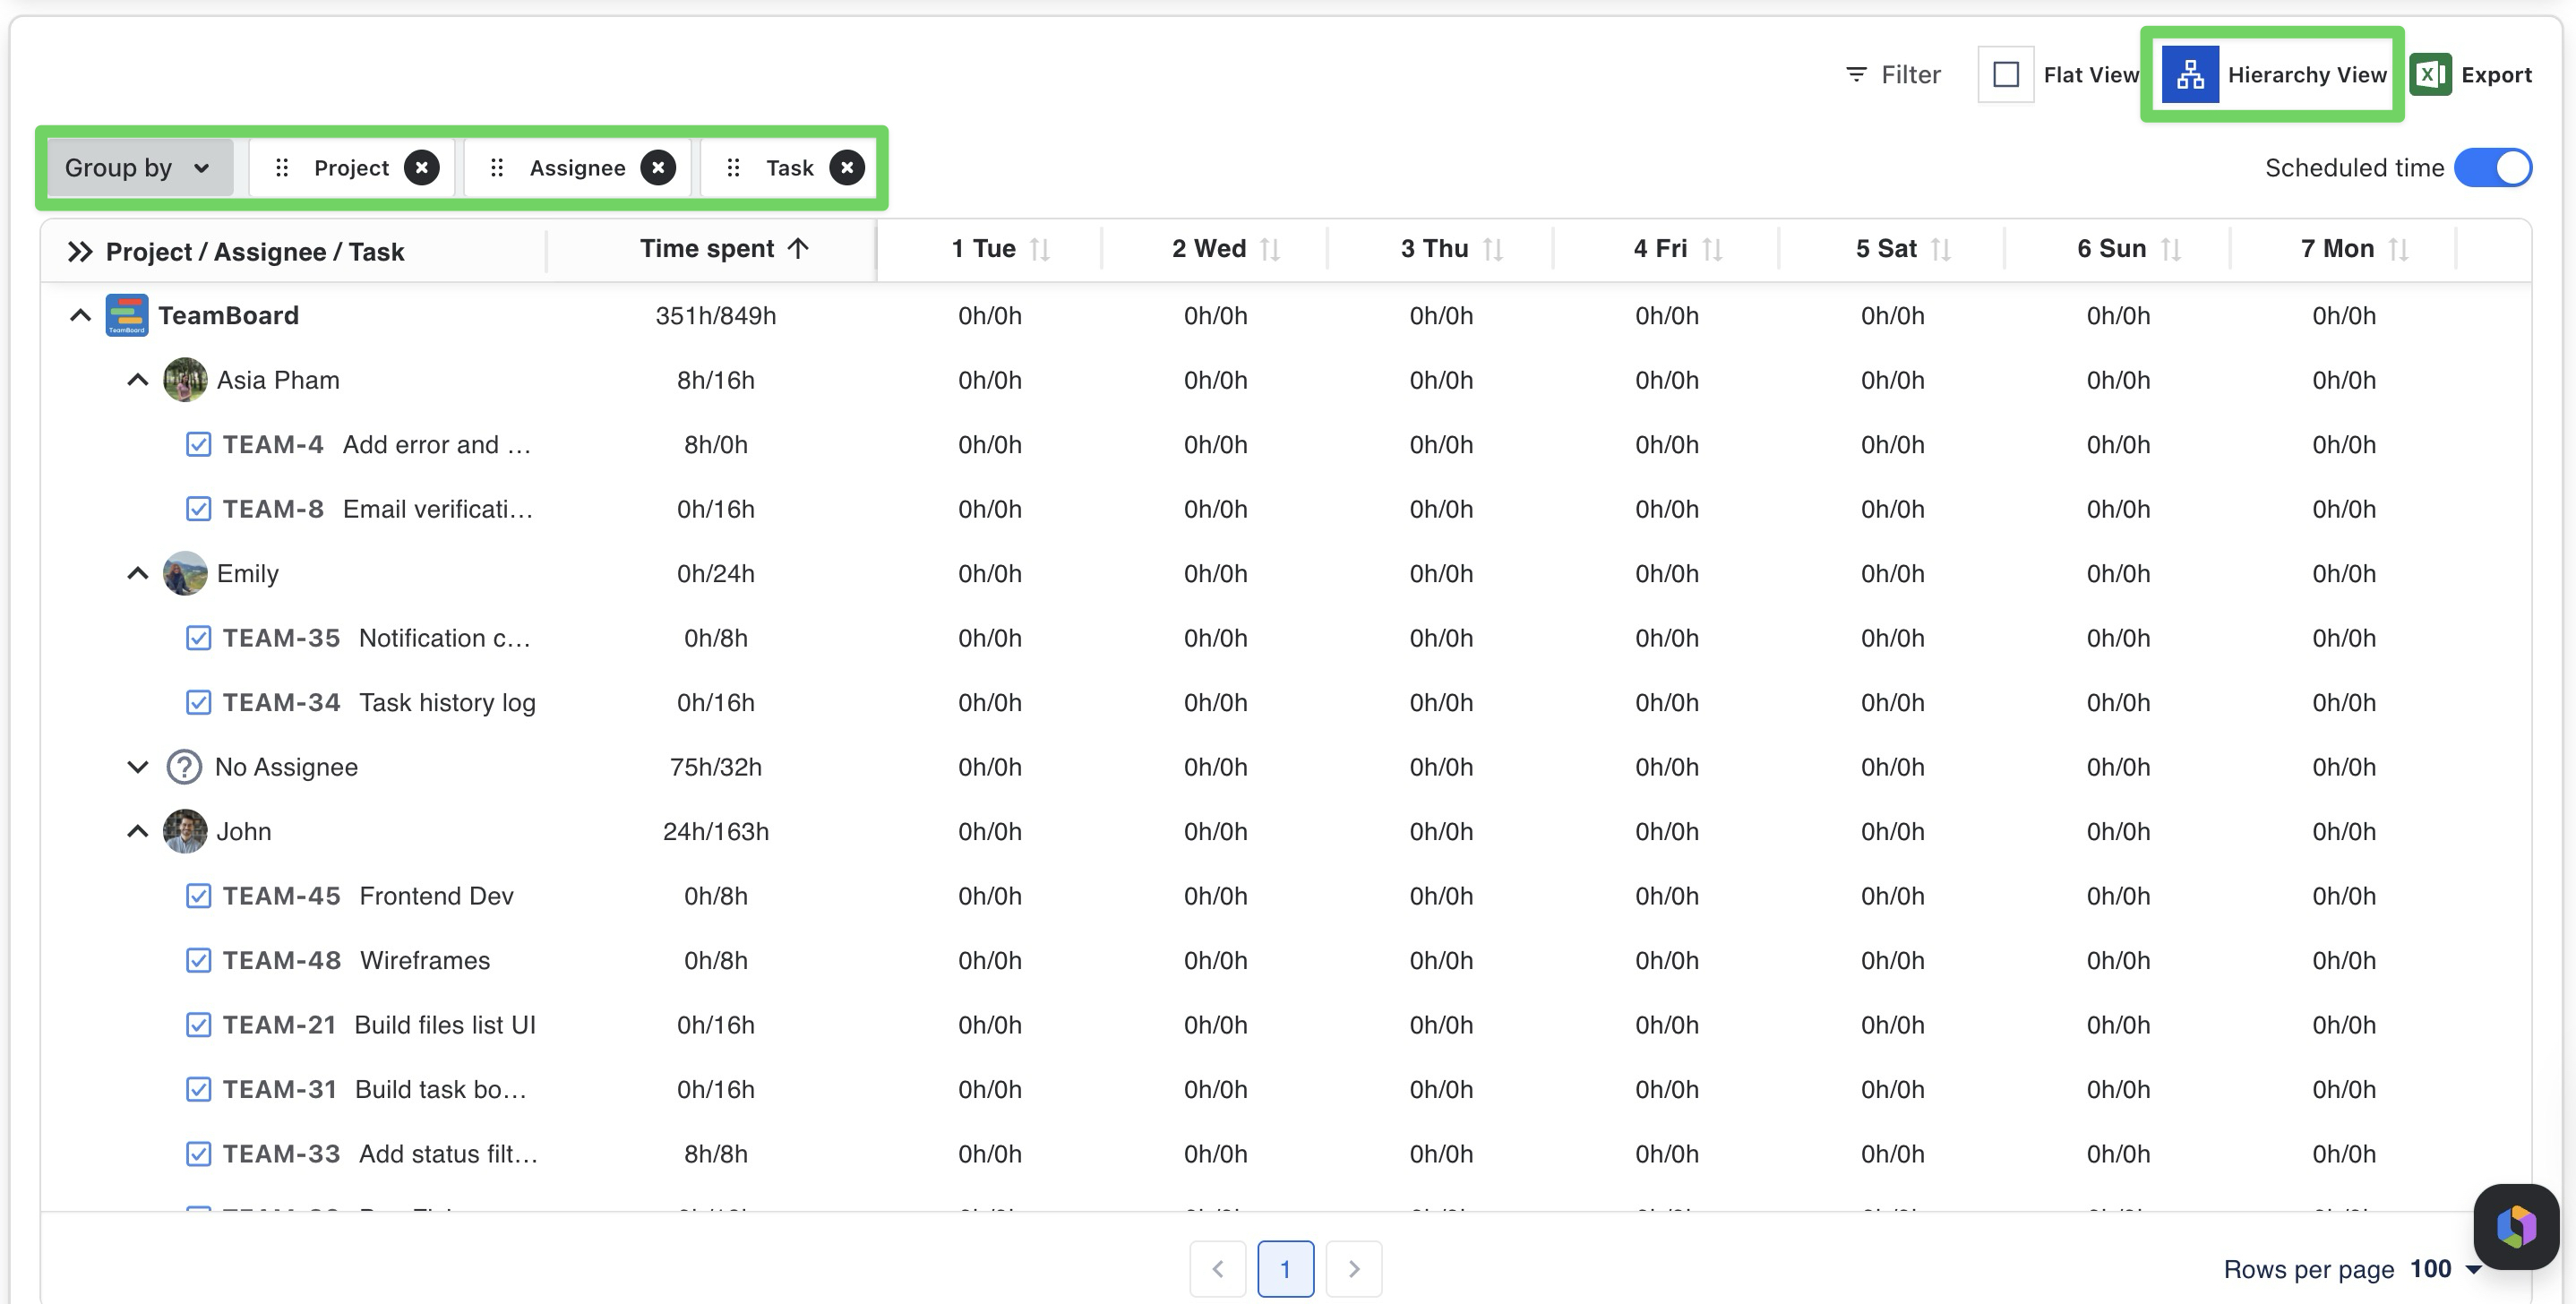
The "Scheduled Time" toggle lets you view planned versus actual times for tasks.
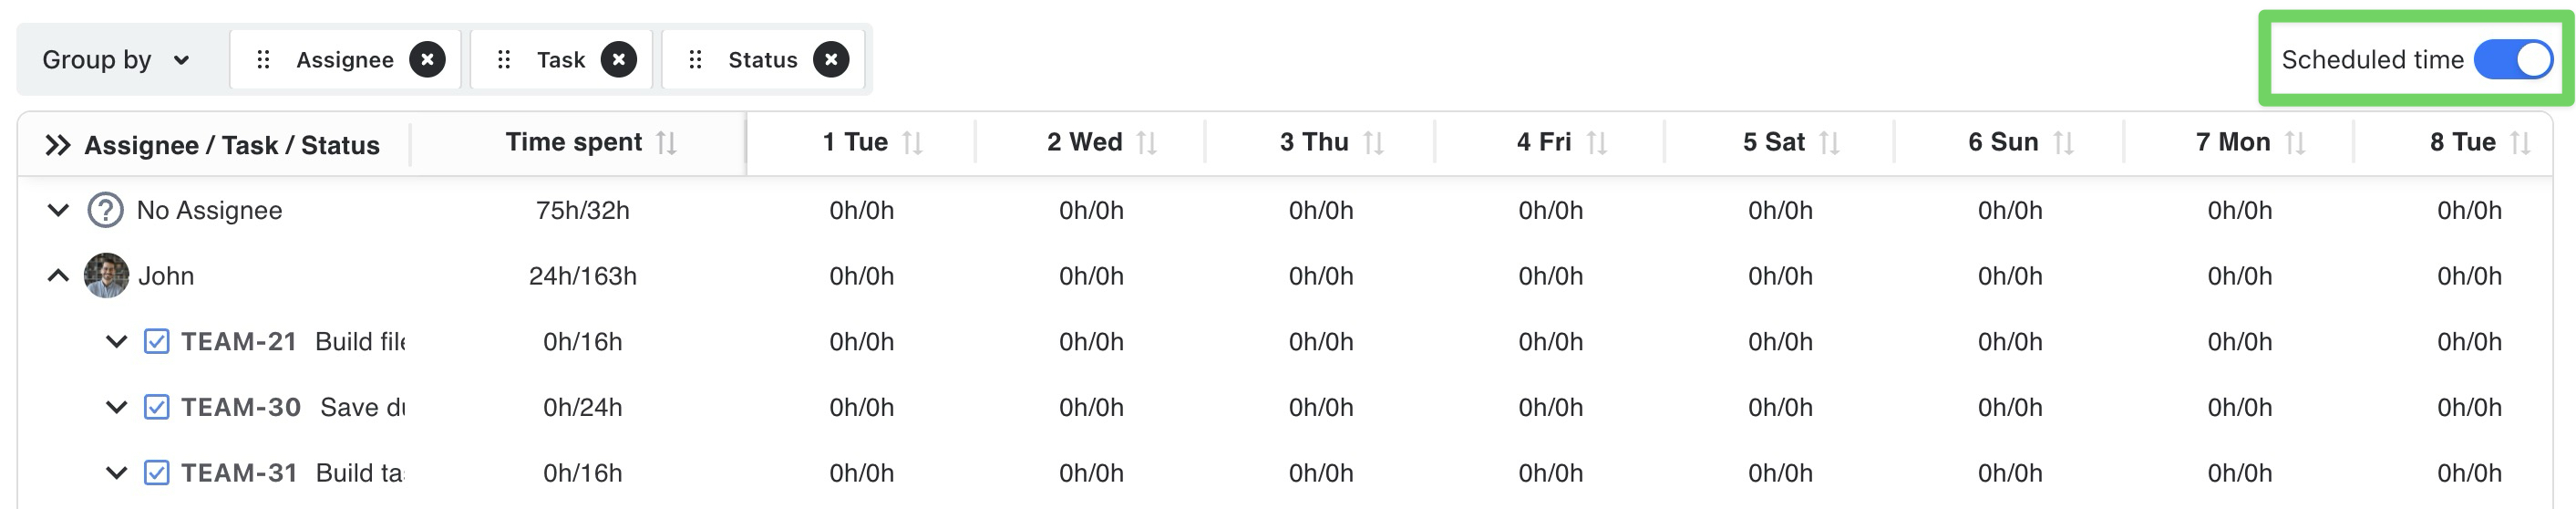
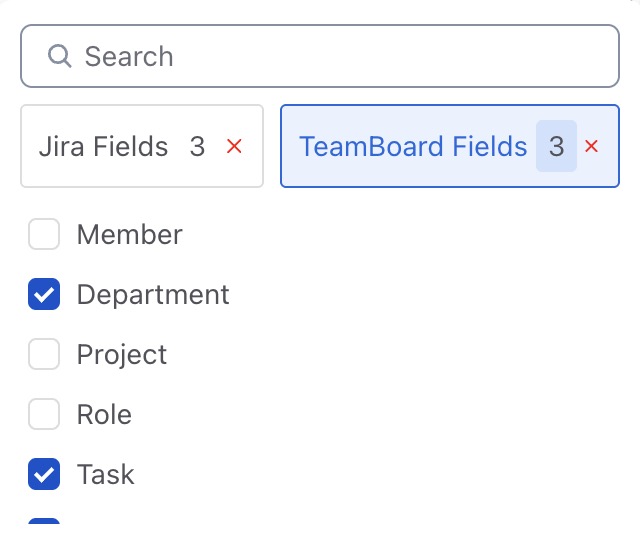
Grouping Data
You can organize report data using Group By fields. Multiple fields can be applied simultaneously to create multi-level hierarchies.
TeamBoard supports grouping by additional Jira custom fields and TeamBoard fields, making it easier to organize and analyze data.
JIRA FIELDS
Assignee
Components
Epic
Fix Versions
Work Type
Labels
Priority
Project Category
Reporter
Status
Sub-task
Jira Task
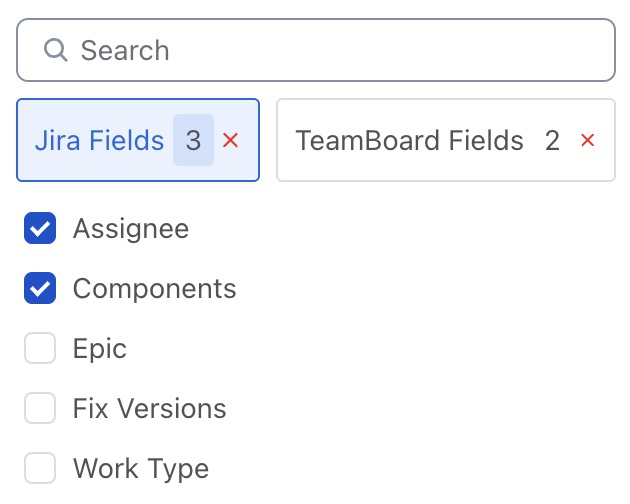
TEAMBOARD FIELDS
Member
Department
Project
Role
Task
Team
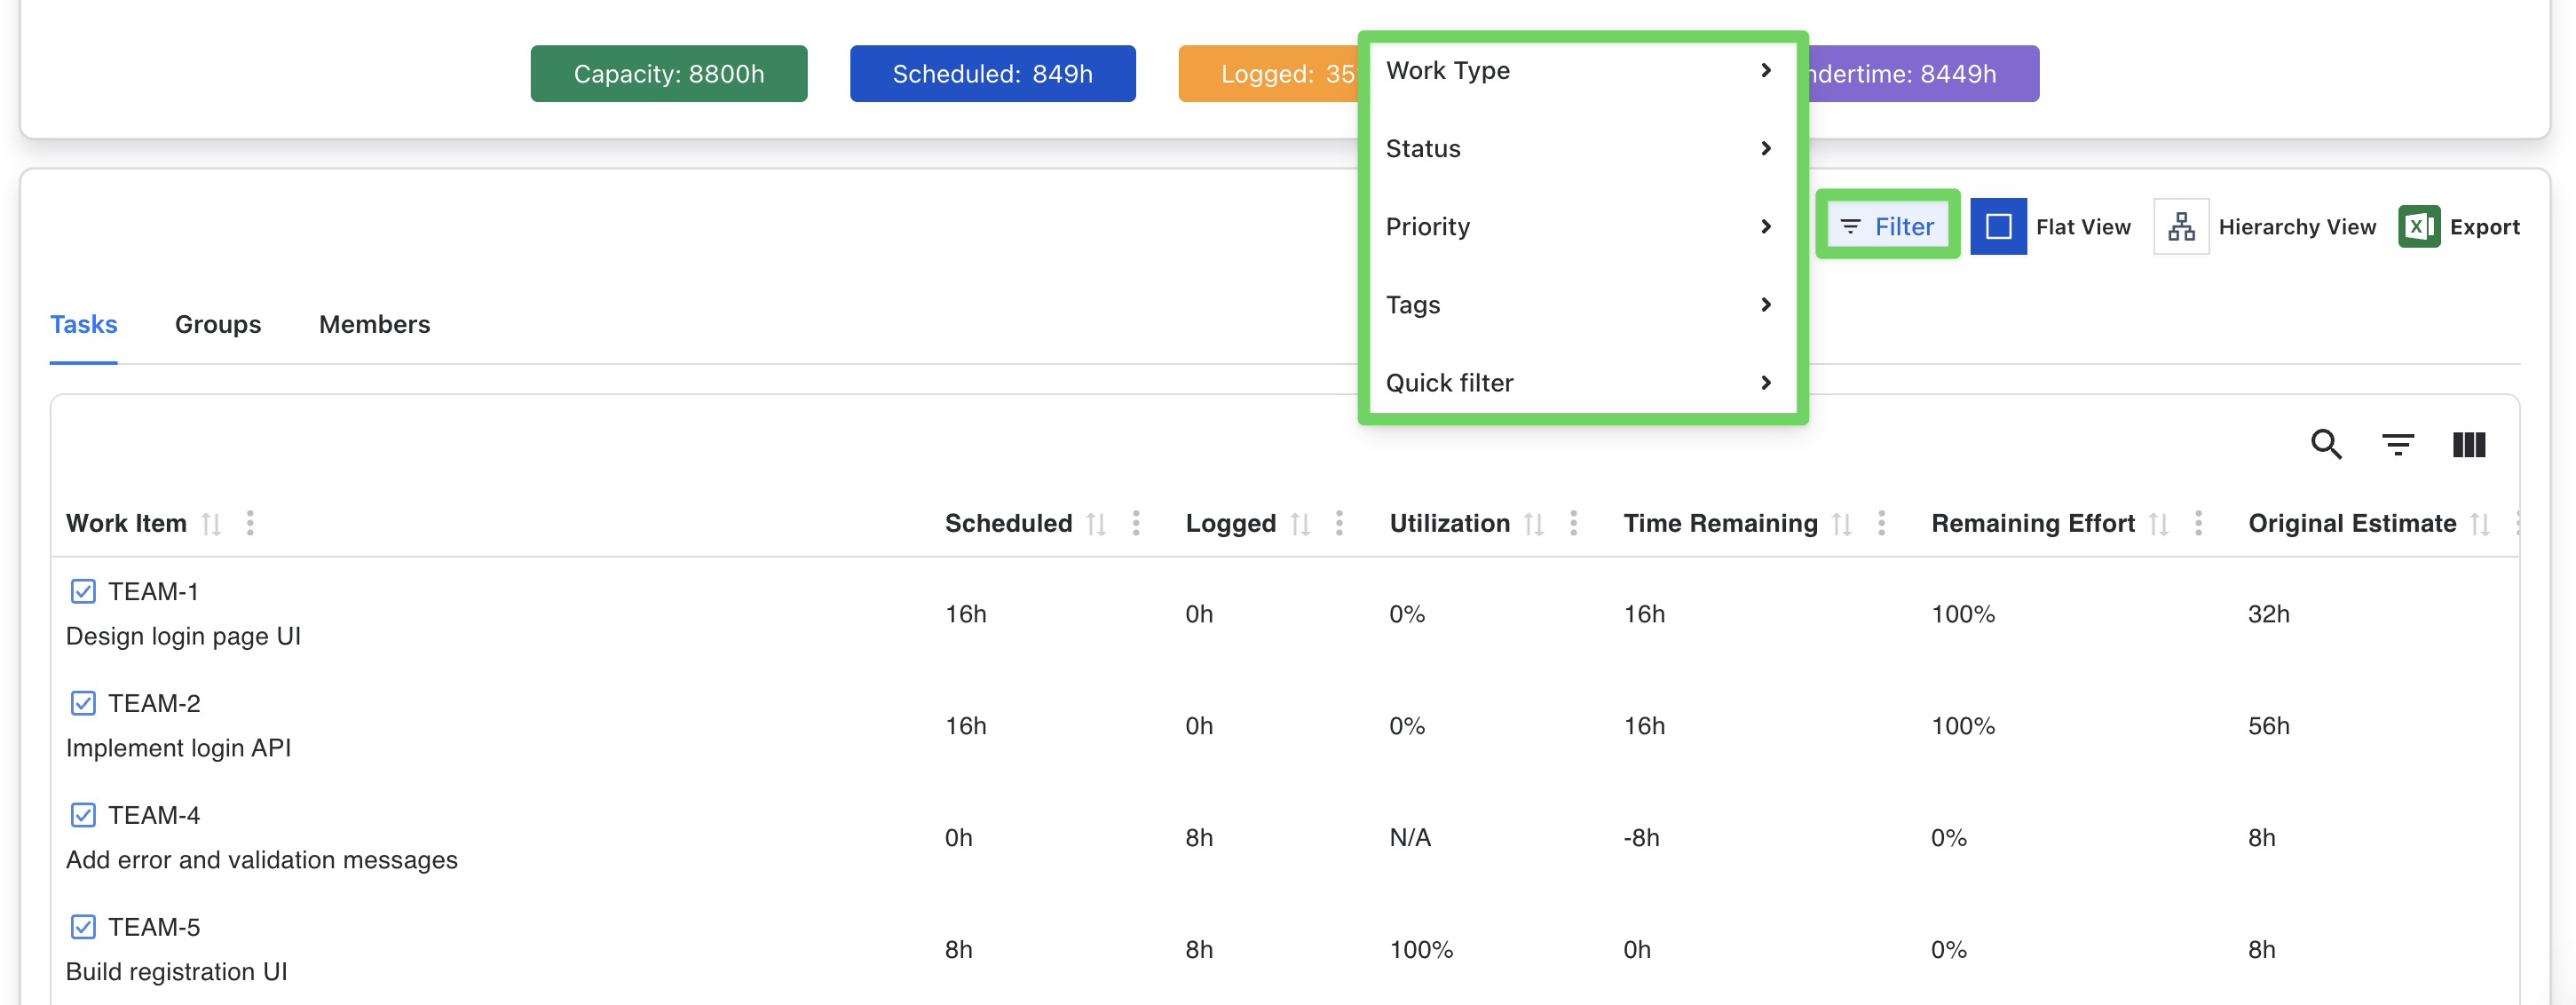
Filtering Report Data
Filters allow you to narrow down the report to display only the work items that match specific criteria. This helps you focus on relevant data and avoid unnecessary clutter when analyzing large datasets.
To apply filters:
-
Click the Filter button in the top toolbar.
-
Select one or more filter categories from the dropdown menu.
-
Choose the values you want to include in the report.
Exporting Data
Table Report allows you to easily export your reports for further analysis or sharing with stakeholders. Use the ![]()
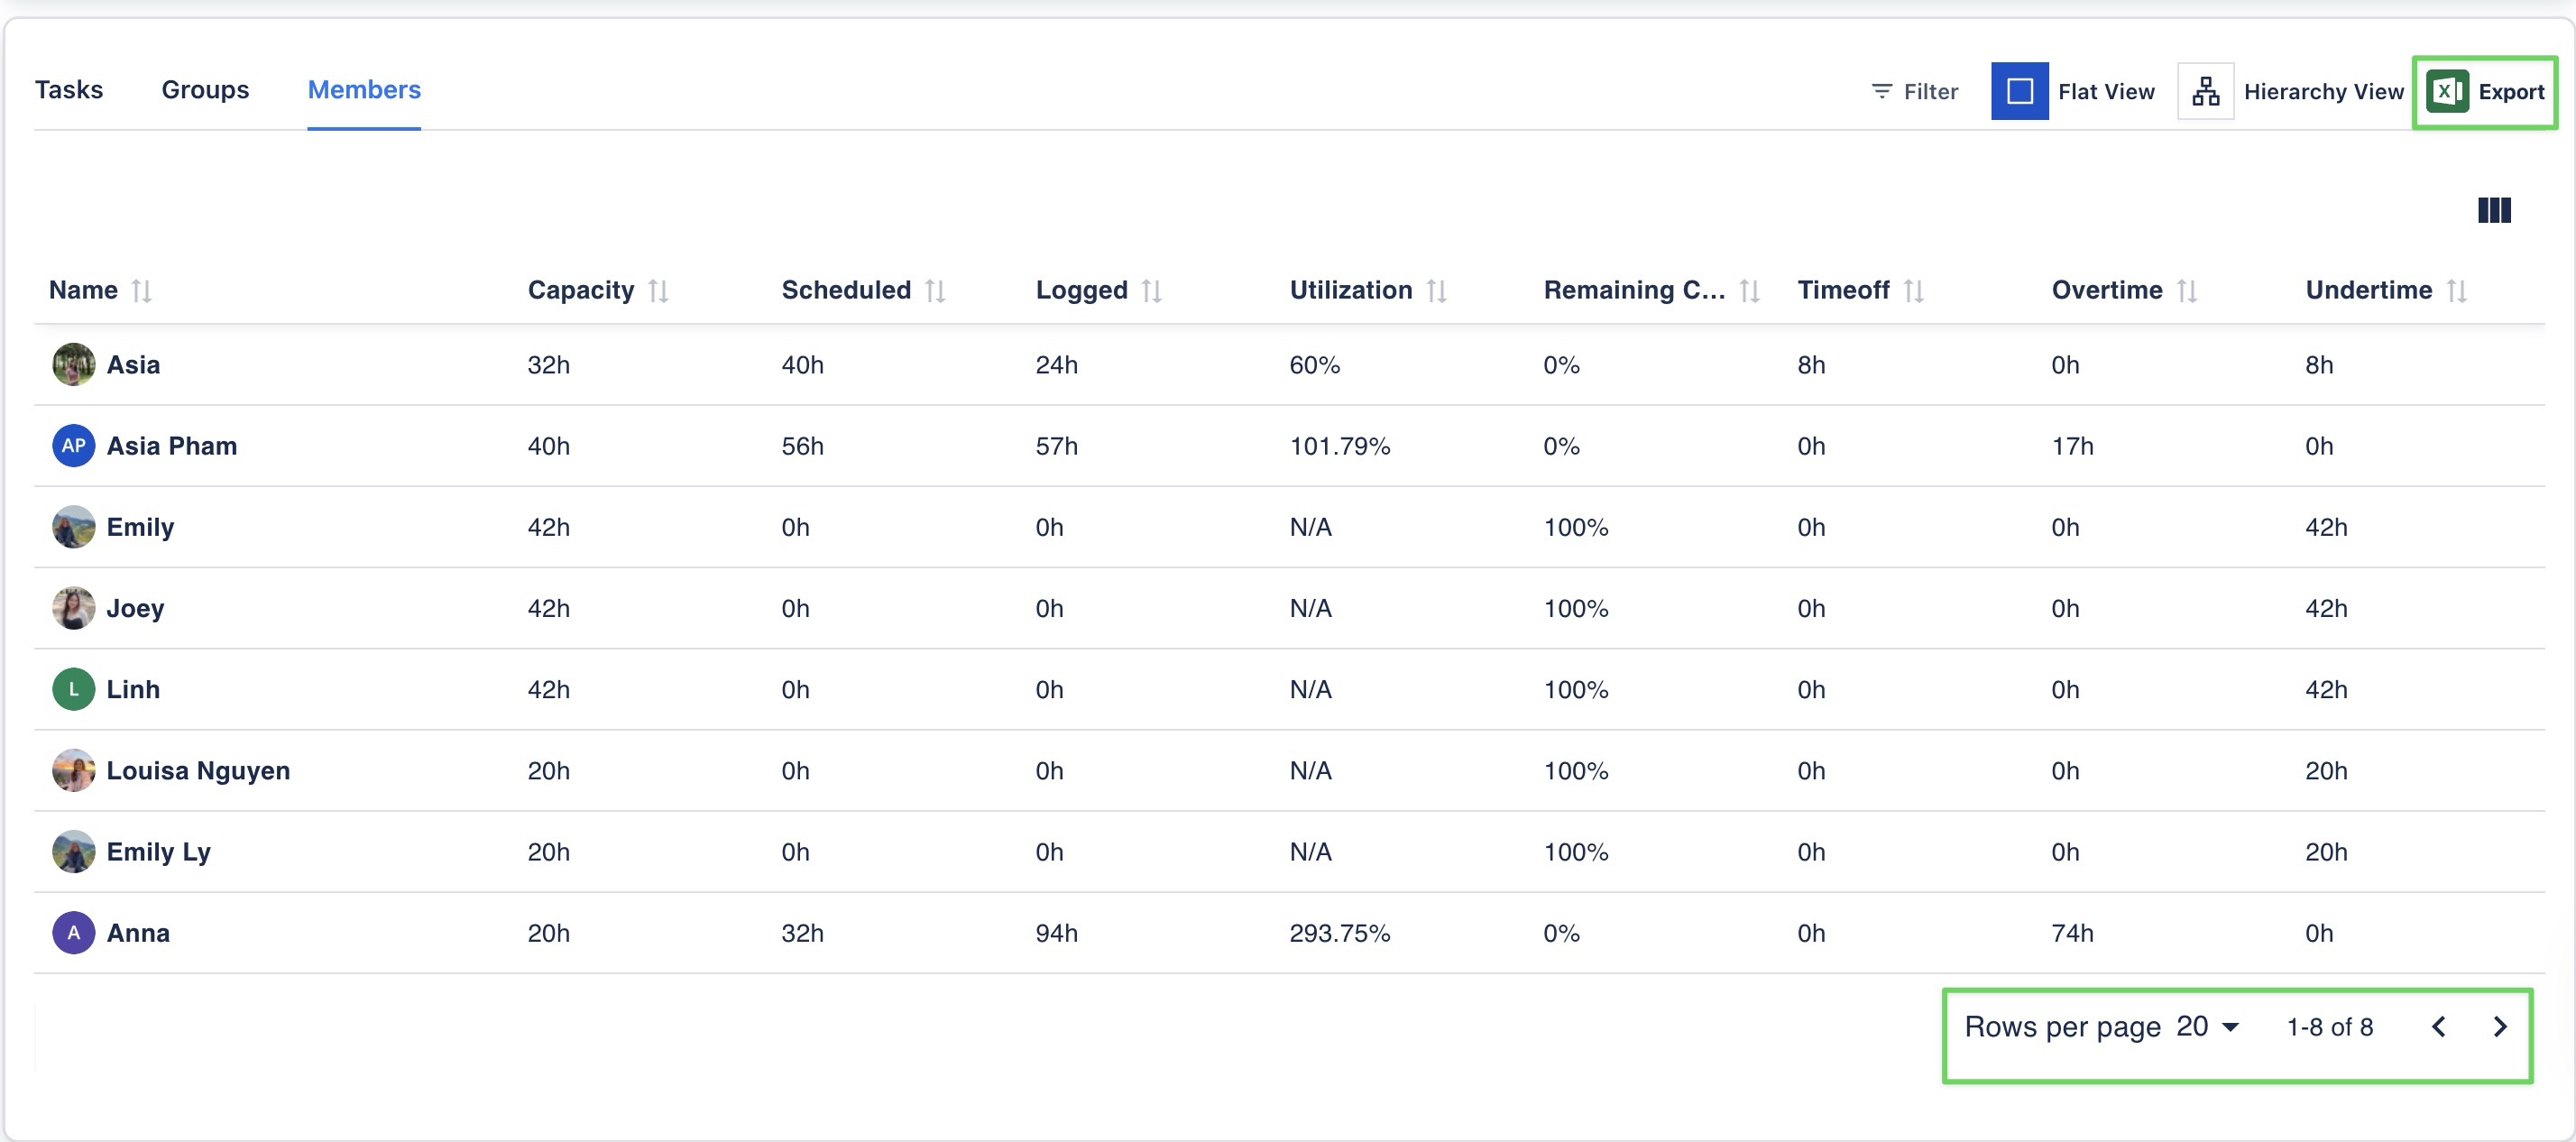
You can adjust the number of rows to export by selecting the "Rows per page" option in the bottom-right corner. This allows you to control how much data is included in your exported file.