
What is Gantt?
A Gantt chart is a project management tool that visually represents the timeline of a project, showing the start and end dates of various elements or tasks.
By combining the WBS (Work Breakdown Structure) feature, PlanCore provides a structured and visual approach to project planning and tracking in Jira. By combining the hierarchical organization of a WBS with the timeline-based view of a Gantt chart, teams can organize projects into clear phases and tasks.
Overview
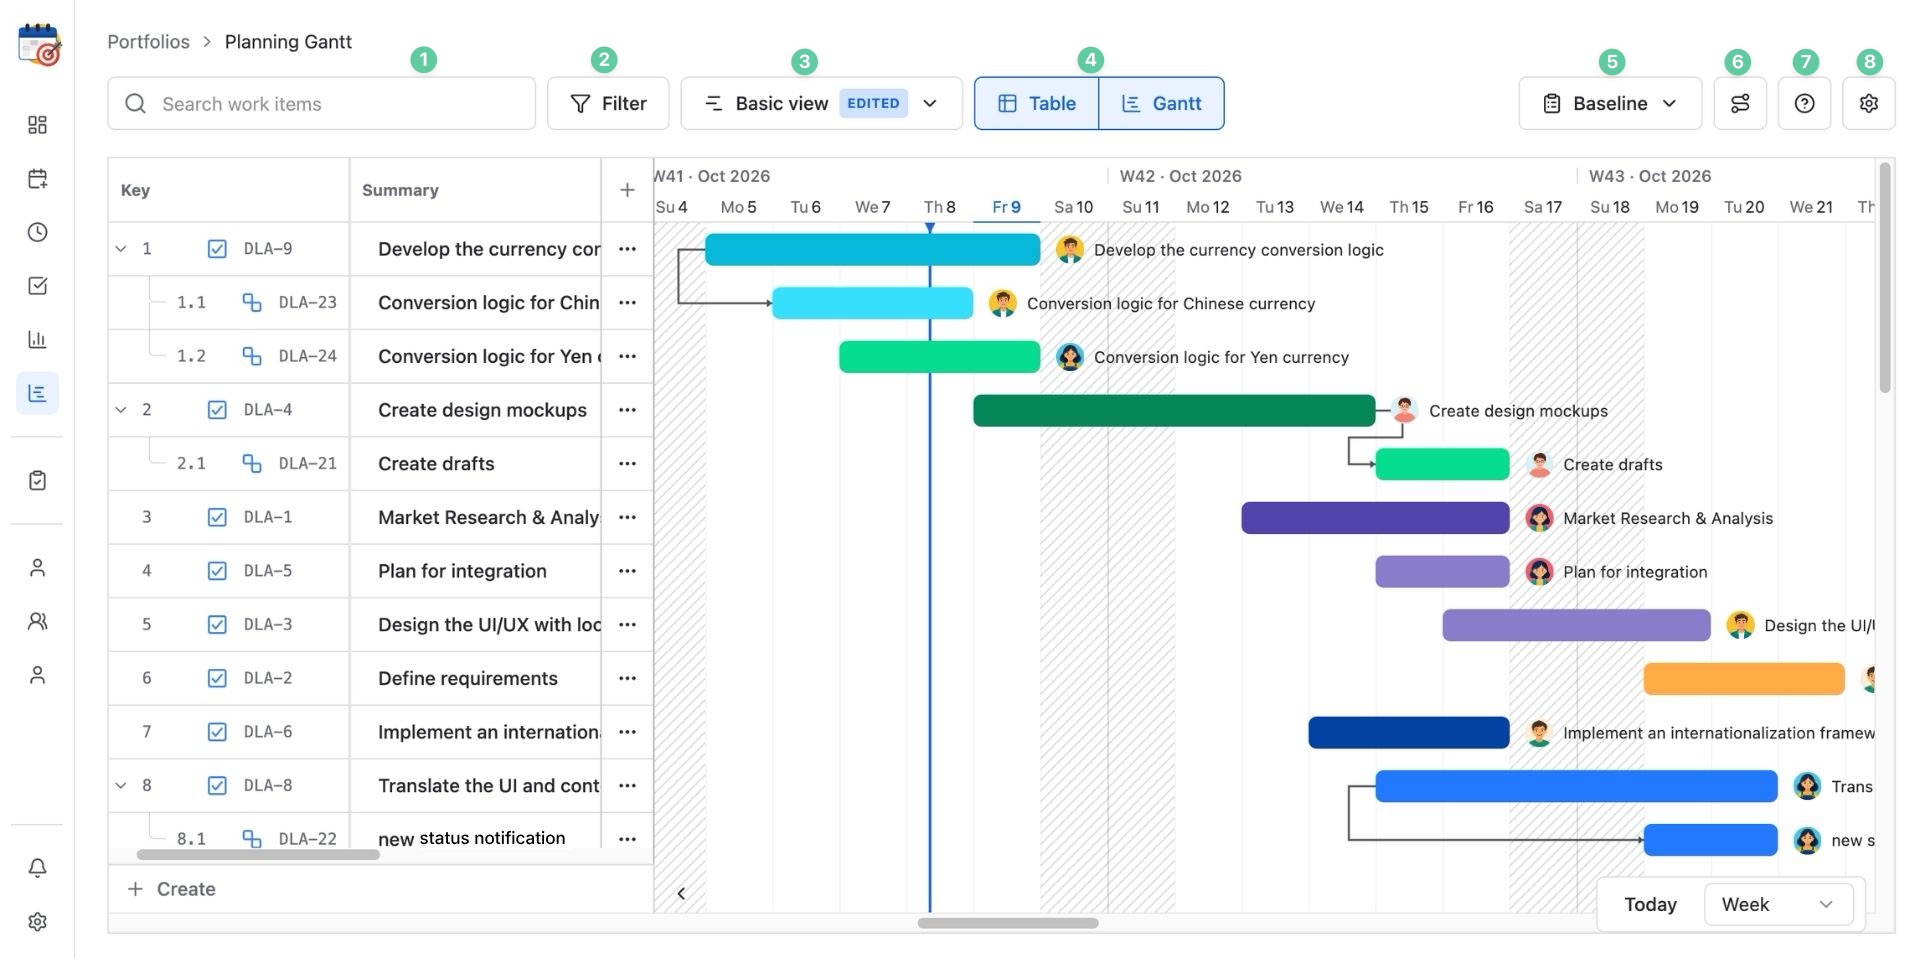
Here is a quick overview of the Gantt chart in PlanCore:
-
Search box: Search for work items using the summary or work item key to quickly locate specific tasks.
-
Filter: Refine and narrow down data fields and quickly locate relevant Jira work items.
-
Saved views:
-
Table/Gantt toggle: Enable or disable either the table view or Gantt timeline view.
-
Baseline: Choose, create, and manage baselines for the Gantt chart.
-
Critical path: Turn on to highlight the sequence of tasks to determine the project's overall duration
-
Help: Quick access to the user guide and support.
-
Settings: Access timeline display and the board settings.
To schedule tasks in the timeline view, you are required to map Jira date fields to PlanCore date fields in the Admin settings.