.png)
A Gantt Chart is a visual tool used in project management to represent project timelines and task relationships. It displays tasks along a timeline, showing their start and end dates, duration, and dependencies. It allows for detailed planning, scheduling, and tracking of project progress.
In TeamBoard ProScheduler, the Gantt chart includes advanced features such as WBS Gantt, Critical Path analysis, and Baseline tracking, giving teams greater control over project planning and execution.
WBS Gantt
What is WBS Gantt?
The WBS Gantt (Work Breakdown Structure) feature in TeamBoard ProScheduler offers an advanced way to plan and track projects within Jira. It combines the hierarchical structure of a WBS with the visual timeline of a Gantt chart, allowing teams to break down projects into phases, tasks, and subtasks.
Enabling the WBS Gantt Chart
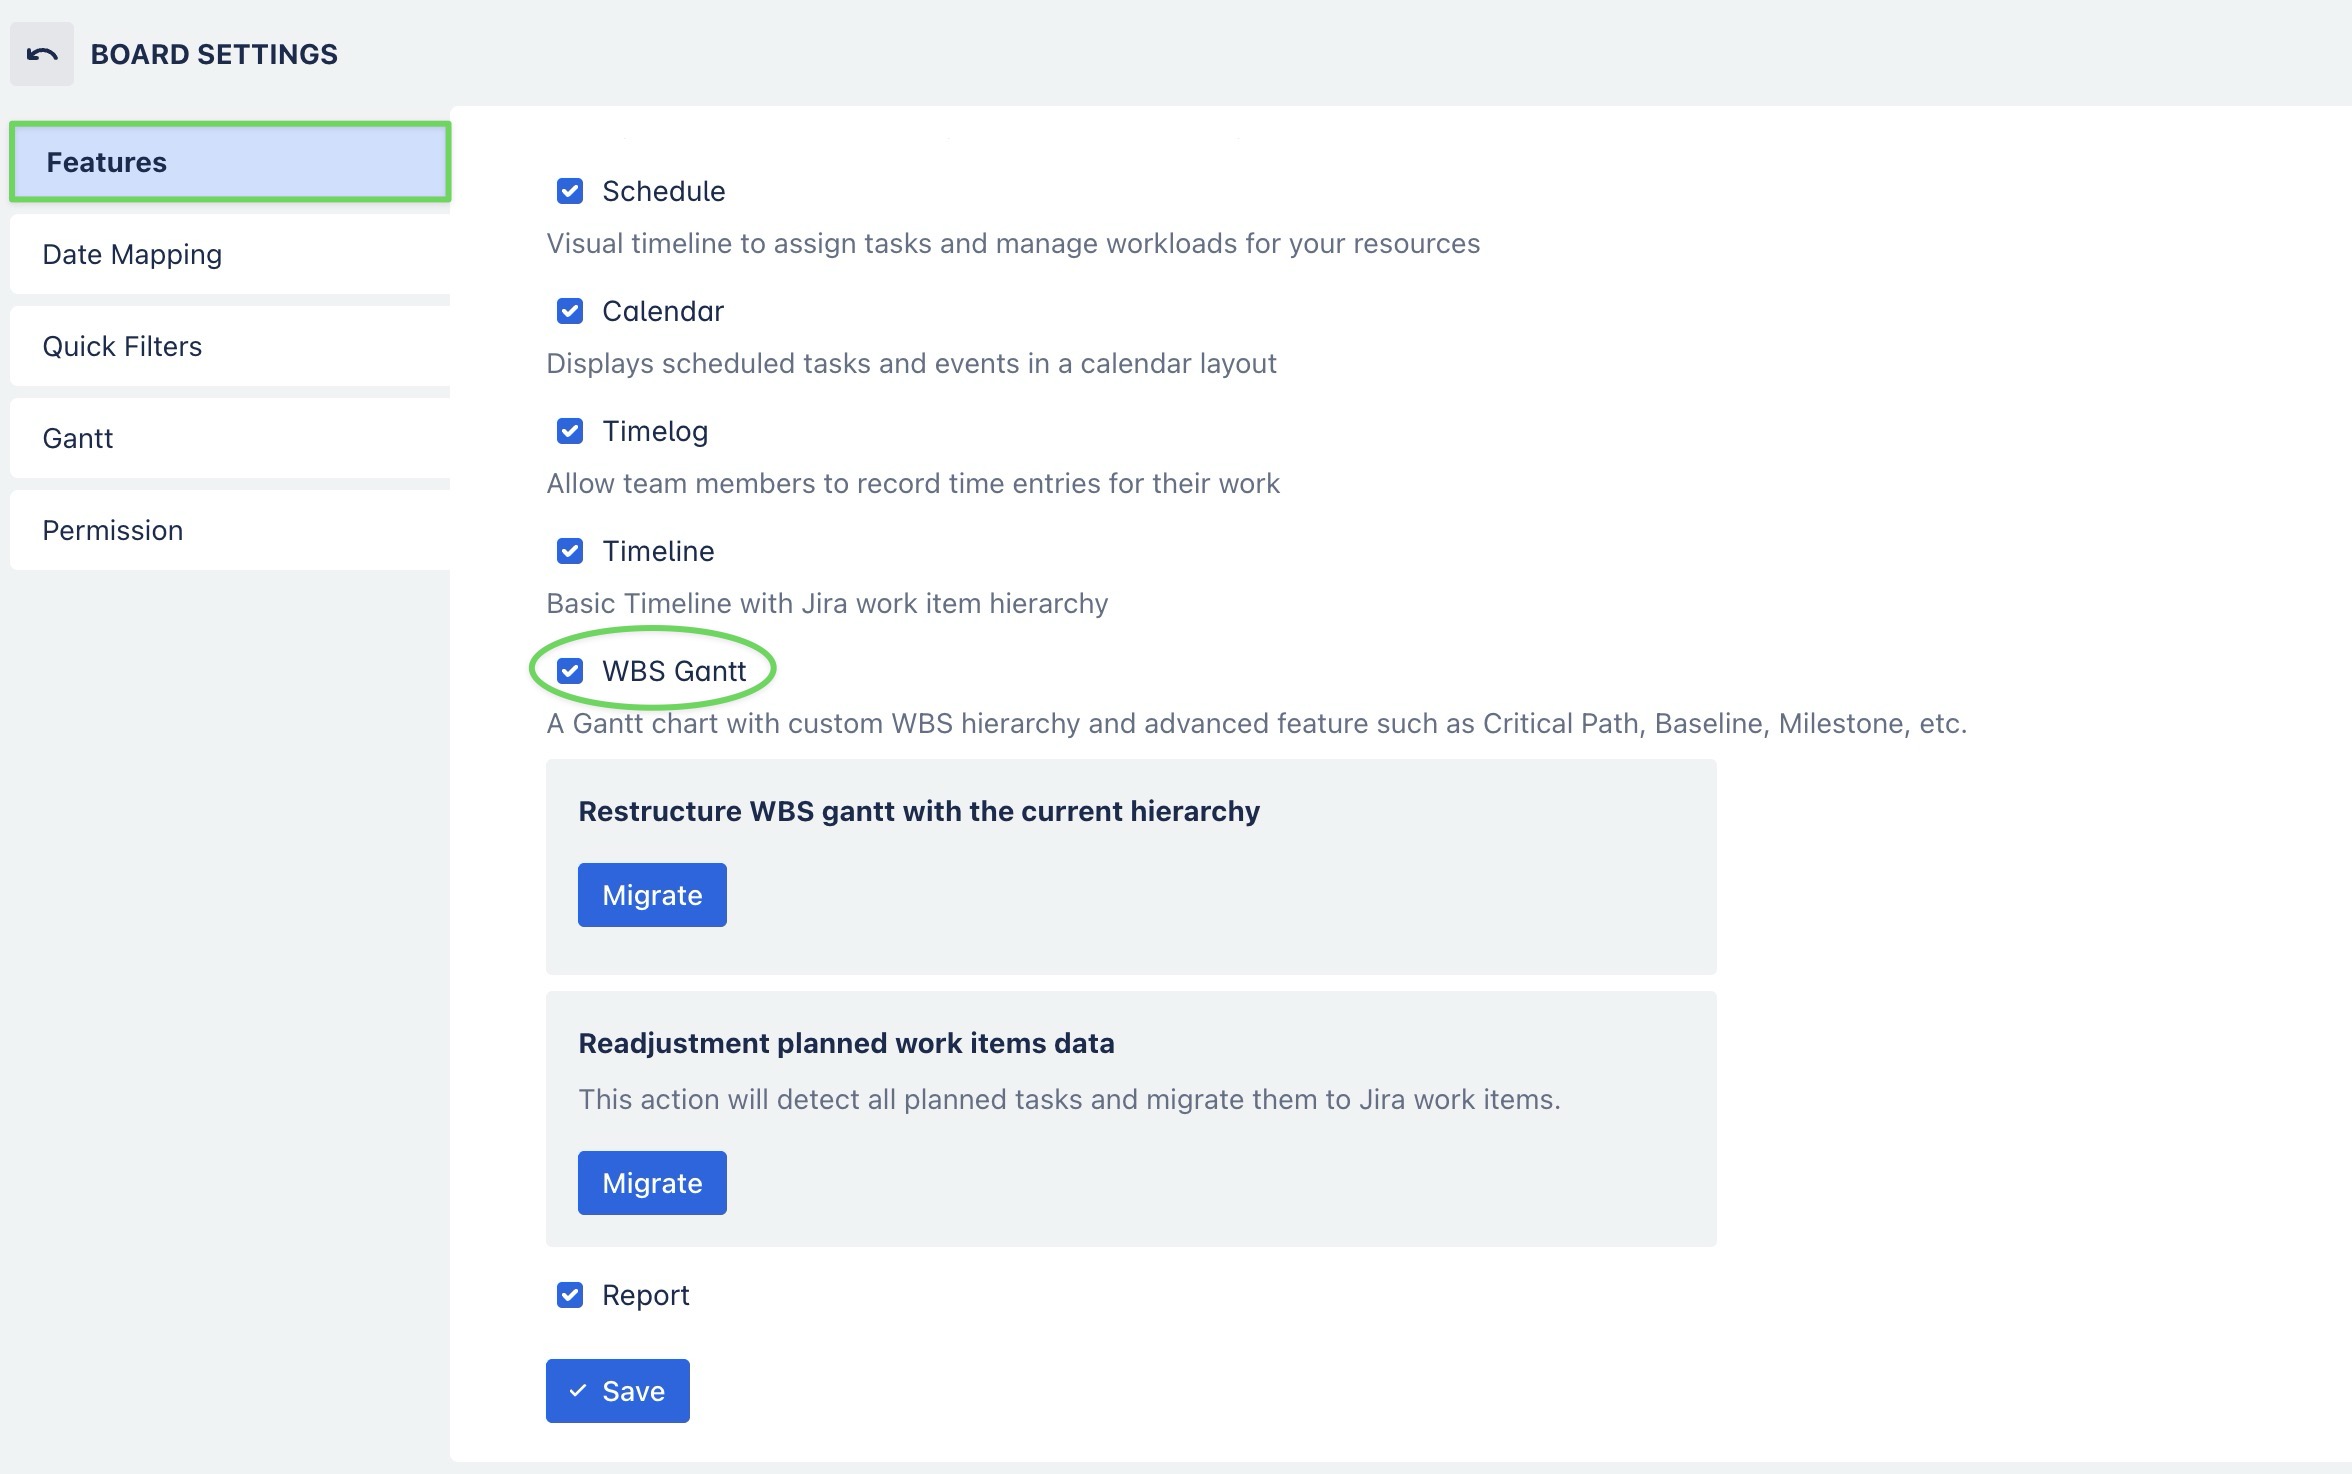
By default, WBS Gantt is enabled. When accessed for the first time, it copies the current Timeline hierarchy and assigns WBS numbers. Subsequent changes are maintained within WBS Gantt and are not synced with the Jira issue hierarchy or Timeline.
Admins can enable or disable WBS Gantt by navigating to Board Settings > Features > WBS Gantt
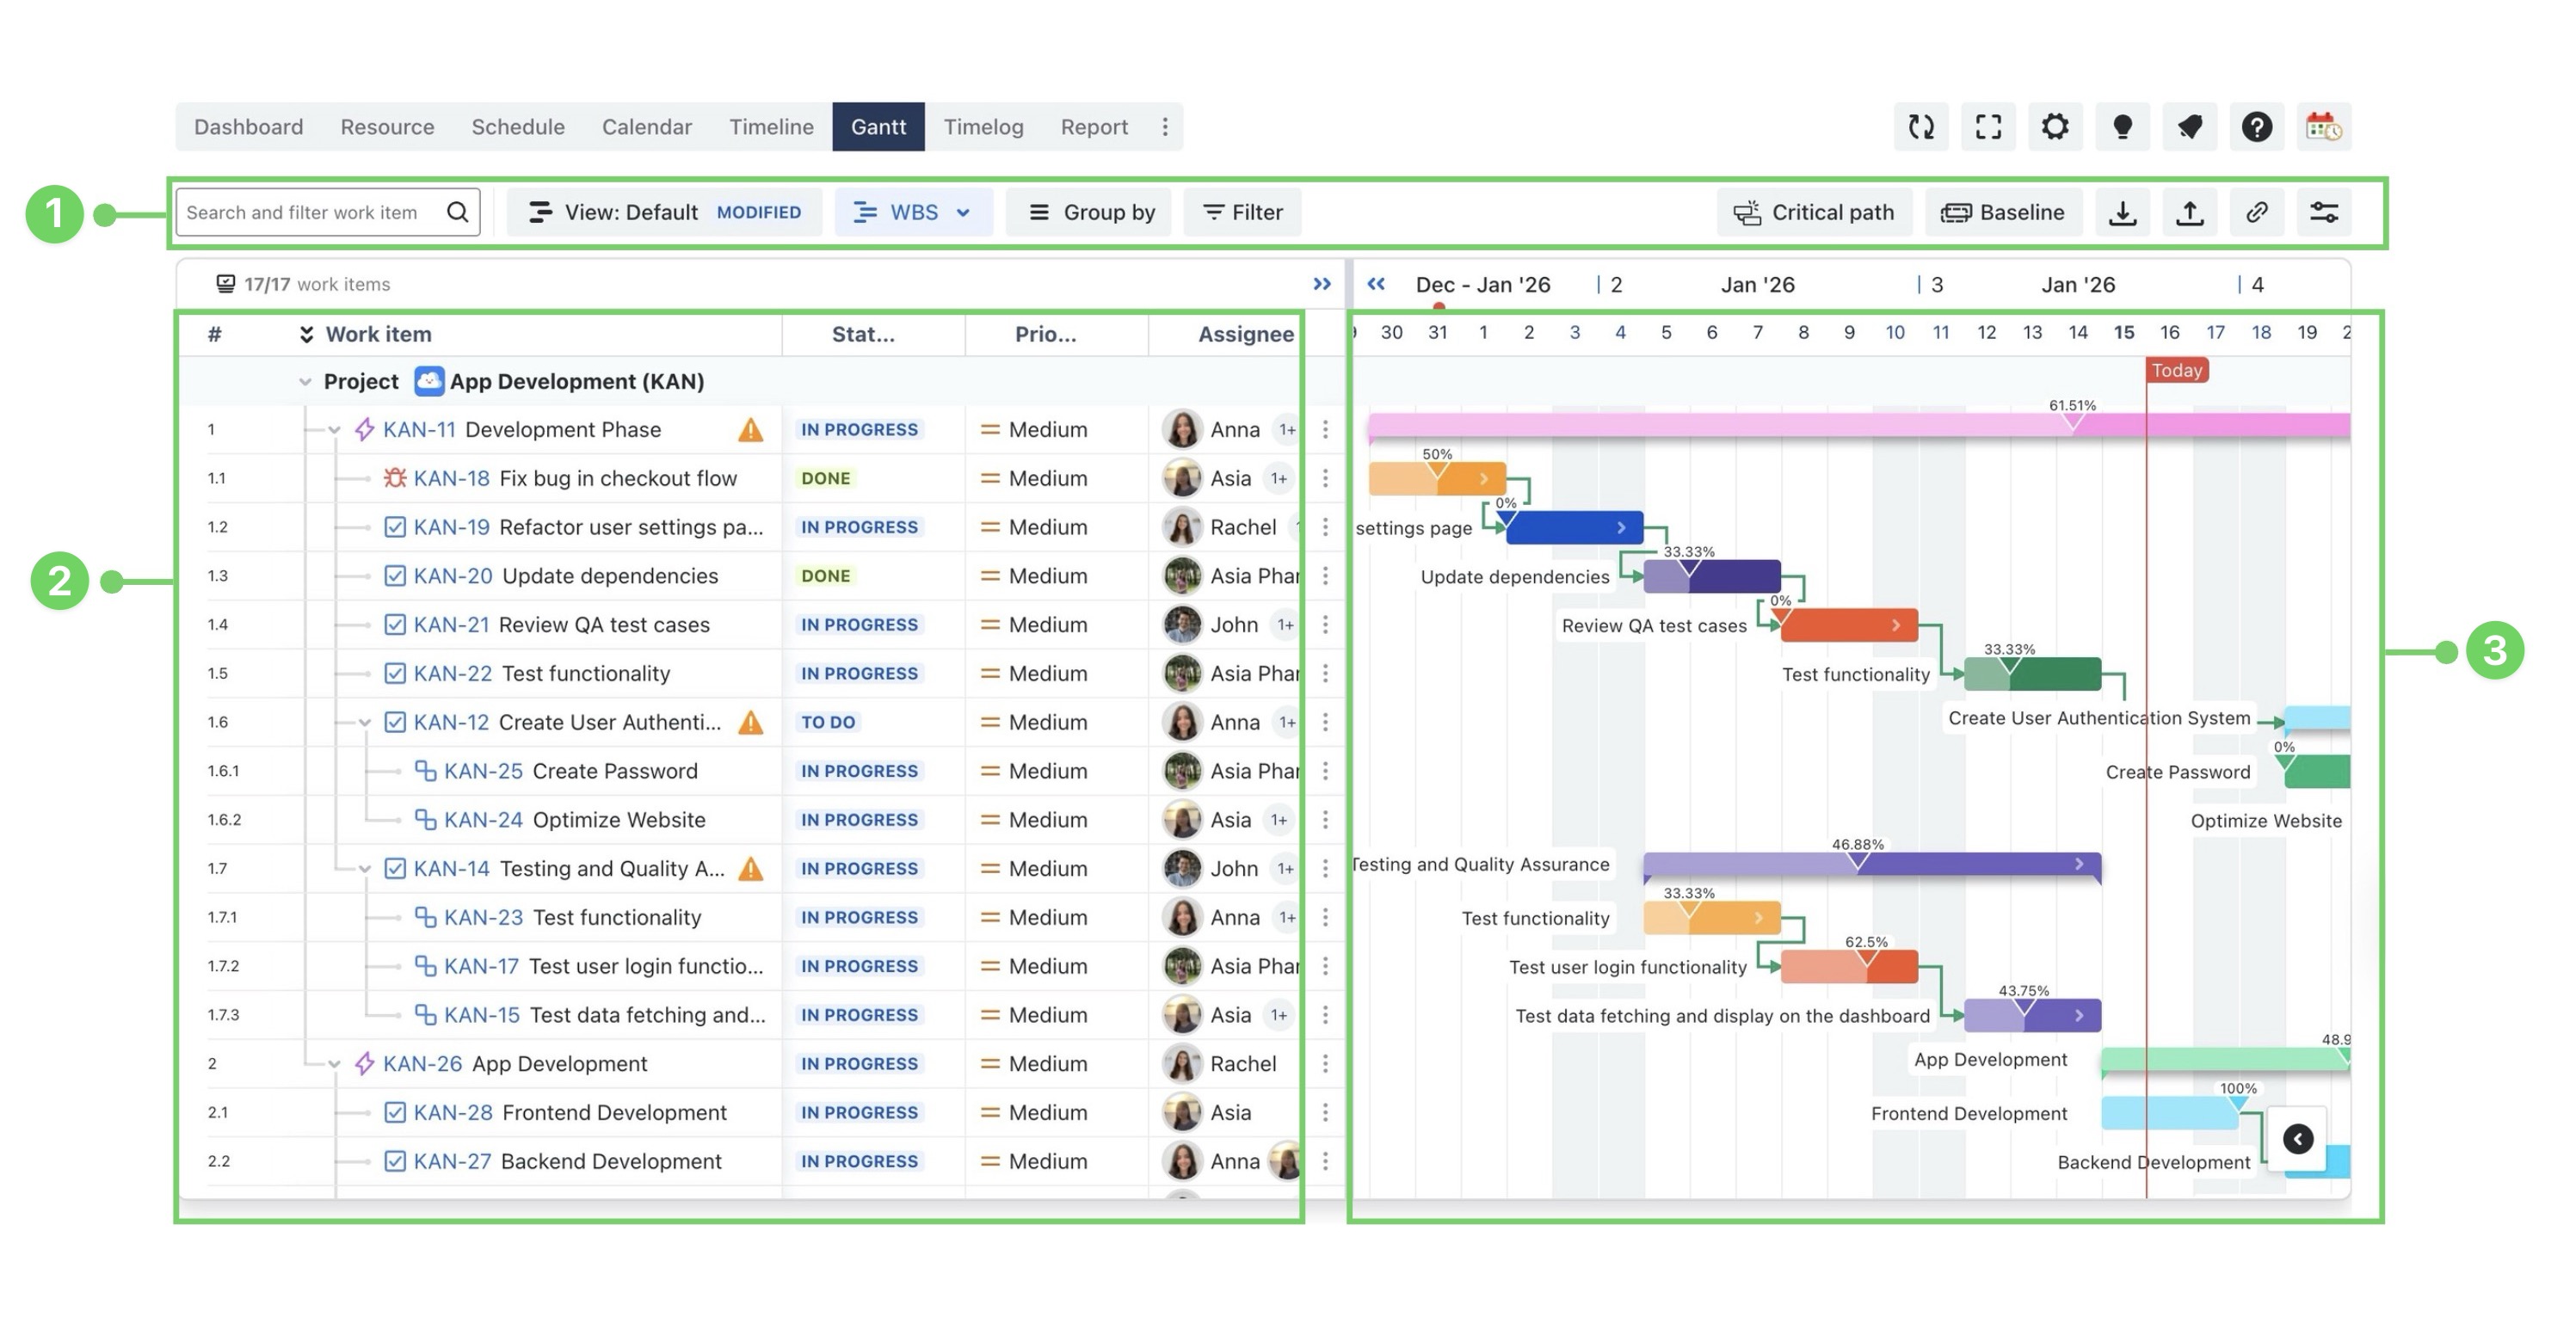
The Gantt Board consists of 3 main sections:
-
Gantt toolbar
-
Work item table
-
Gantt view
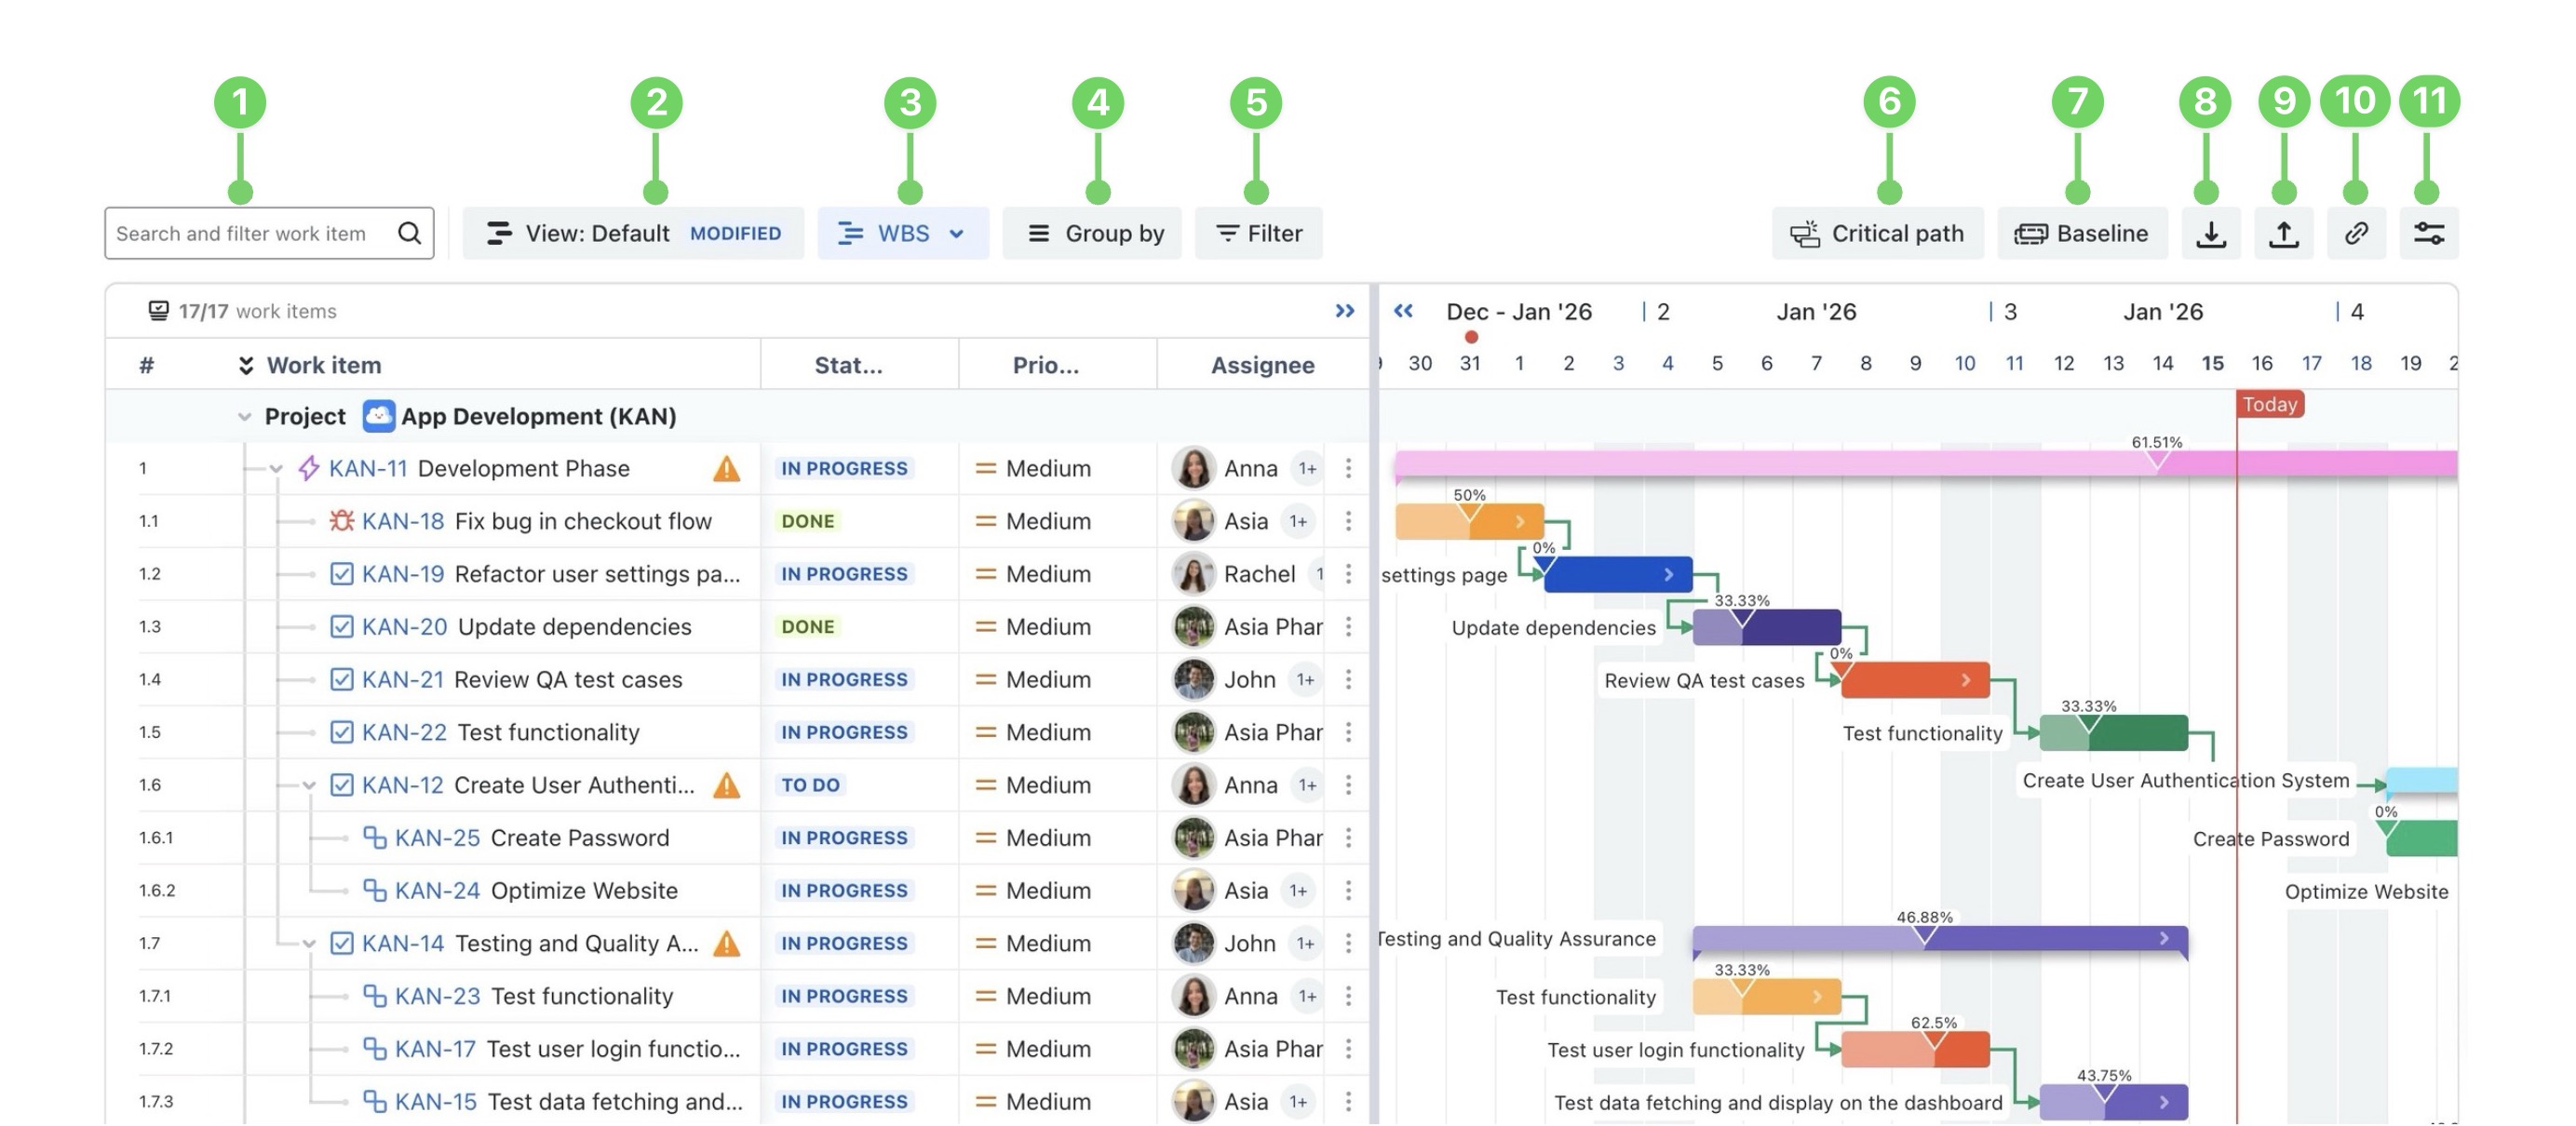
Gantt toolbar
|
Number |
Feature |
Description |
|---|---|---|
|
1 |
Search and filter work items |
Search for work items using the summary or work item key to quickly locate specific tasks. |
|
2 |
Save your customized views in the Gantt, allowing you to retain preferred layouts and settings for future use. |
|
|
3 |
Use this option to switch between different hierarchy structures, including Jira hierarchy, Flat, and WBS views. |
|
|
4 |
Group work items by categories like status, assignee, priority, or sprint, etc., to gain a clearer overview of your project. |
|
|
5 |
Apply filters to view specific work items based on JQL settings. |
|
|
6 |
Identifies the sequence of tasks that defines the project’s minimum completion time. |
|
|
7 |
Capture a snapshot of your current schedule to compare planned versus actual progress over time. |
|
|
8 |
Import tasks from a CSV file into your project to streamline task addition. |
|
|
9 |
Export task data to an Excel/PDF file for easy sharing or reporting outside the platform. |
|
|
10 |
Share Link |
Generate a shareable link to the current Gantt view configuration. |
|
11 |
|
Customize the look of the Gantt and add extra details to your Gantt view |


Work item table
Overview
The work item table is an Excel spreadsheet-like interface for managing work items, providing users with a quick and convenient way to handle all work items. You can view a list of work items in an organized format.
This feature combines the simplicity of a spreadsheet with the power of Jira. It offers a flexible and intuitive interface for organizing, managing, and tracking work items, allowing users to edit work items in line, customize columns, and more.
Working on the table
Customizing task hierarchy
You can easily arrange tasks to reflect your project’s structure using a simple drag-and-drop feature.
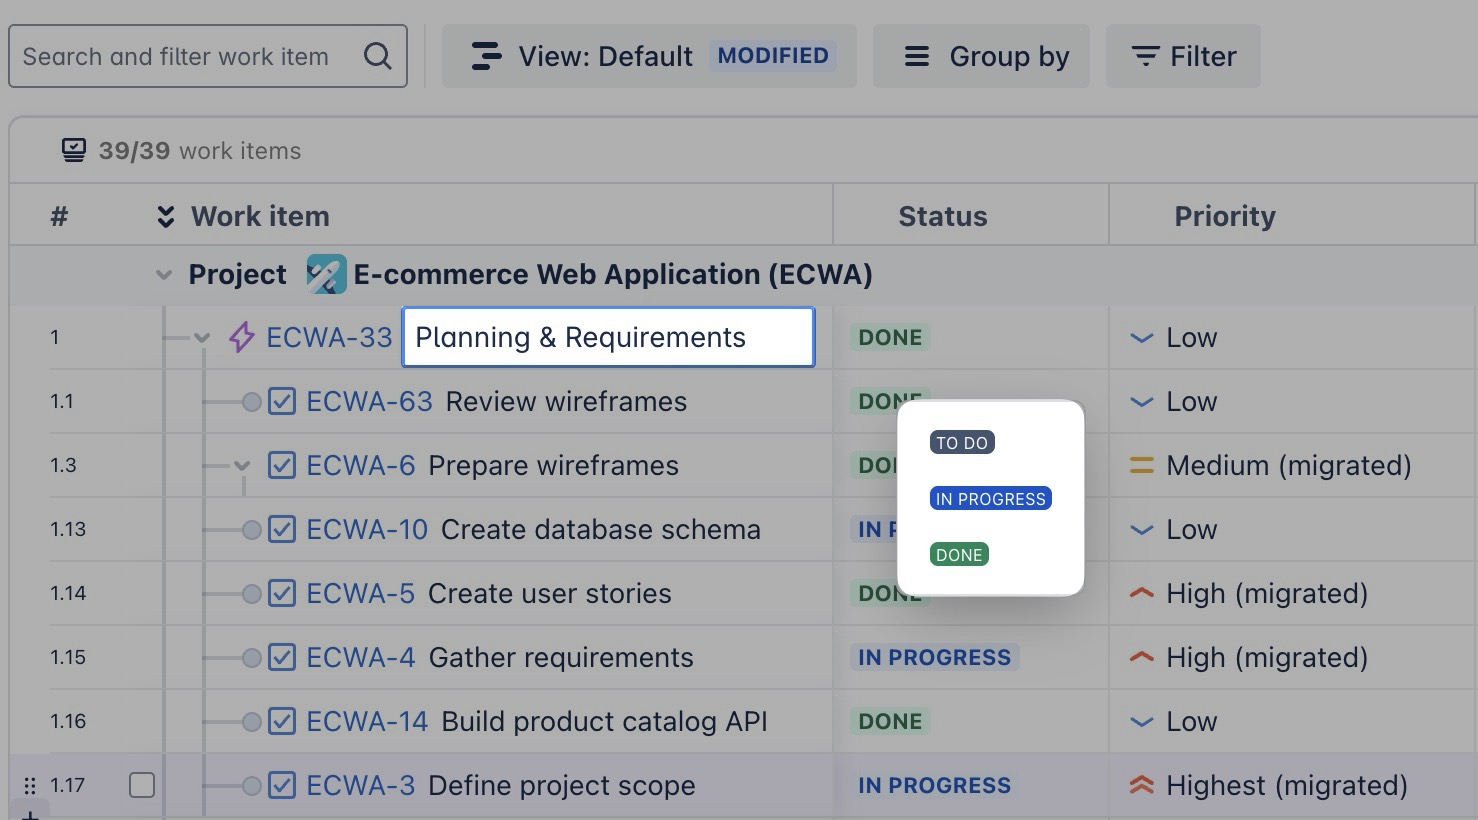
Edit fields inline
You can directly edit task details within the table, such as status, assignee, due date, start date, etc.
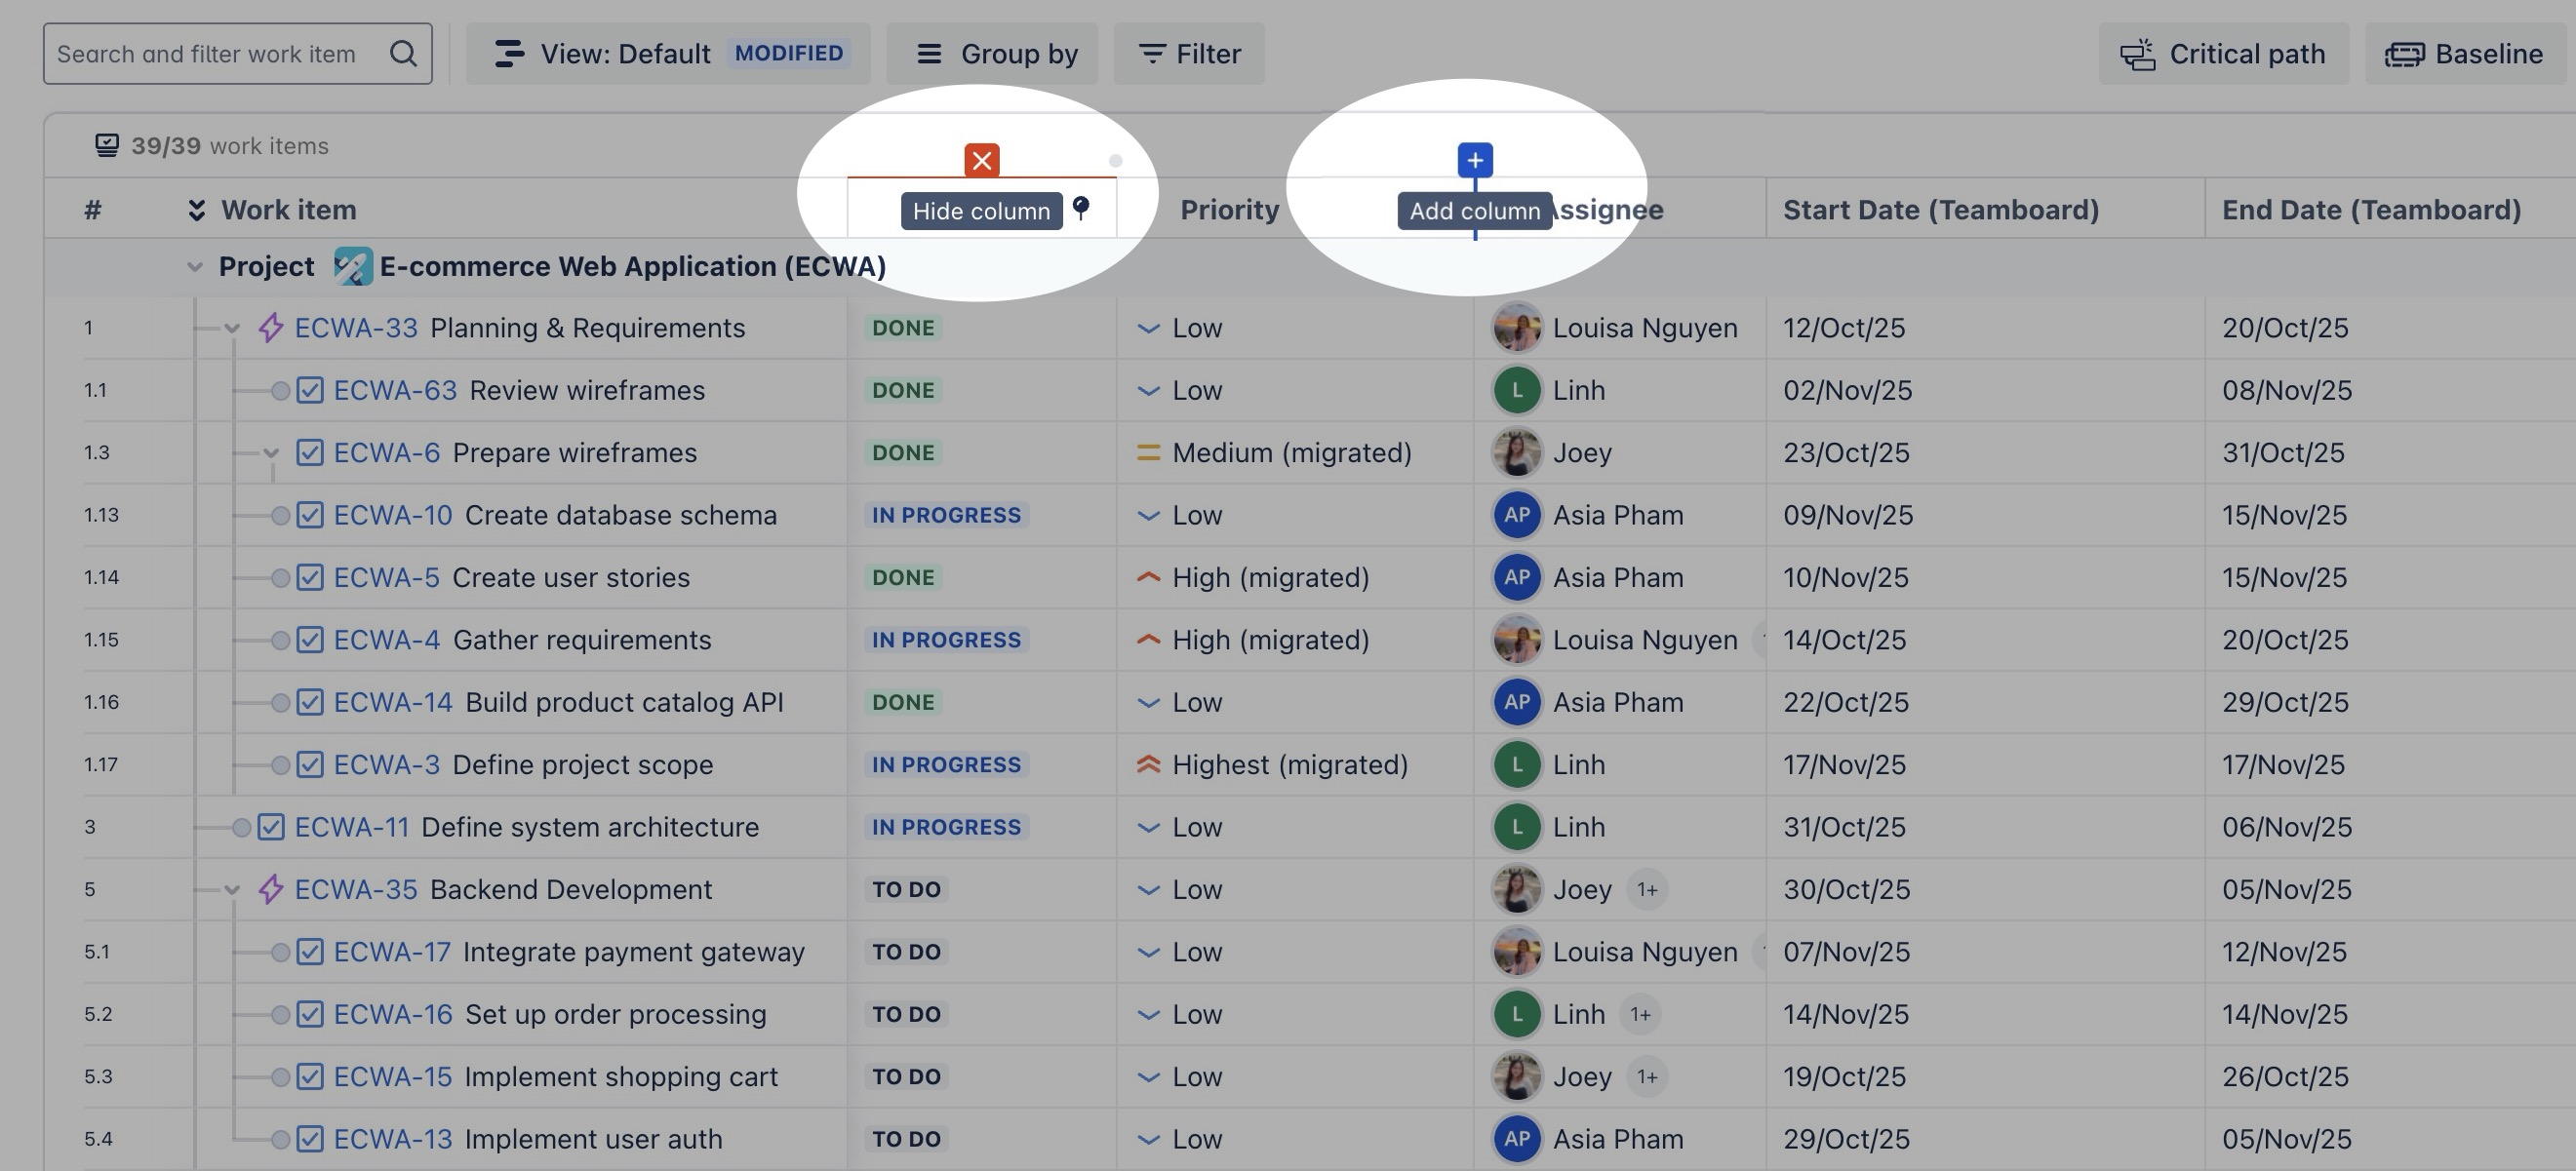
Add or remove columns
Tailor the table to your needs by adding or removing columns.
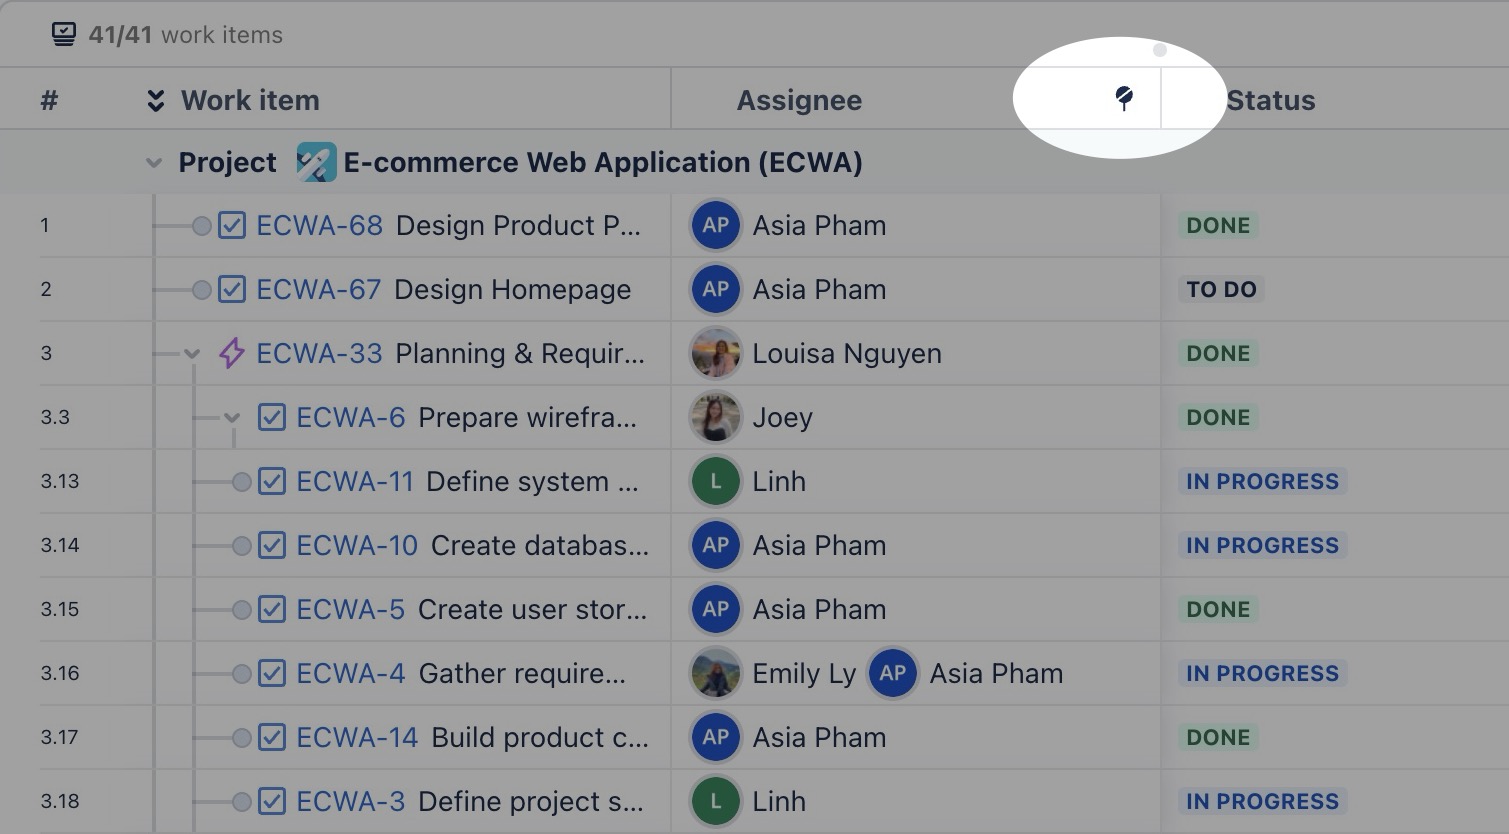
Pin or unpin columns
Pin important columns to the left to ensure they remain visible while you scroll through the table.
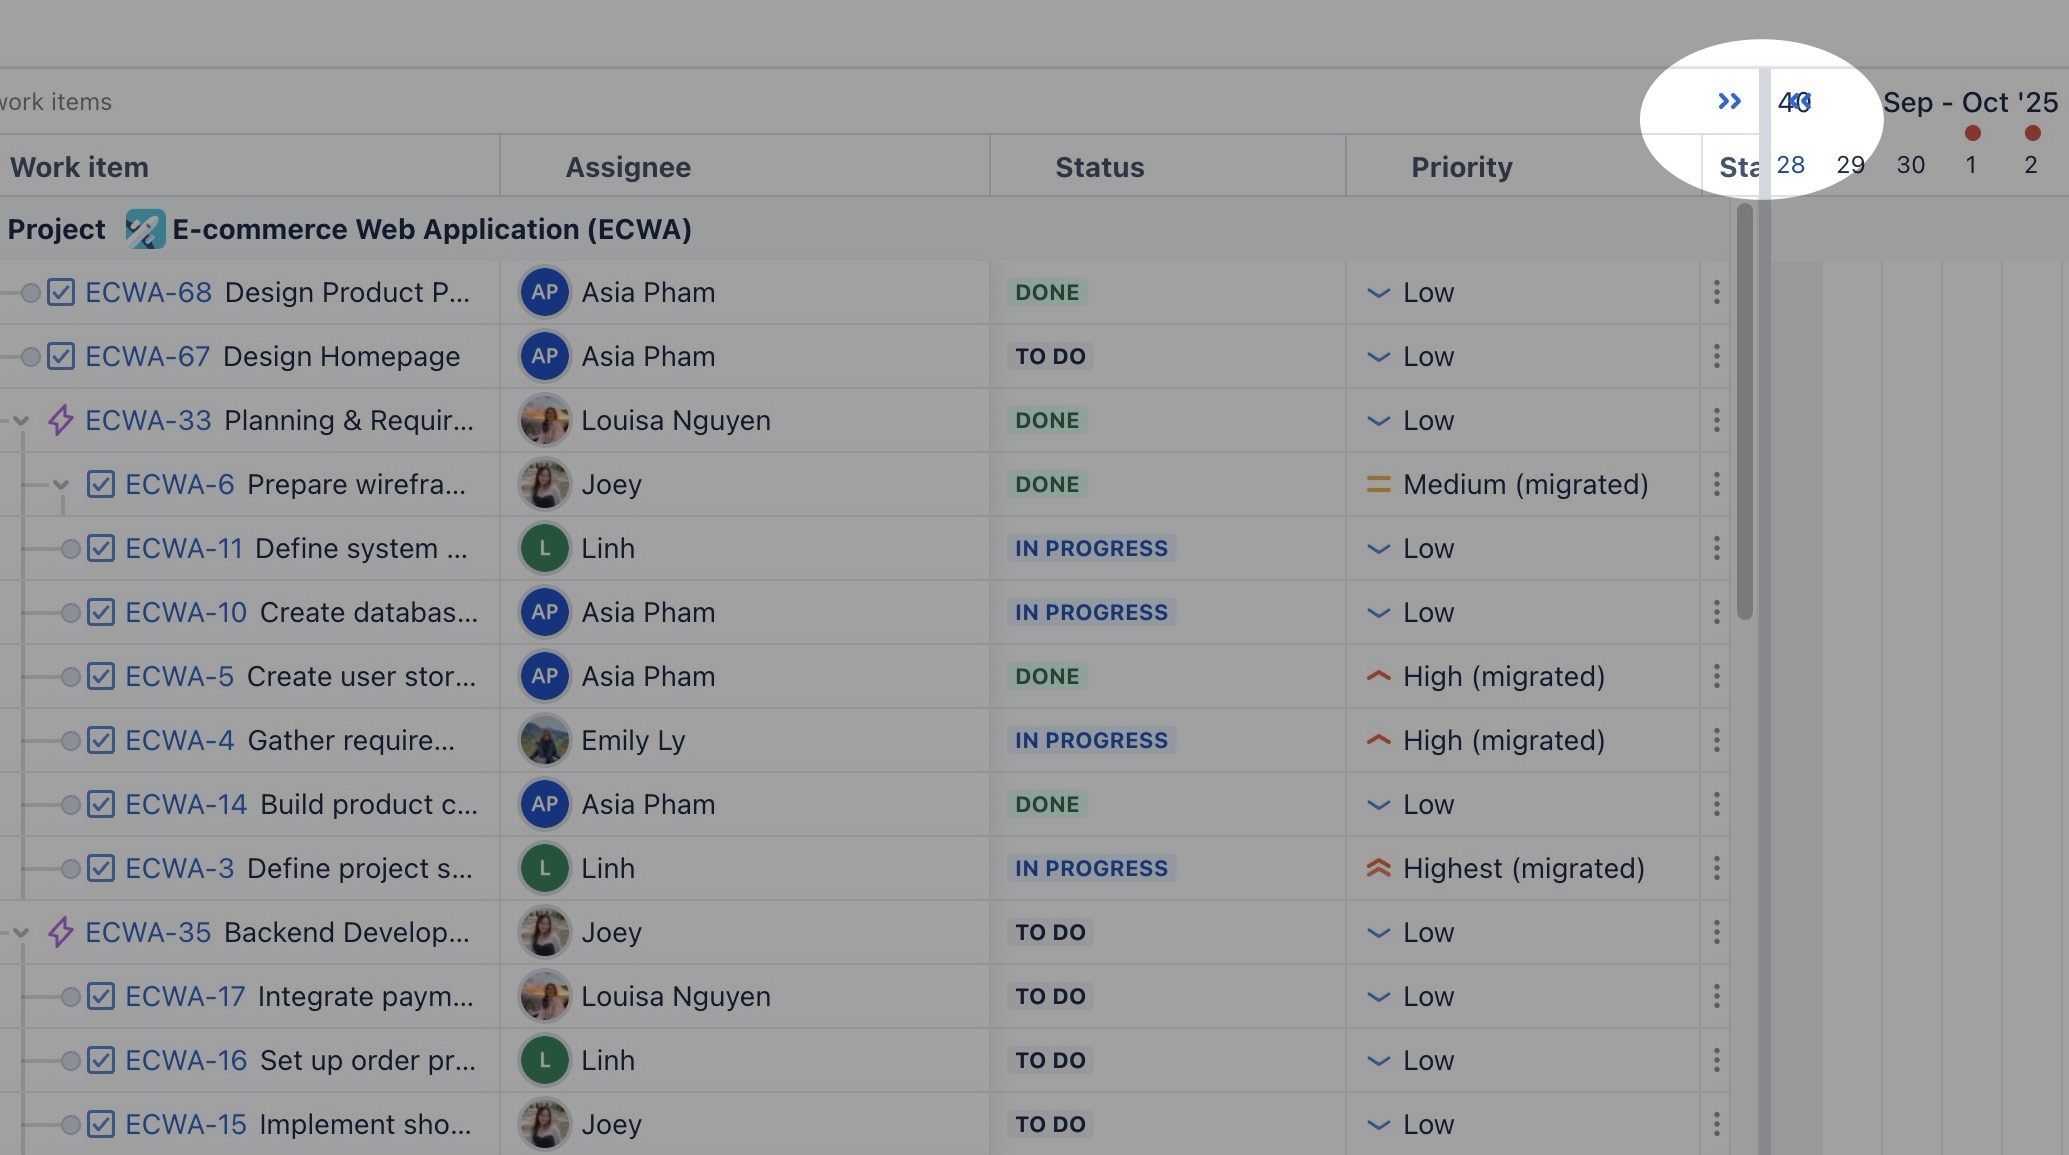
Expand to full table view
Click on the expand icon (>>) to open the full work items table, providing a detailed, Excel-like view of your project’s tasks.
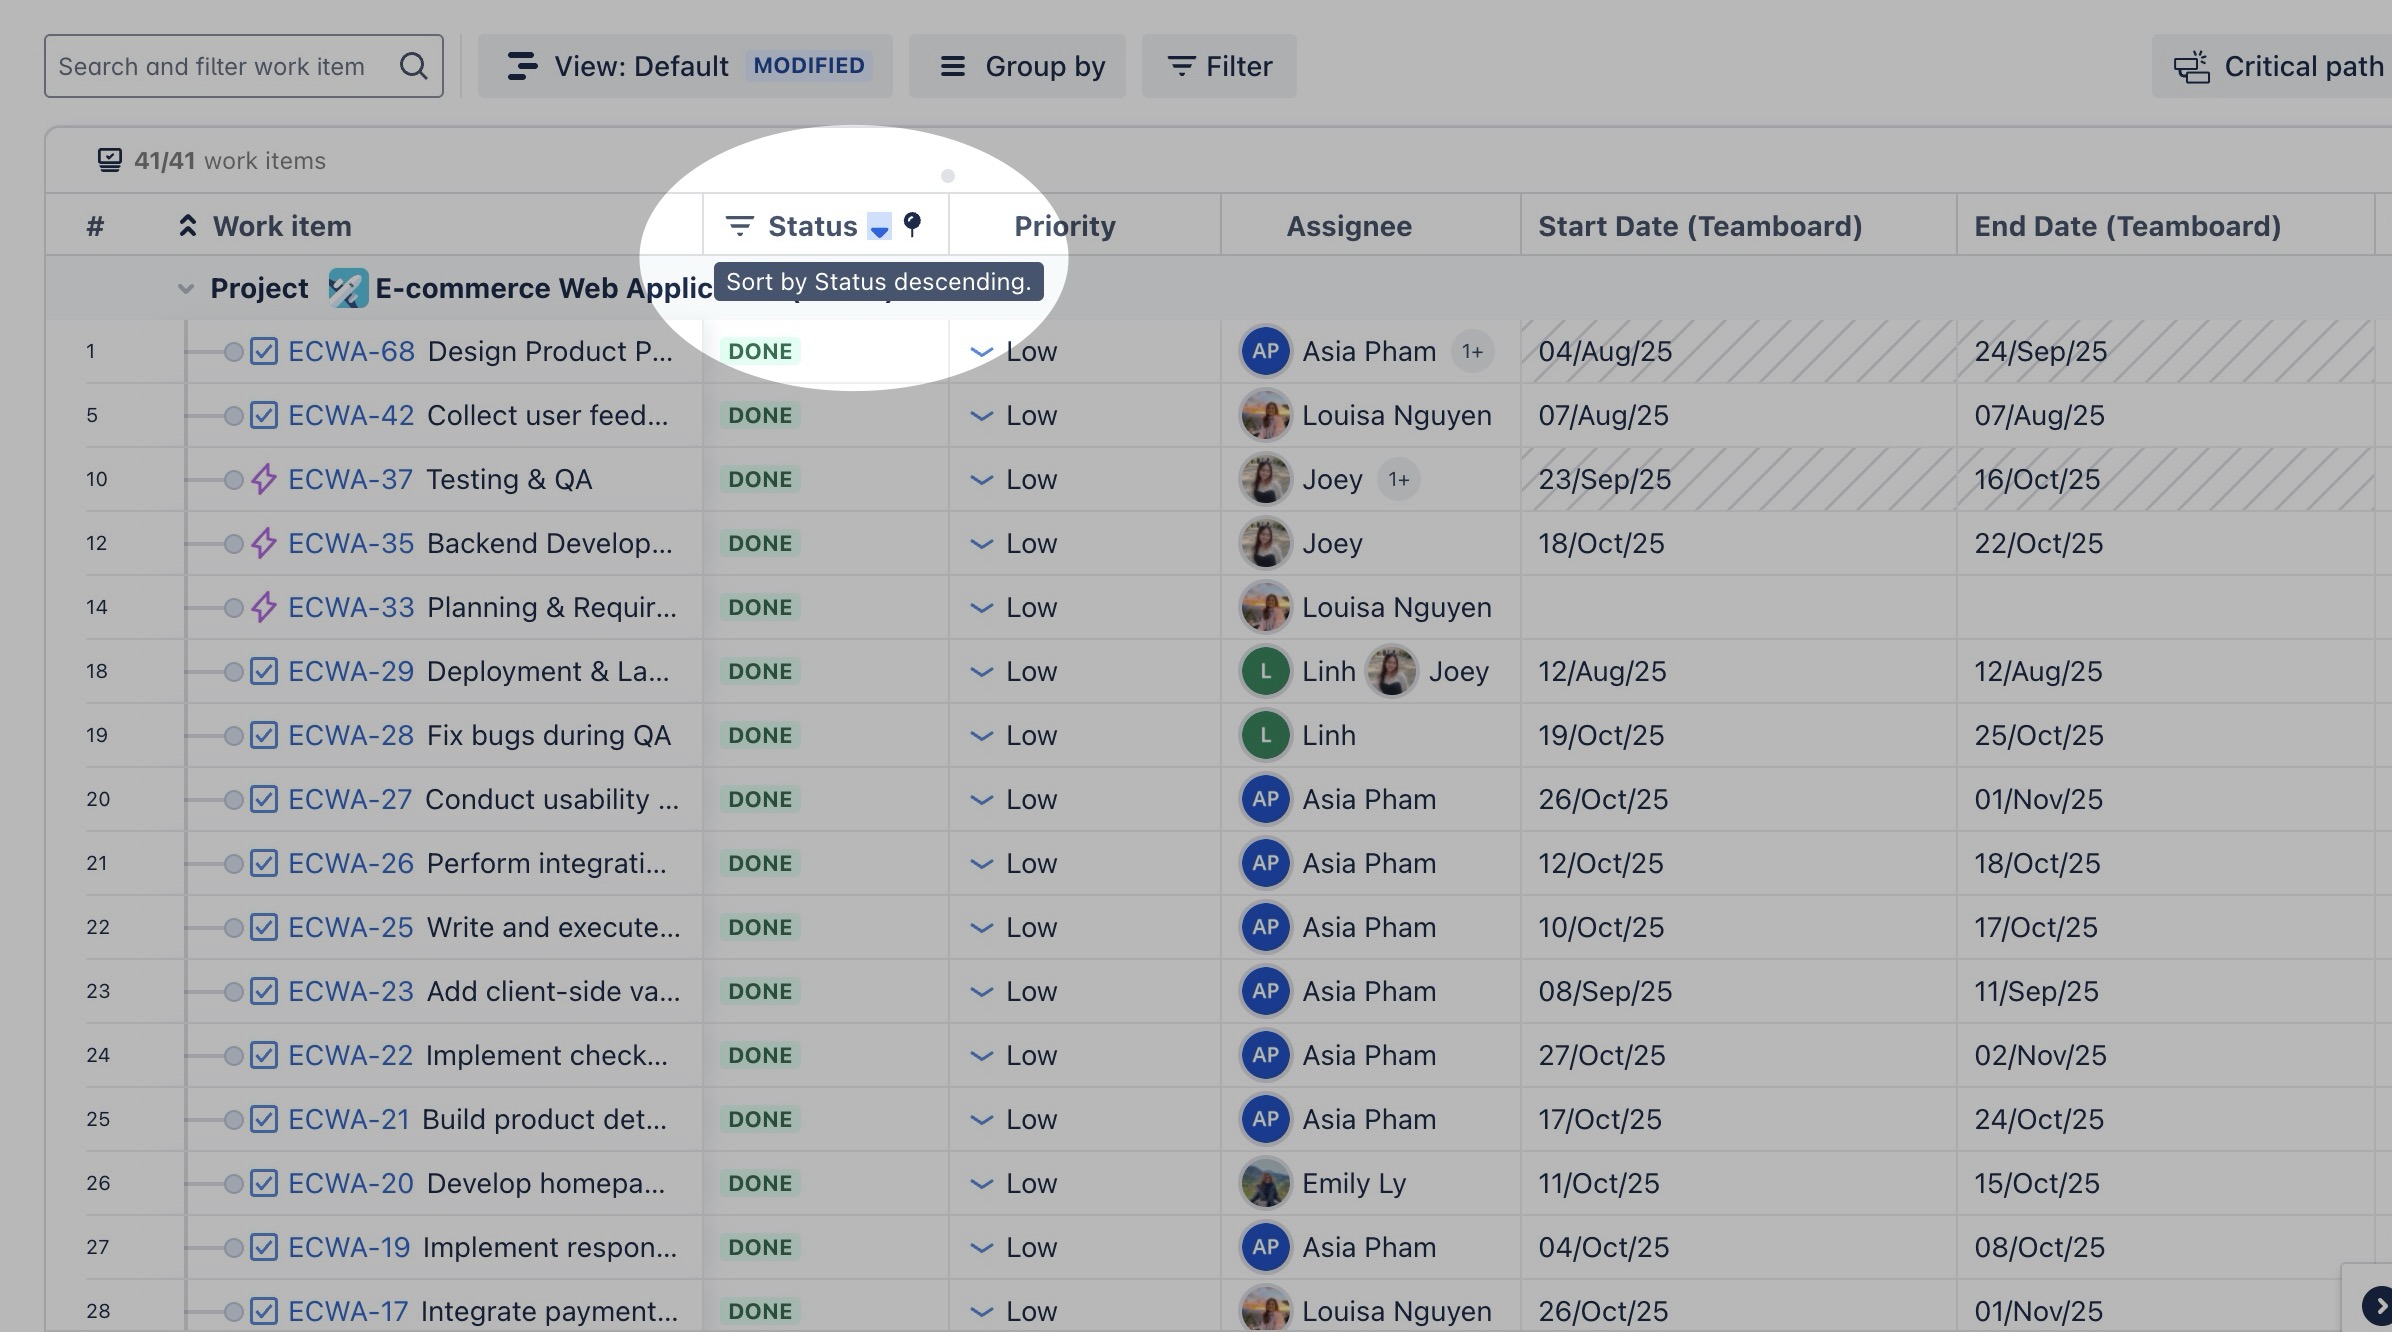
Sort by
Sort your task list in ascending (A-Z) or descending (Z-A) order based on the fields displayed as columns in the current view.
Resize and arrange the columns
To resize columns, click and drag the left or right border of a column.
To rearrange columns, hover over the column, then click and drag it to a new position.
Gantt view
Overview
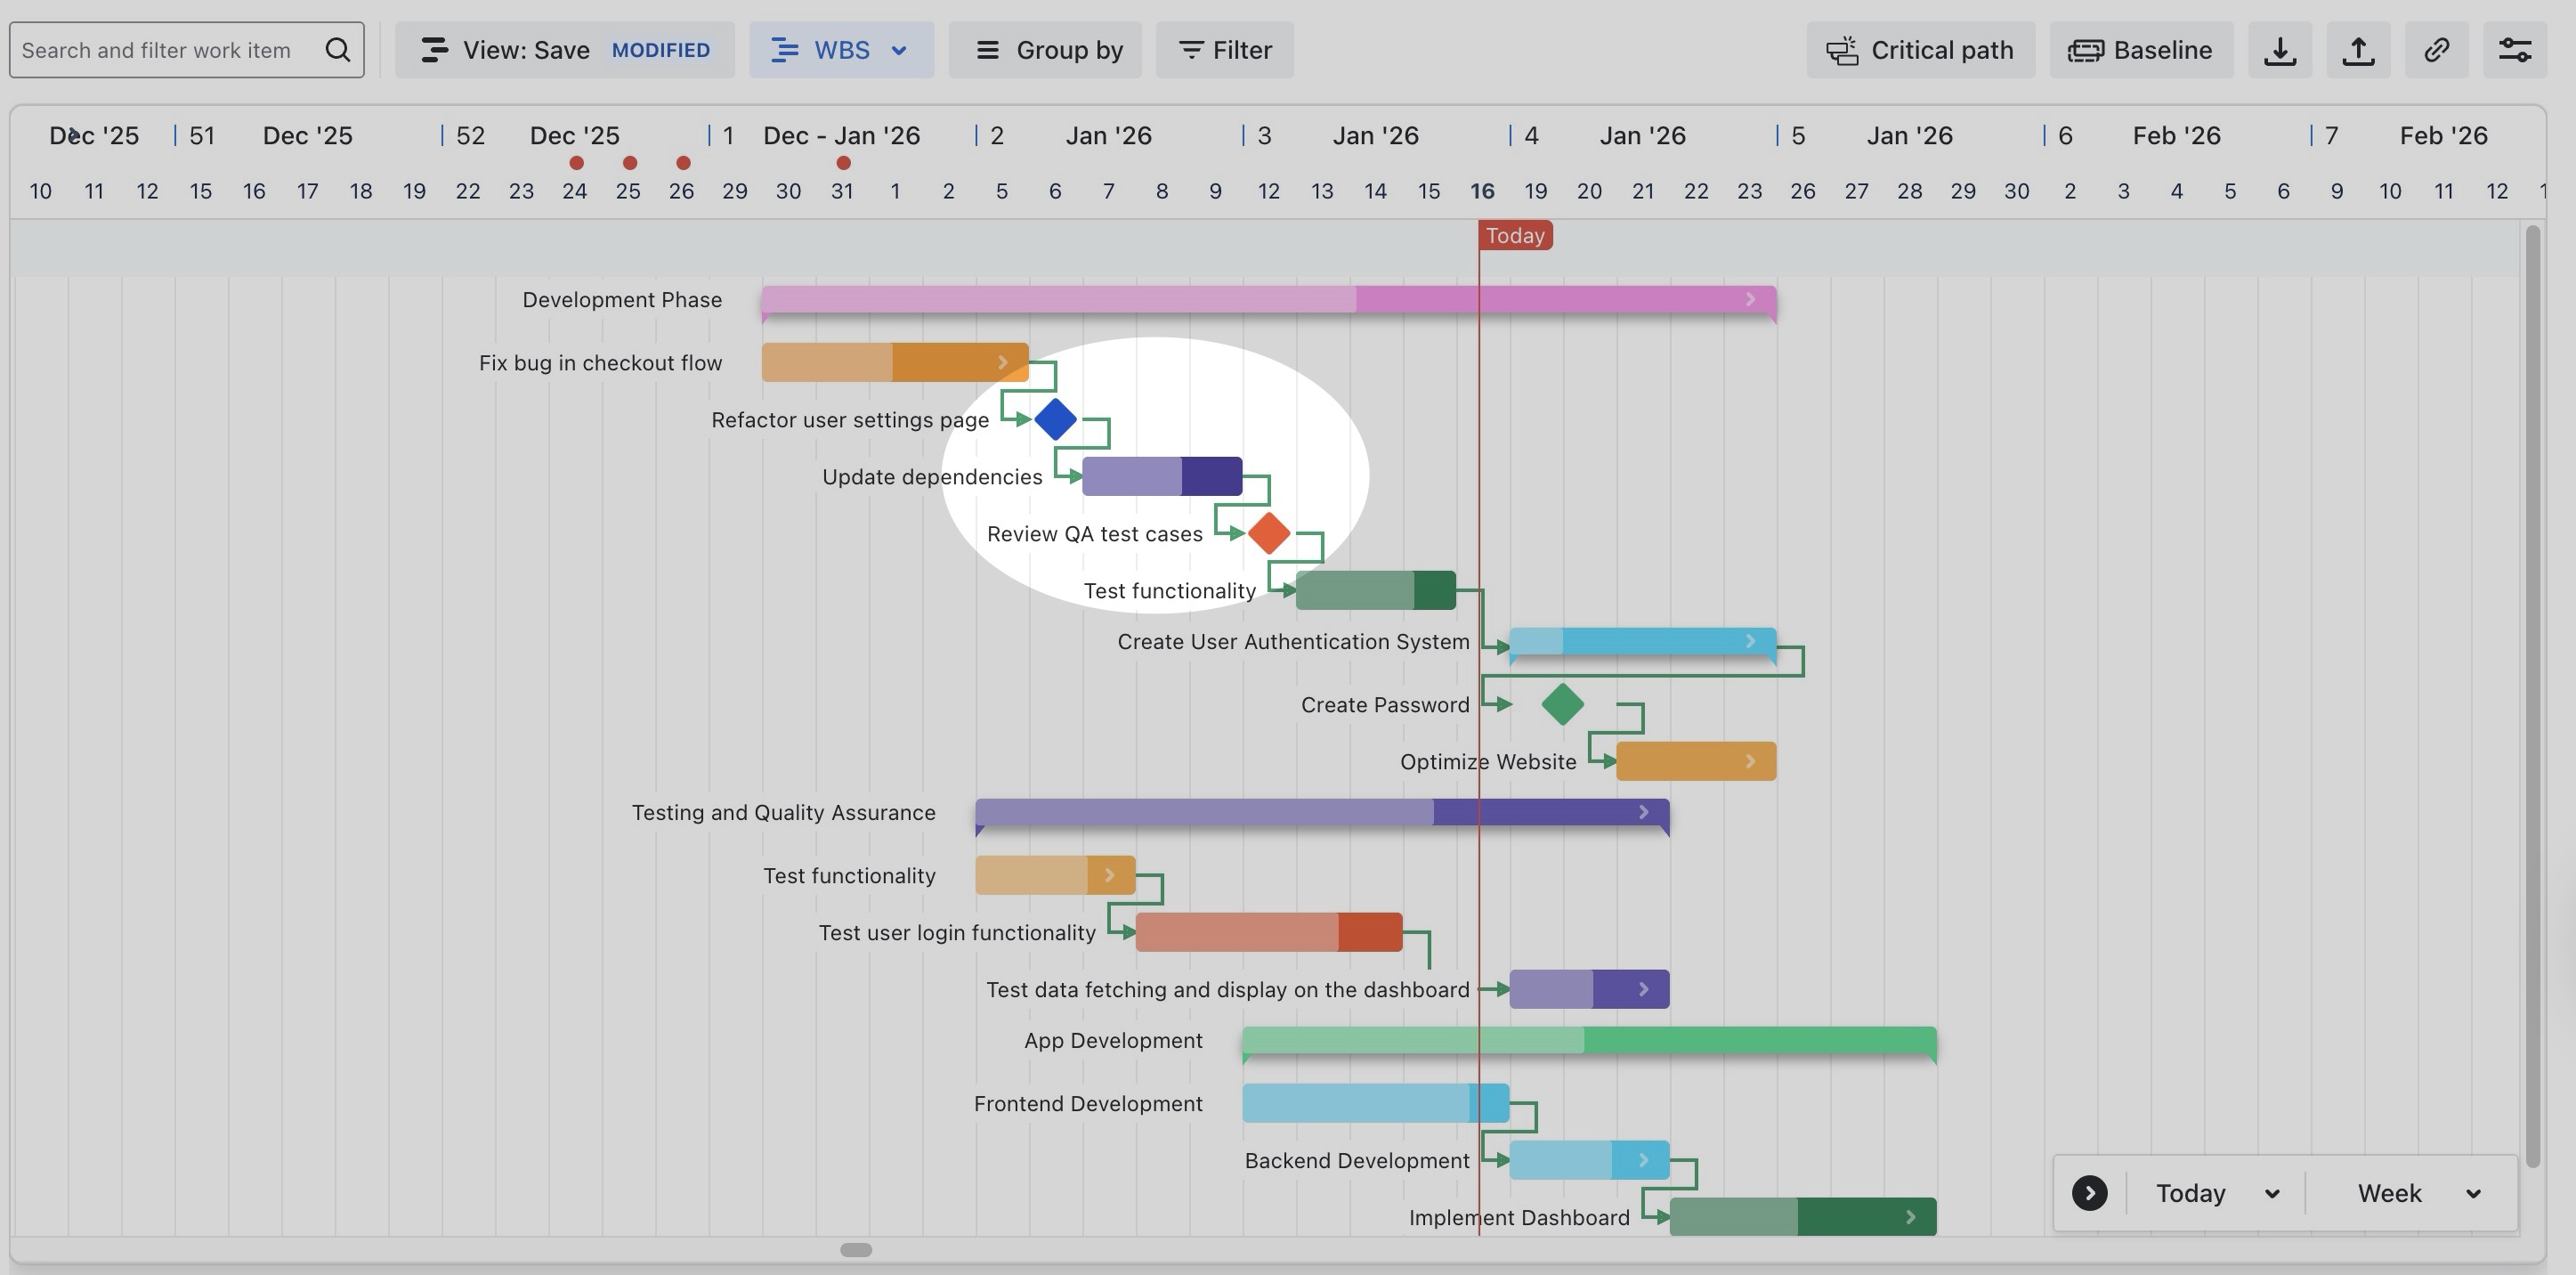
The Gantt view displays your project’s tasks on a visual timeline, with each task shown as a horizontal bar spanning its start and end dates. This allows you to easily see task durations, schedules, and dependencies.
In TeamBoard ProScheduler, the Gantt view enhances this with drag-and-drop editing, progress tracking, and advanced features like Critical path, Baselines, and Milestones, providing full control over your project plan.
Working on the Gantt
Planning tasks directly on the Gantt View
Click on a timeline cell or drag across multiple cells directly on the timeline to rapidly plan and adjust tasks.
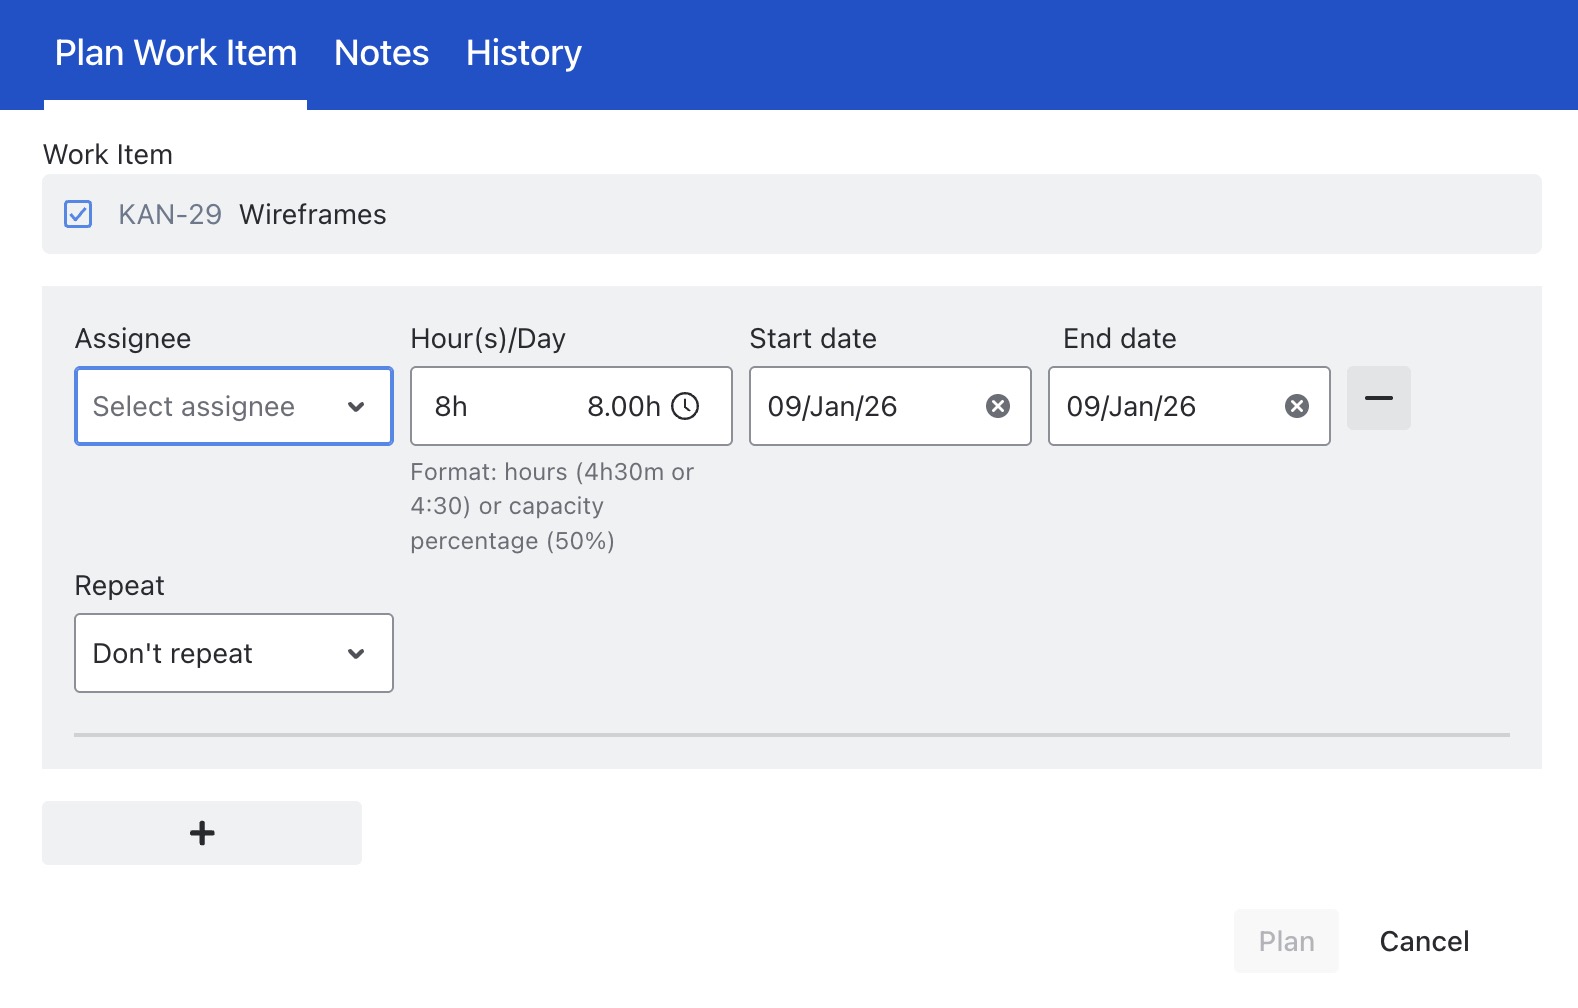
Planning tasks via Planning Dialog
Open the Planning dialog to focus on planning individual tasks with more detailed control.
Scheduling Tasks
Quickly adjust task start dates, end dates, and durations by dragging and dropping tasks directly on the Gantt view to fit your project timeline.
Creating dependencies
Link tasks to establish relationships and ensure proper sequencing.
Converting a task to a milestone
Mark key points in your project by converting tasks to milestones, shown as a 🔷 diamond on the timeline.
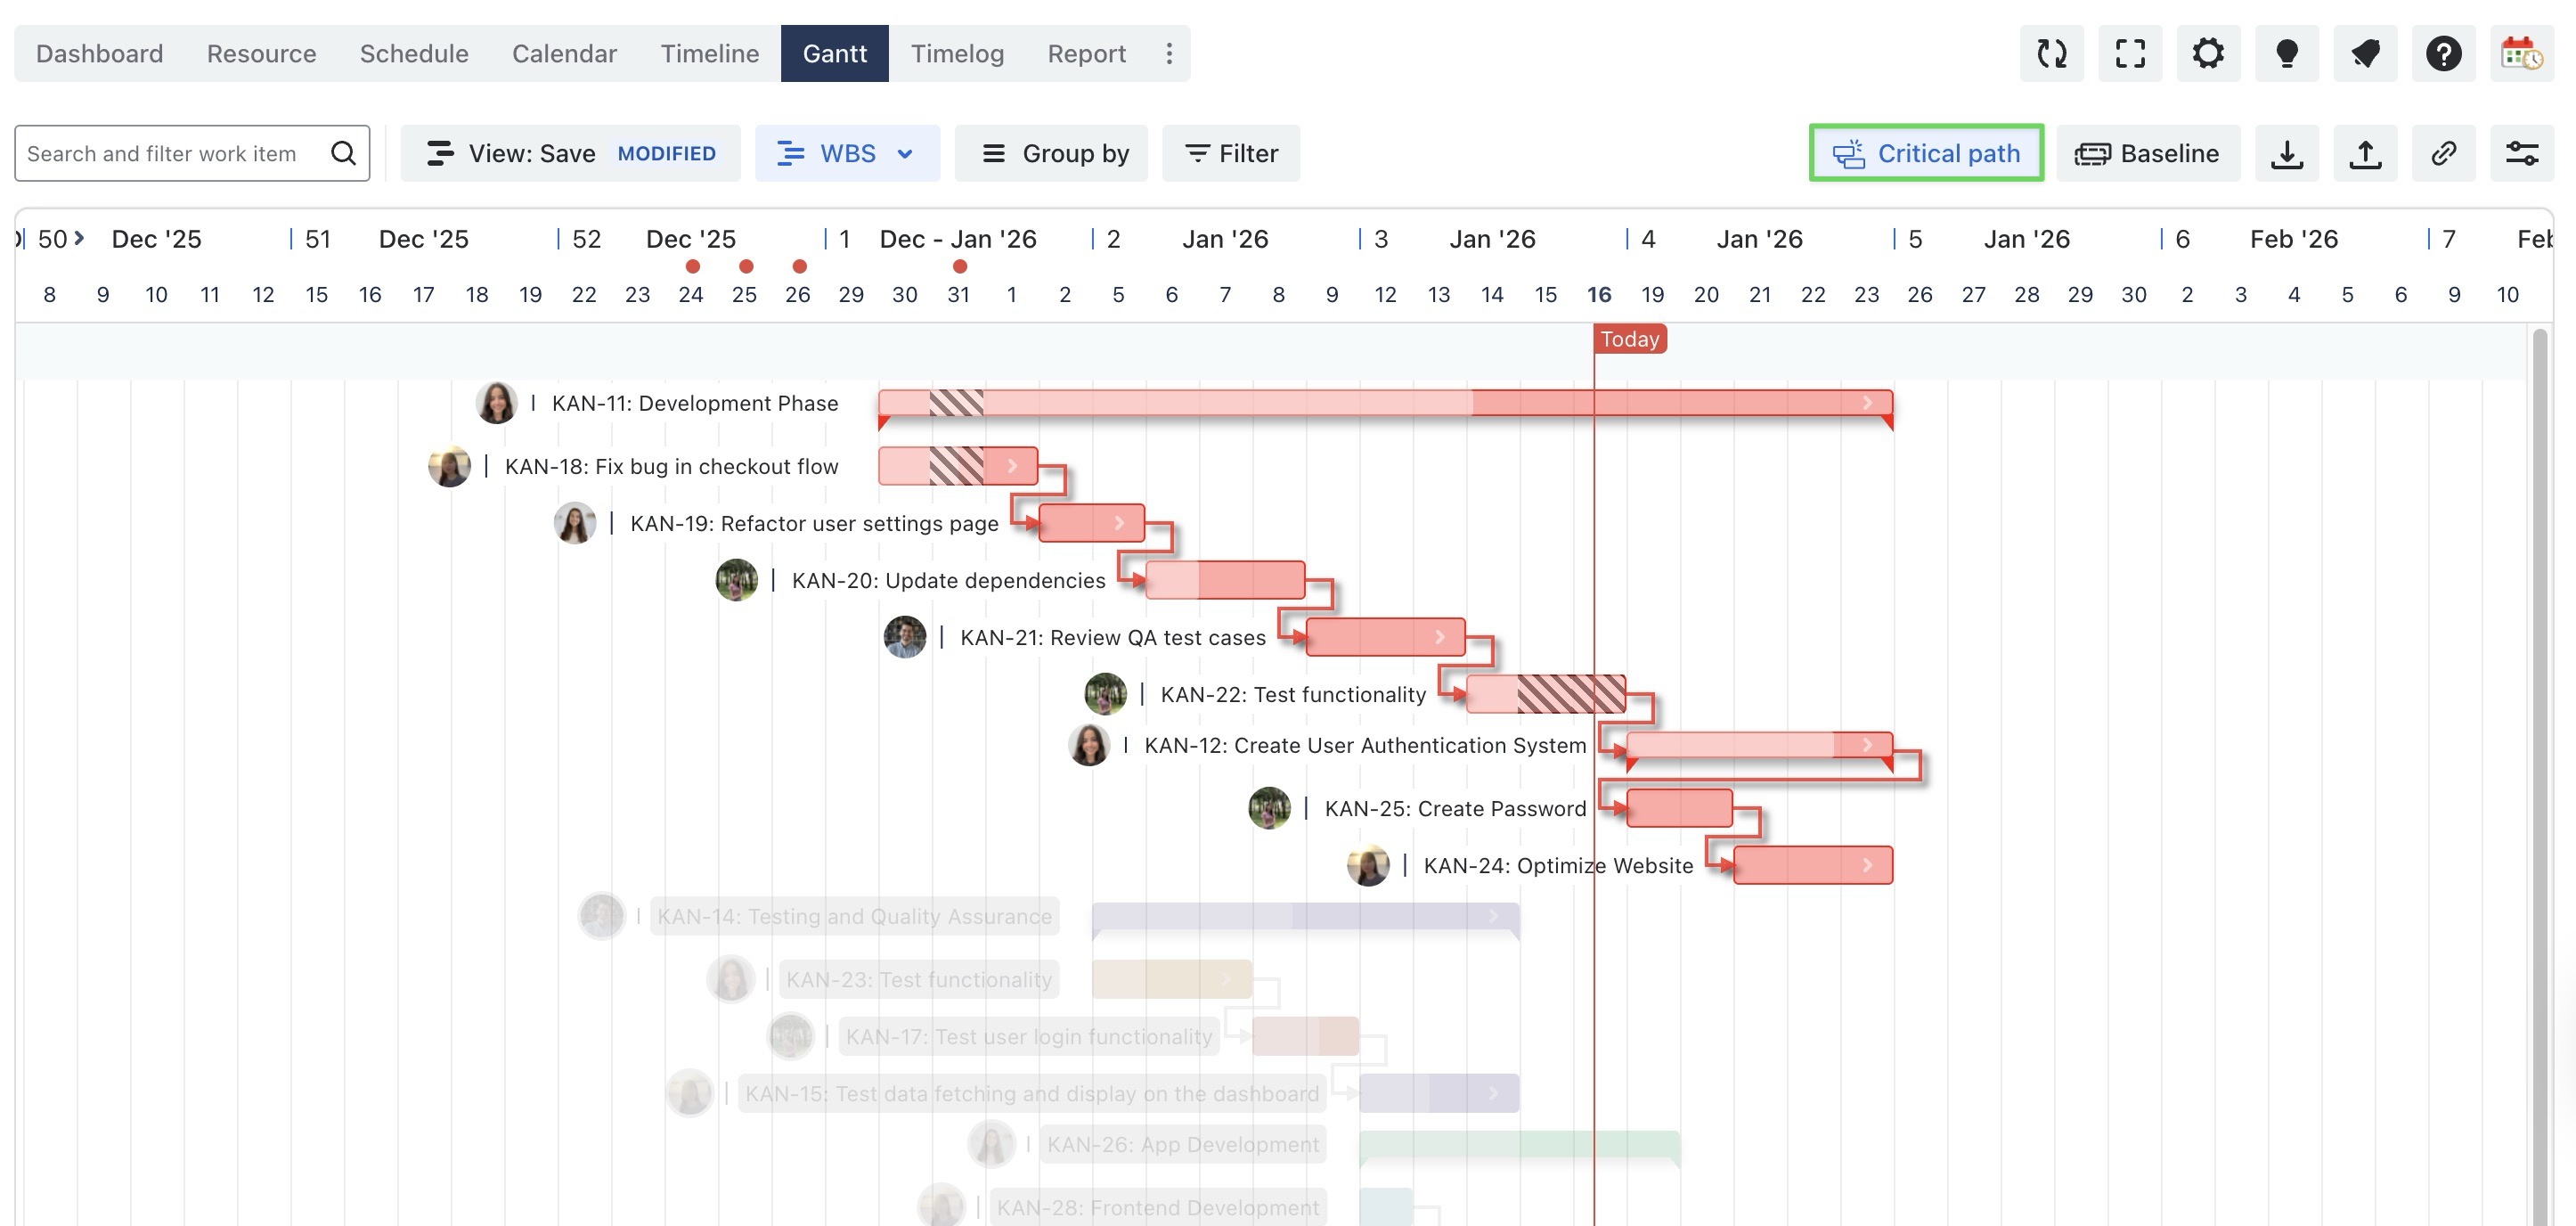
Identifying Critical Path
Highlight the sequence of tasks that determines the minimum project duration to focus on essential activities.
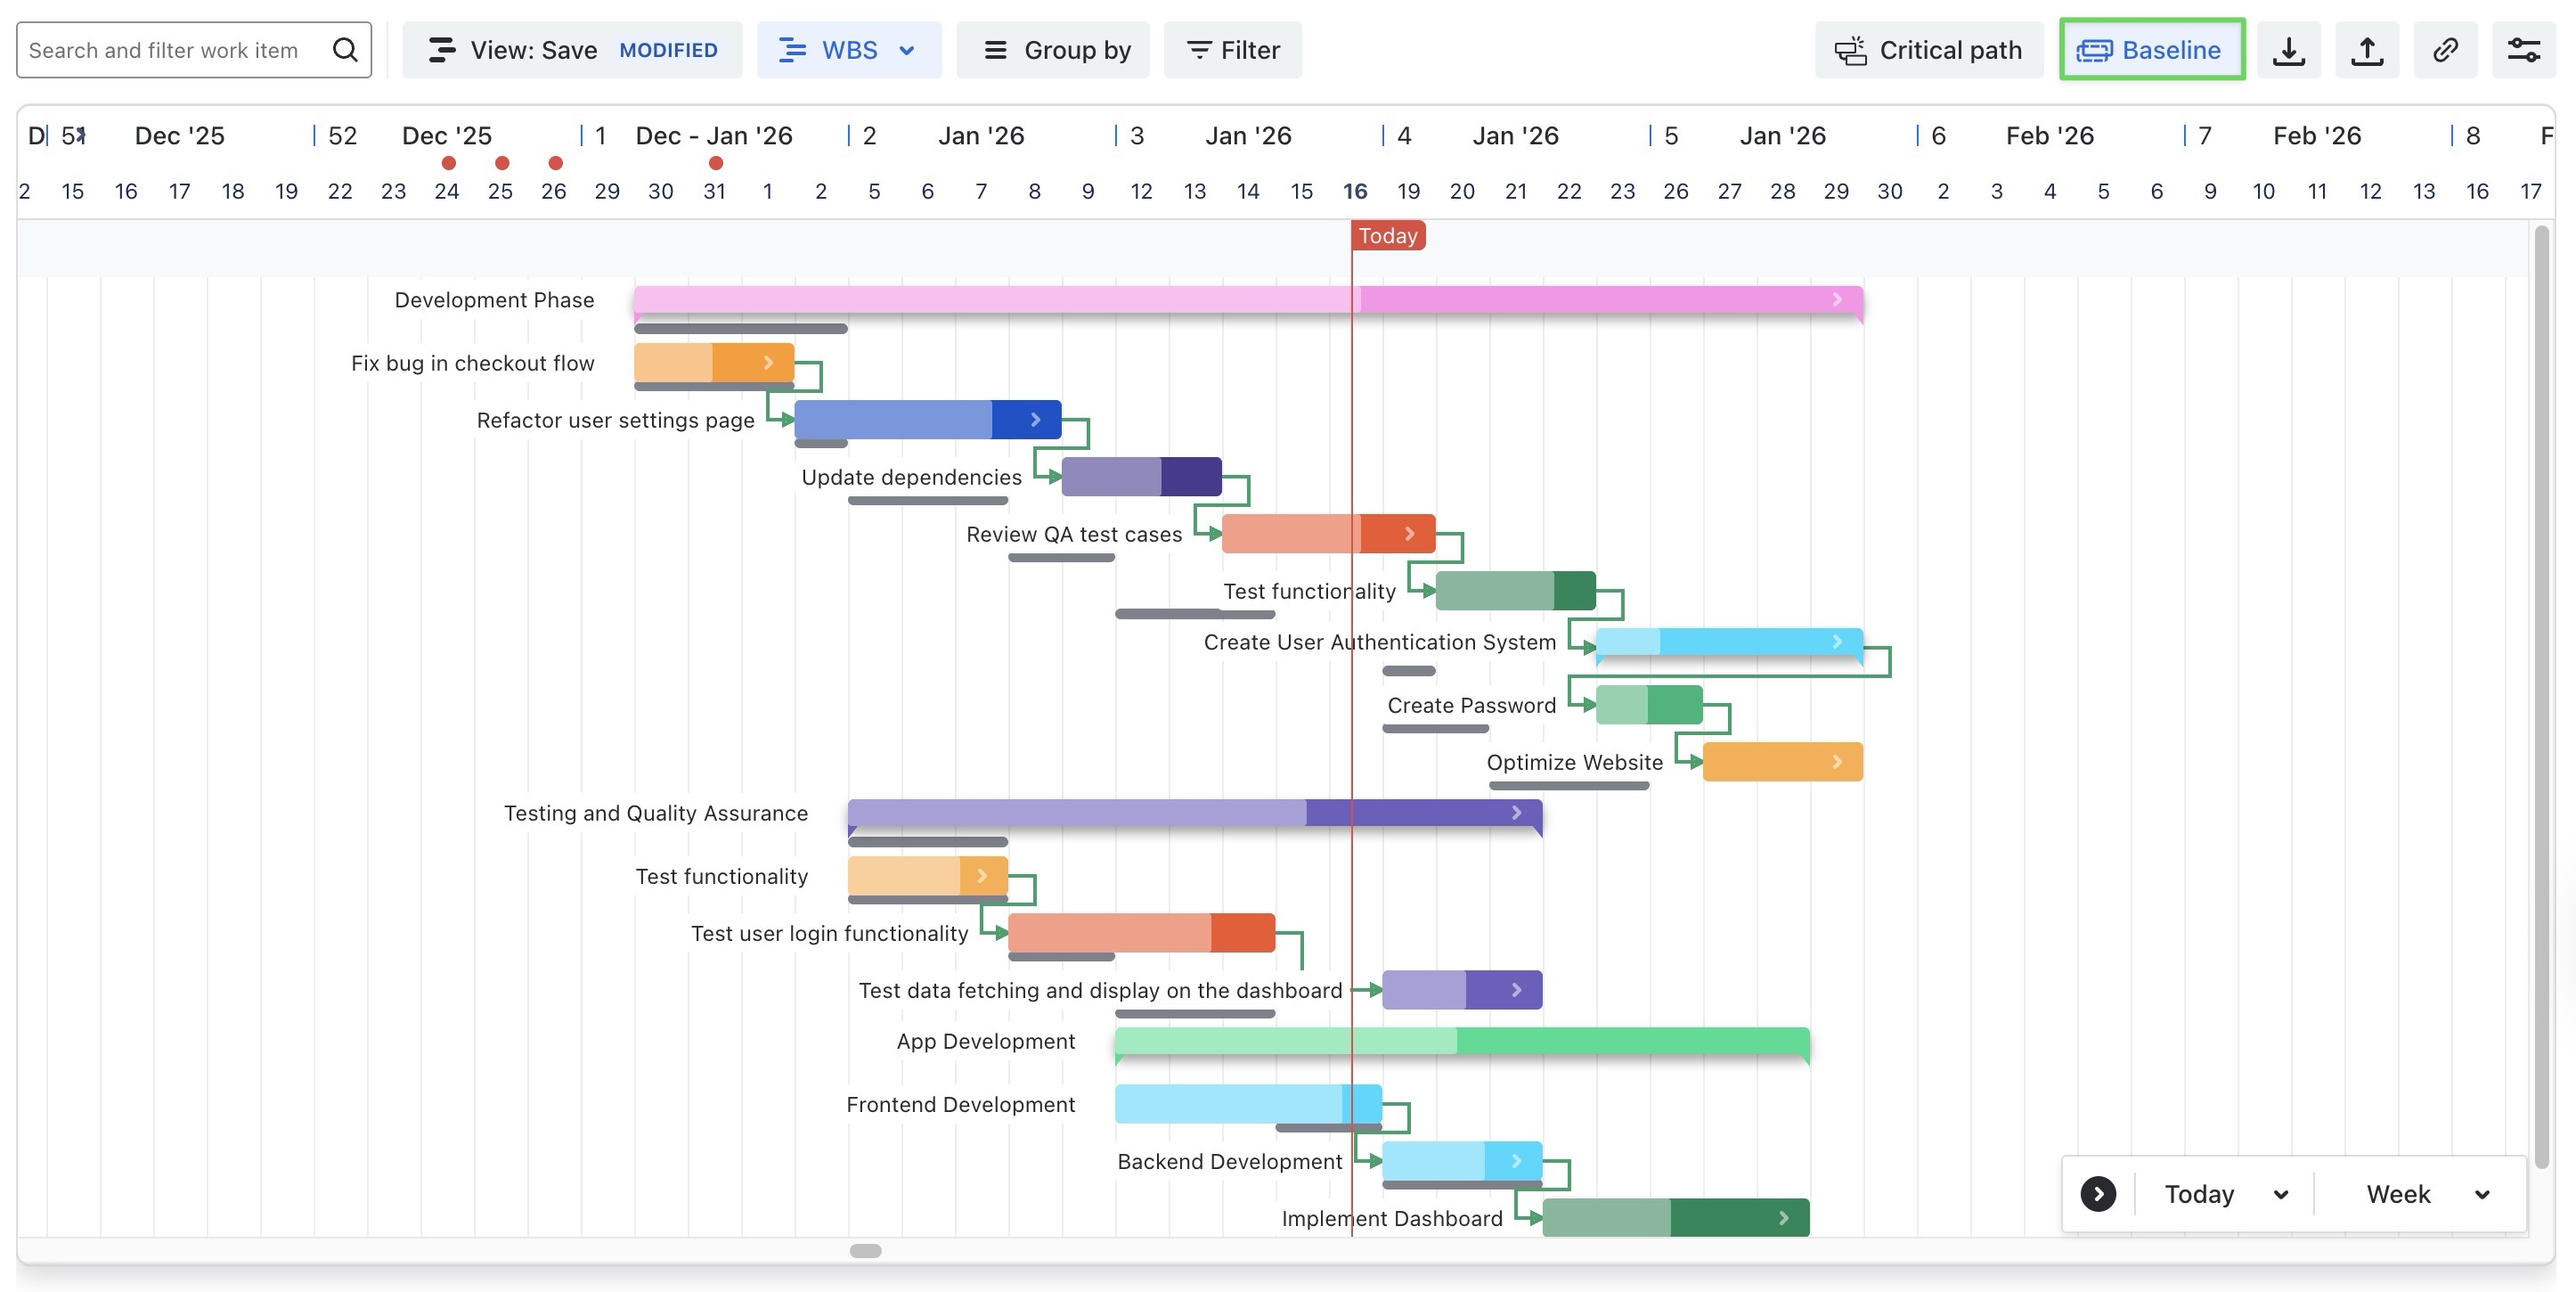
Tracking Baselines
Capture and compare your current progress against the original plan to monitor schedule deviations.
Displays progress on taskbars, with color fill visually representing the completion level.
The percentage is calculated using different methods, depending on the configuration set in the app.
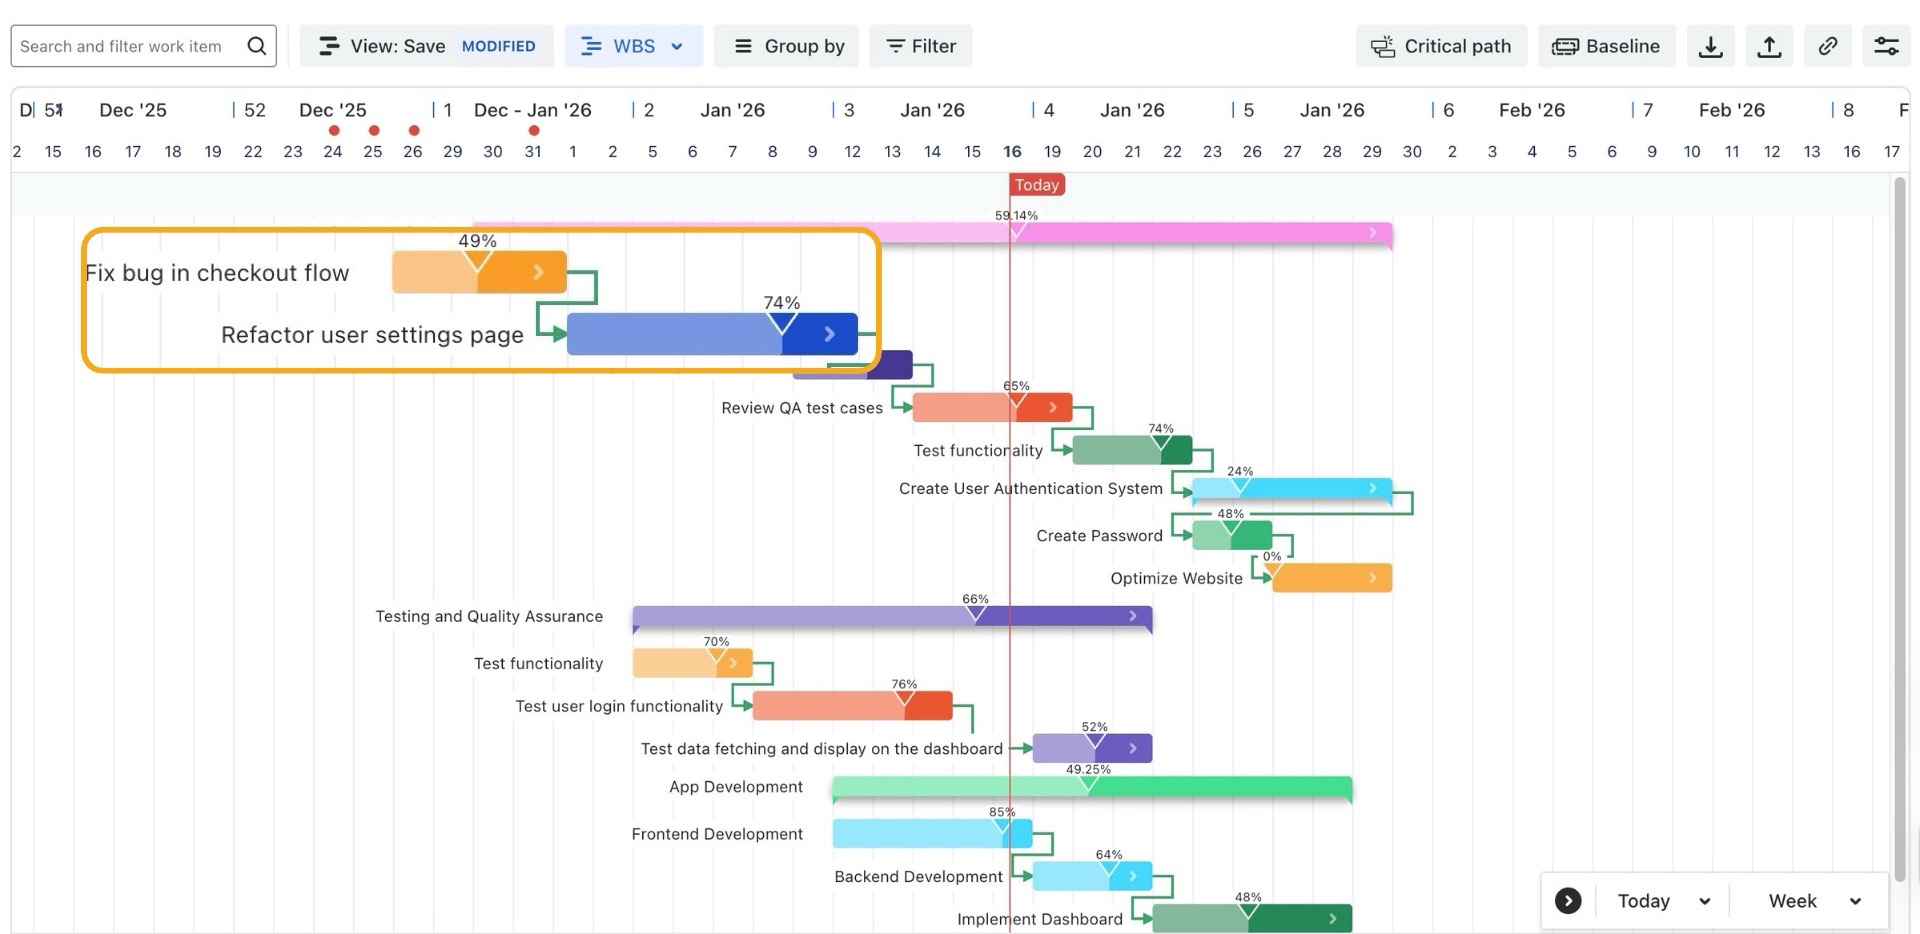
Show all plans
Users can expand a task bar on the Gantt chart to view its sub-plans and multiple assignees, instead of only showing the main task bar.