.png)
Dashboard widgets let you choose which metrics appear on your Dashboard, including workload, capacity, scheduling, and time data. You can add, configure, resize, and arrange widgets to create a layout that supports how you review and manage work.
TimePlanner provides widget templates for monitoring personal time, workload, capacity, timesheets, project effort, and leave. Select the widget that matches the information you want to track, then configure its projects, members, team, and reporting period.
Personal Time Management
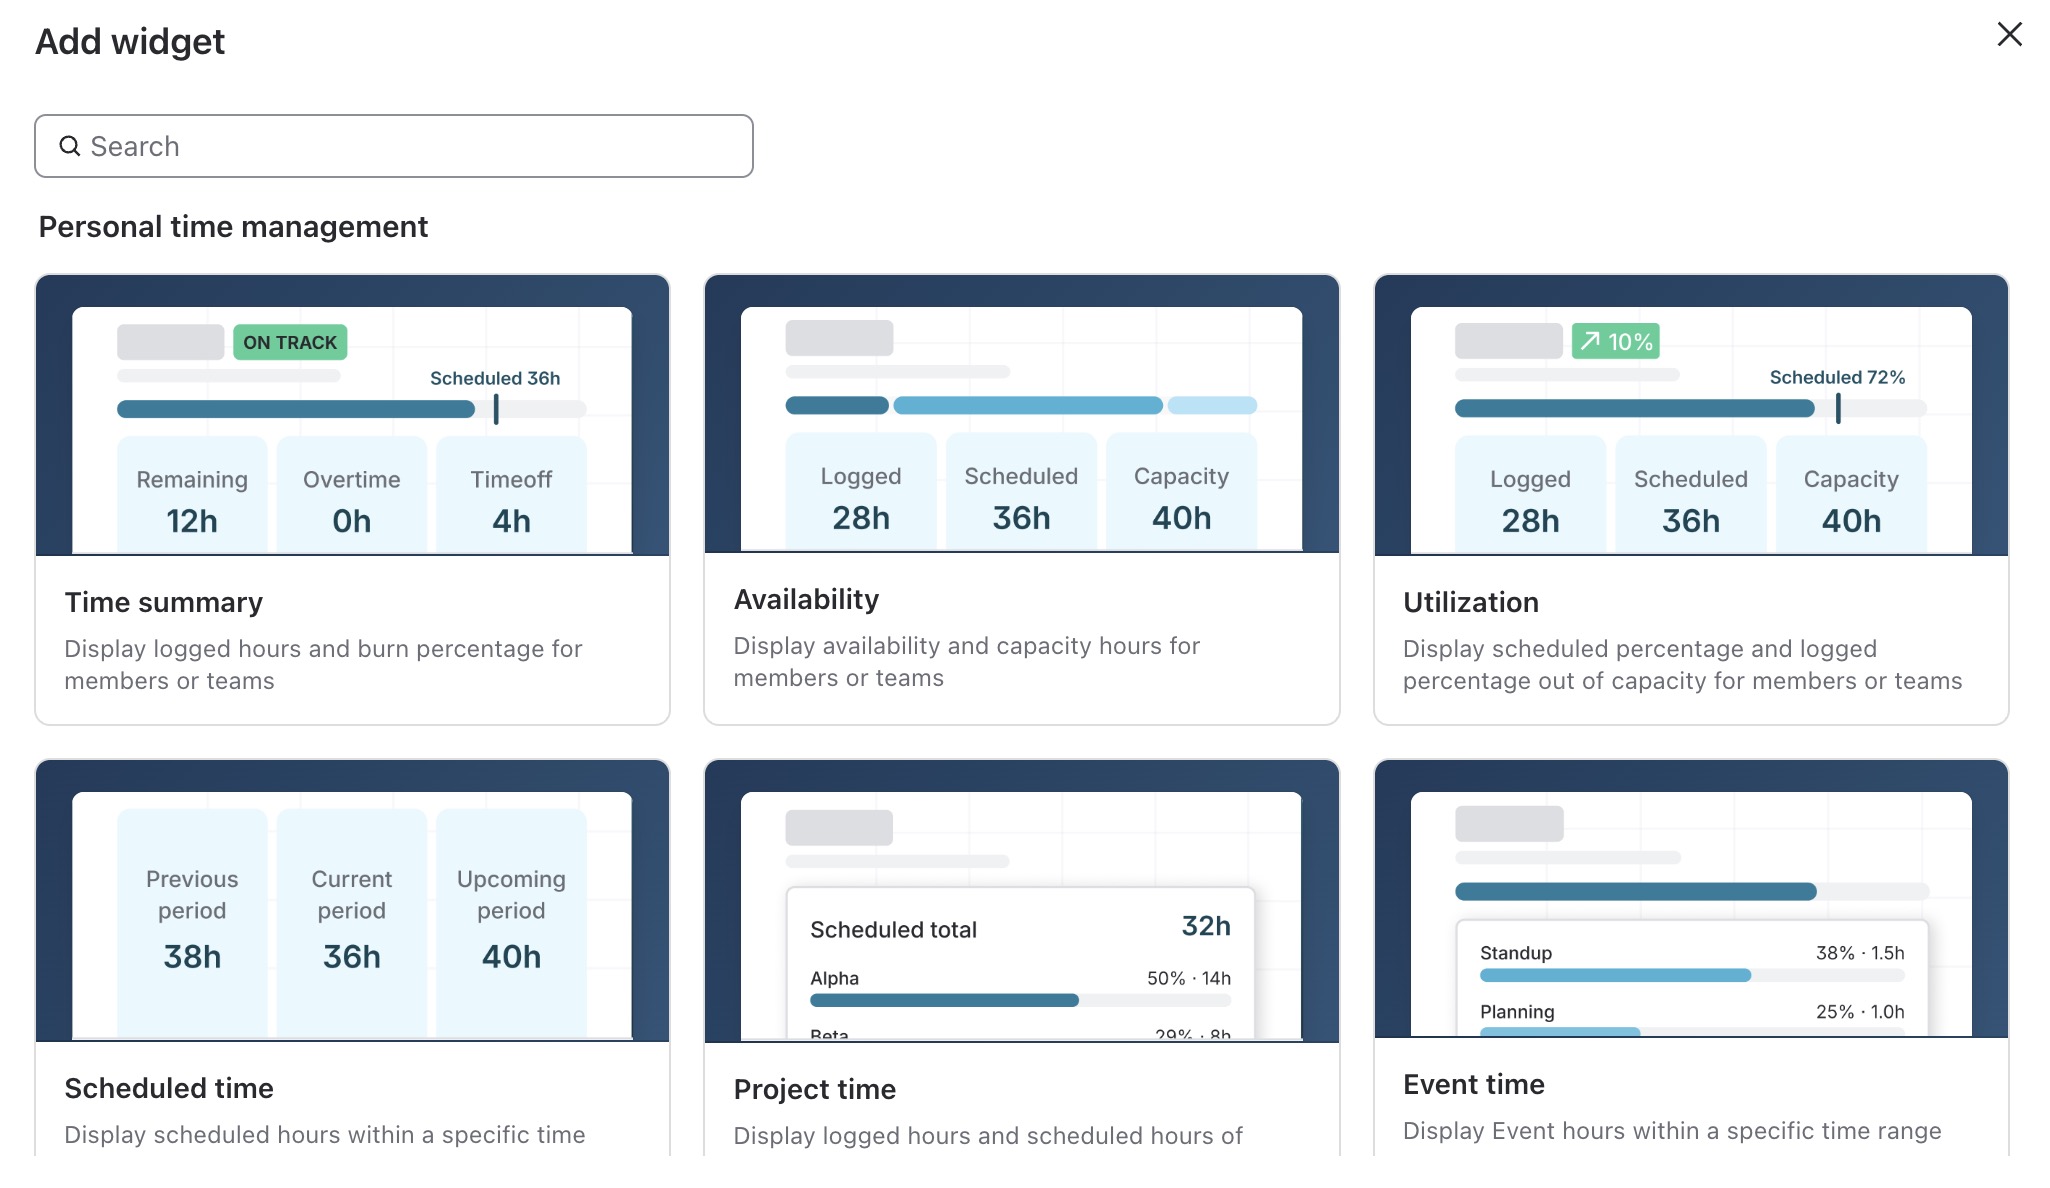
Time Summary
Provides a high-level view of logged time against available capacity. It can also show remaining capacity, overtime, time off, and scheduled progress for selected members or a team.
Availability
Shows how capacity is distributed between logged time, scheduled time, and remaining availability. Use it to identify who still has room for additional work.
Utilization
Measures scheduled and logged time as a percentage of available capacity. It helps you identify underutilized resources and members whose workload is approaching or exceeding capacity.
Scheduled Time
Compares scheduled hours across the previous, current, and upcoming periods. Use it to understand how workload is changing over time and anticipate future demand.
Project Time
Displays logged and scheduled hours by project for selected members or a team. It helps you see where working time is being allocated.
Event Time
Shows the hours assigned to different event types within a selected period, such as meetings, planning sessions, or internal activities.
Workload and Capacity
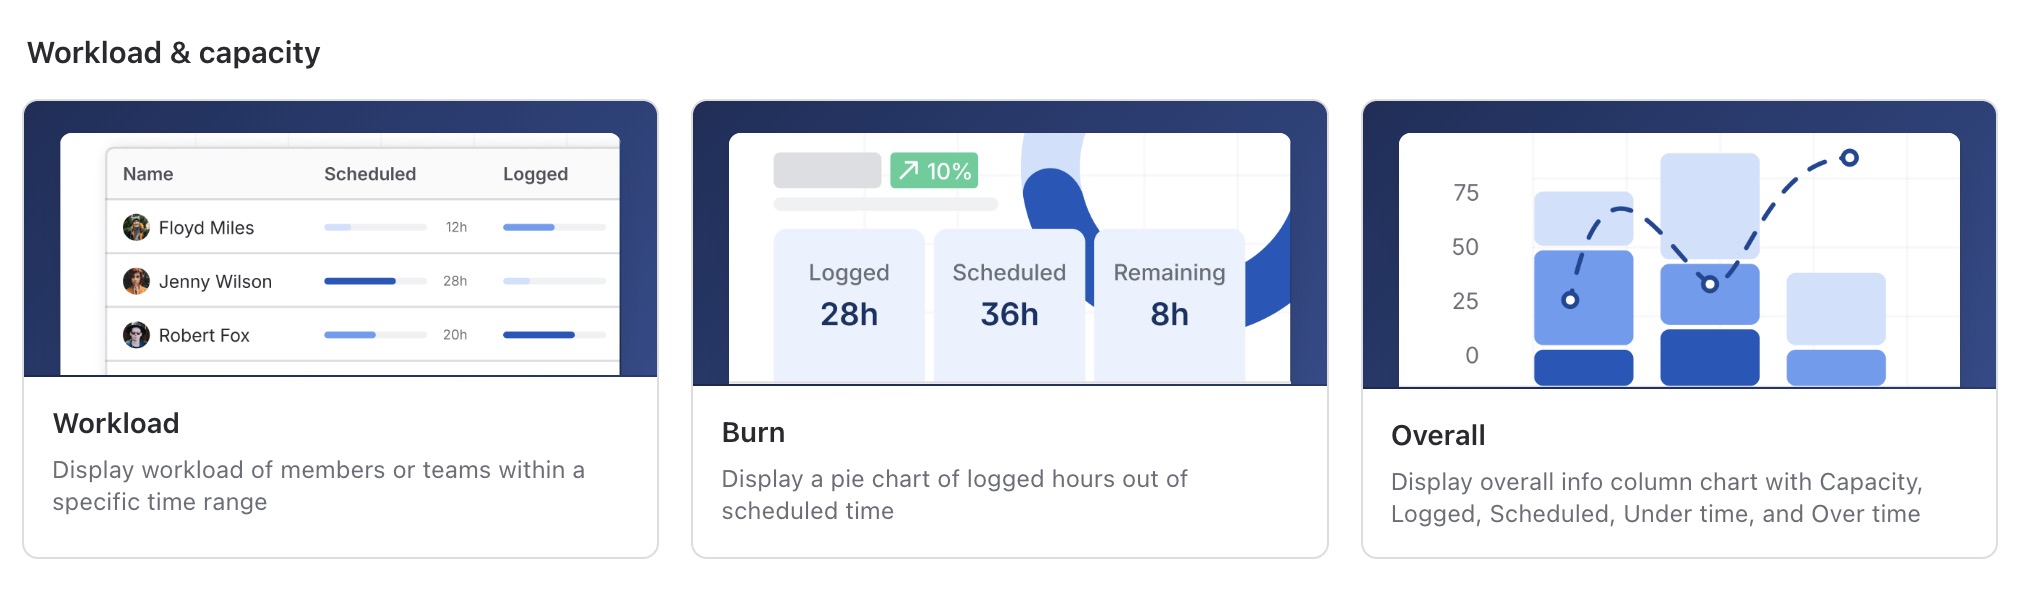
Workload
Displays the capacity, scheduled time, logged time, and utilization of selected members or a team. Use it to identify workload imbalances and potential over-allocation.
Burn
Shows logged time as a proportion of scheduled time in a visual chart. It helps you understand how much planned work has already been completed or recorded.
Overall
Provides a combined view of key resource metrics, including capacity, logged time, scheduled time, undertime, and overtime. Use it for a broader comparison of workload and time usage.
Time Tracking and Reporting
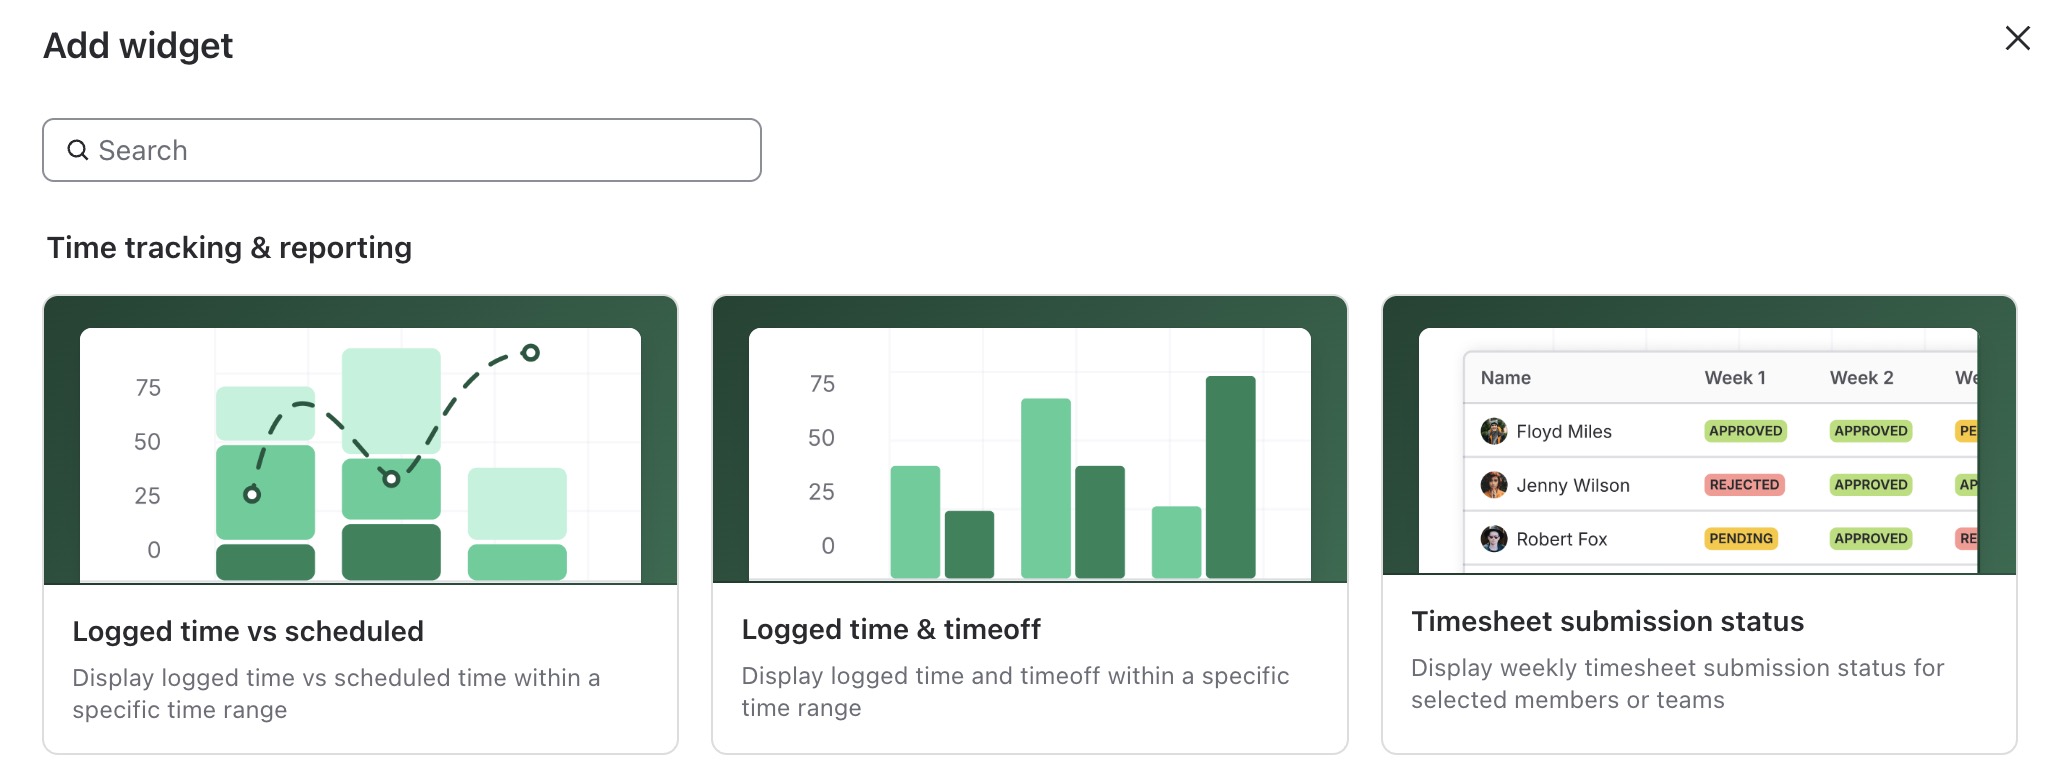
Logged Time vs Scheduled
Compares logged hours with scheduled hours within a selected period. It helps you identify differences between planned effort and actual time spent.
Logged Time and Time Off
Displays logged working time alongside recorded time off. Use it to understand how attendance and leave affect the total time available during a period.
Timesheet Submission Status
Shows the weekly timesheet status of selected members or teams, such as approved, pending, rejected, or not submitted. It helps managers follow up on incomplete or unresolved timesheets.
Financial and Project Insights
Project Time Breakdown
Displays logged hours by project as a donut chart. Use it to understand how effort is distributed across projects and where the most time is being spent.
Leave and Attendance
Time Off
Provides a time-off report for selected members or teams. It helps you review leave duration and compare absences across resources.