.png)
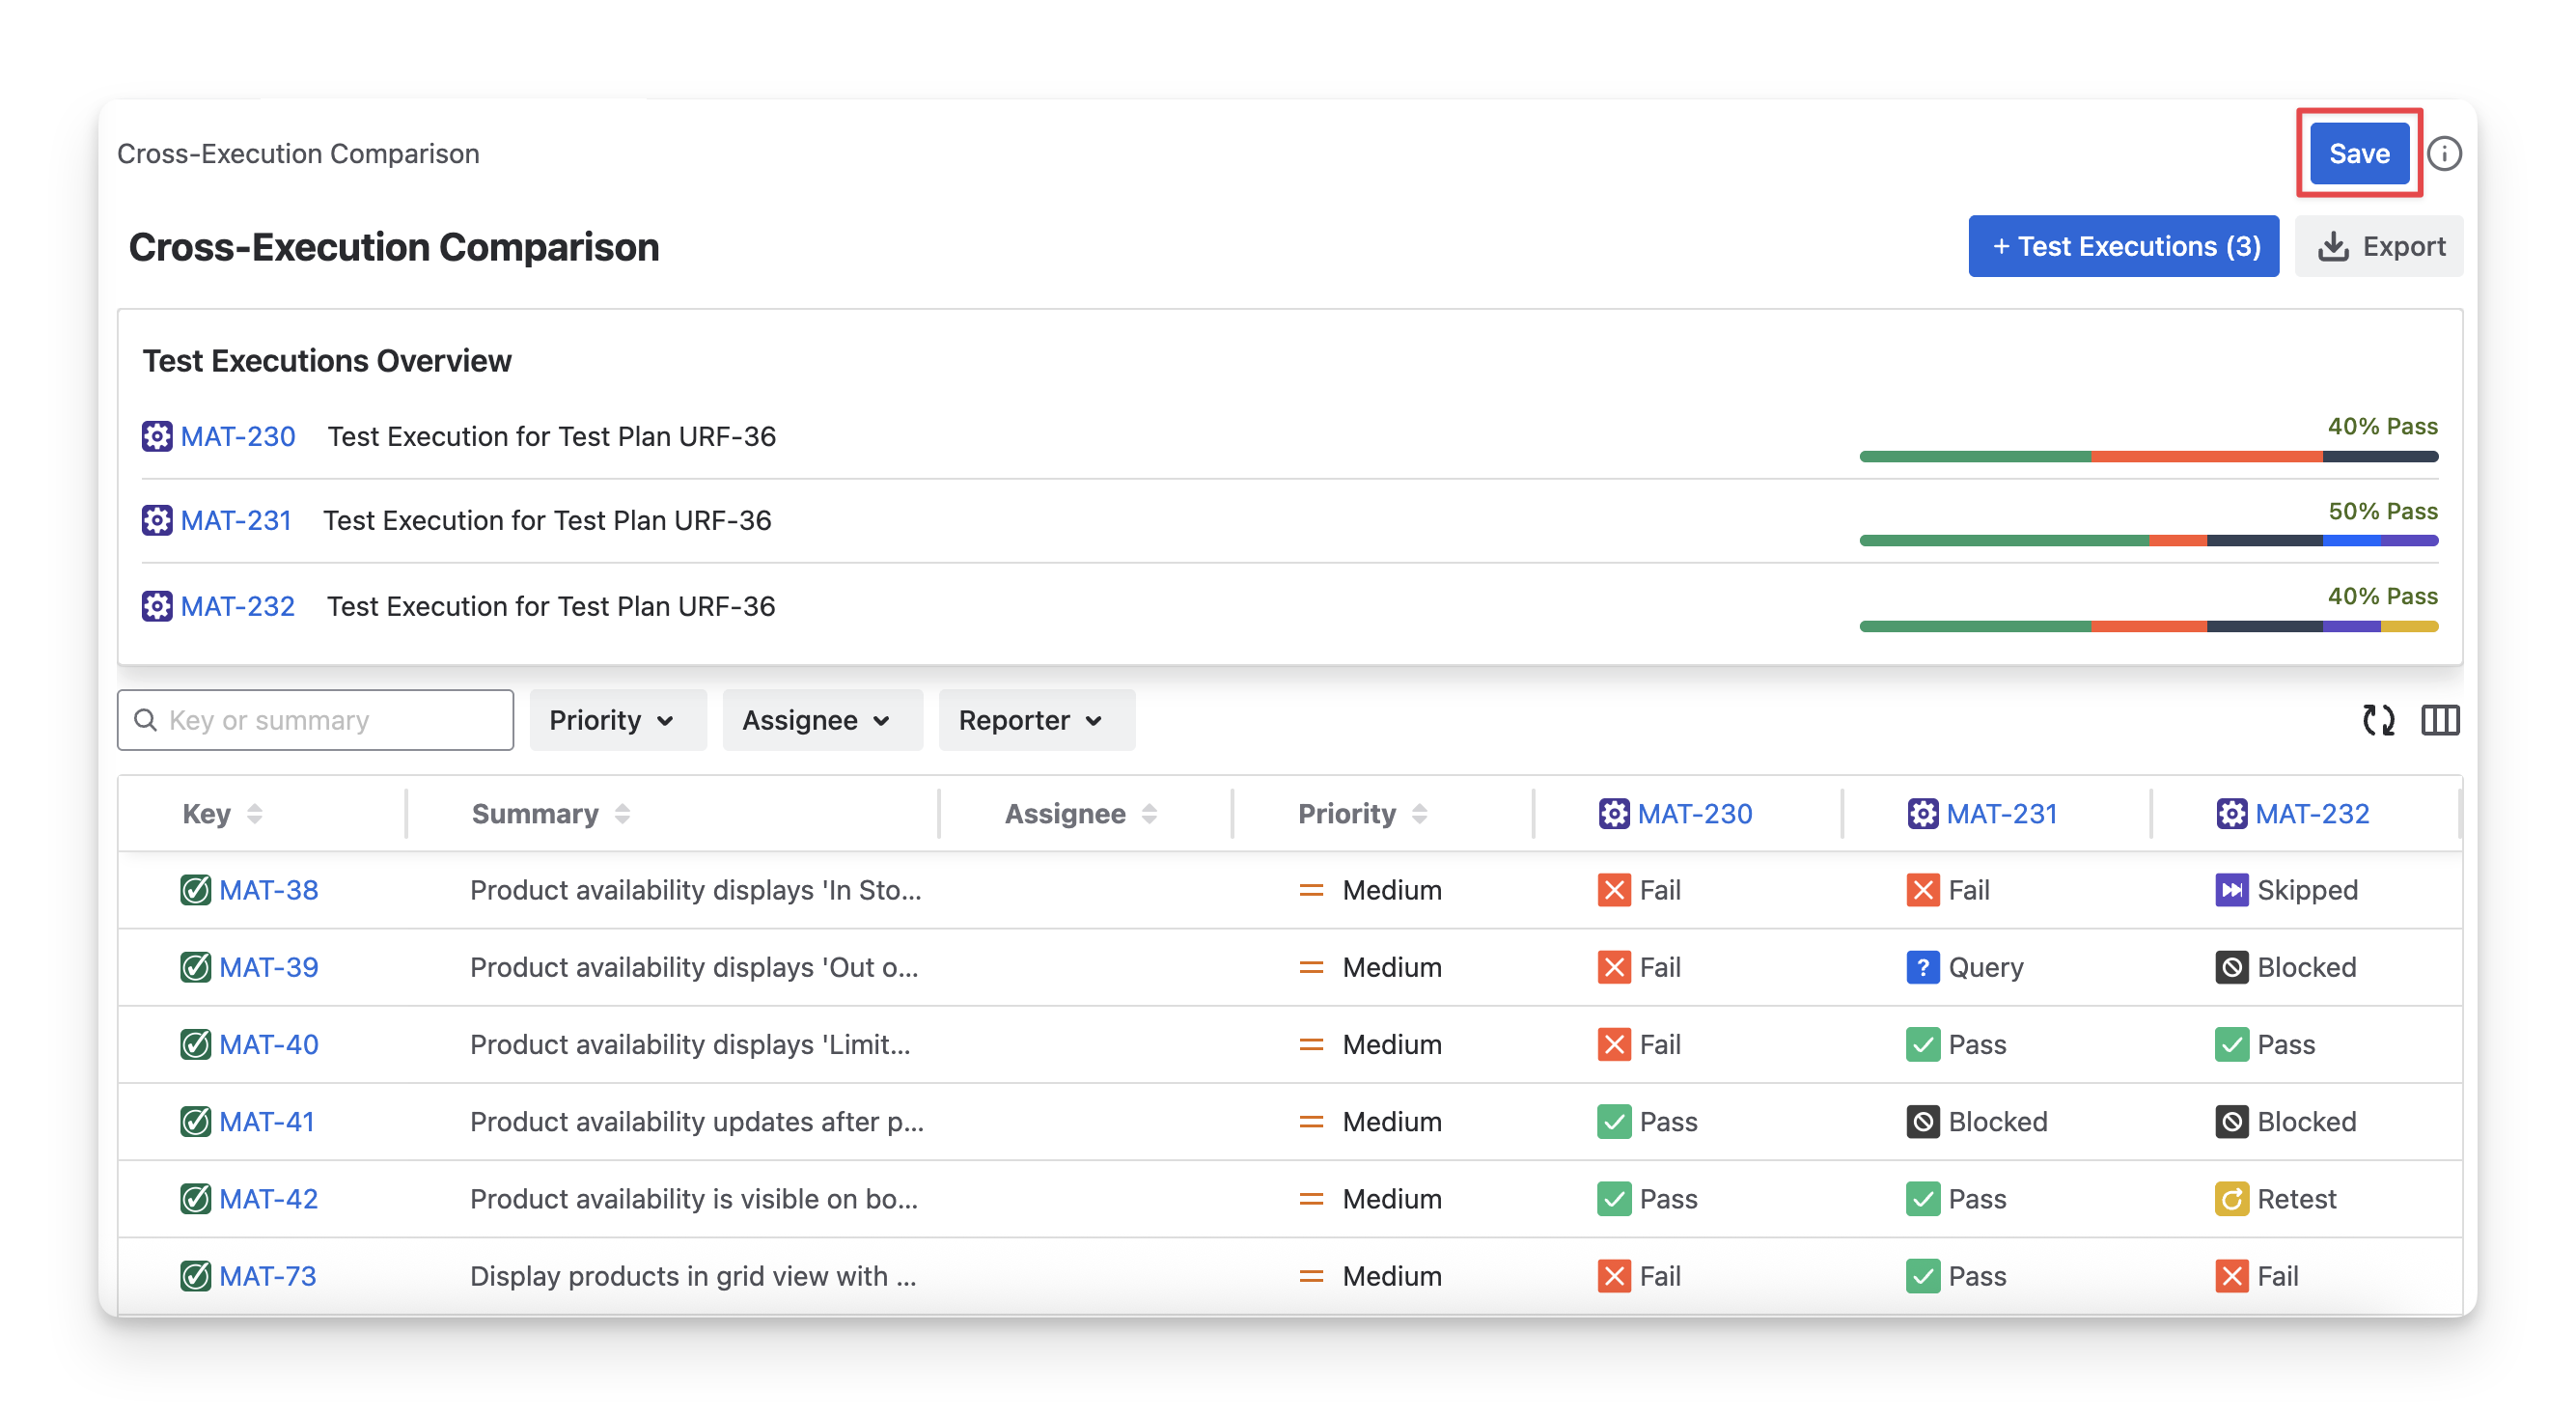
The Cross-Execution Comparison Report in AgileTest lets teams compare test case results across multiple executions side by side. It helps track test case status by different executions or members, enabling teams to quickly spot changes, regressions, or improvements over time.
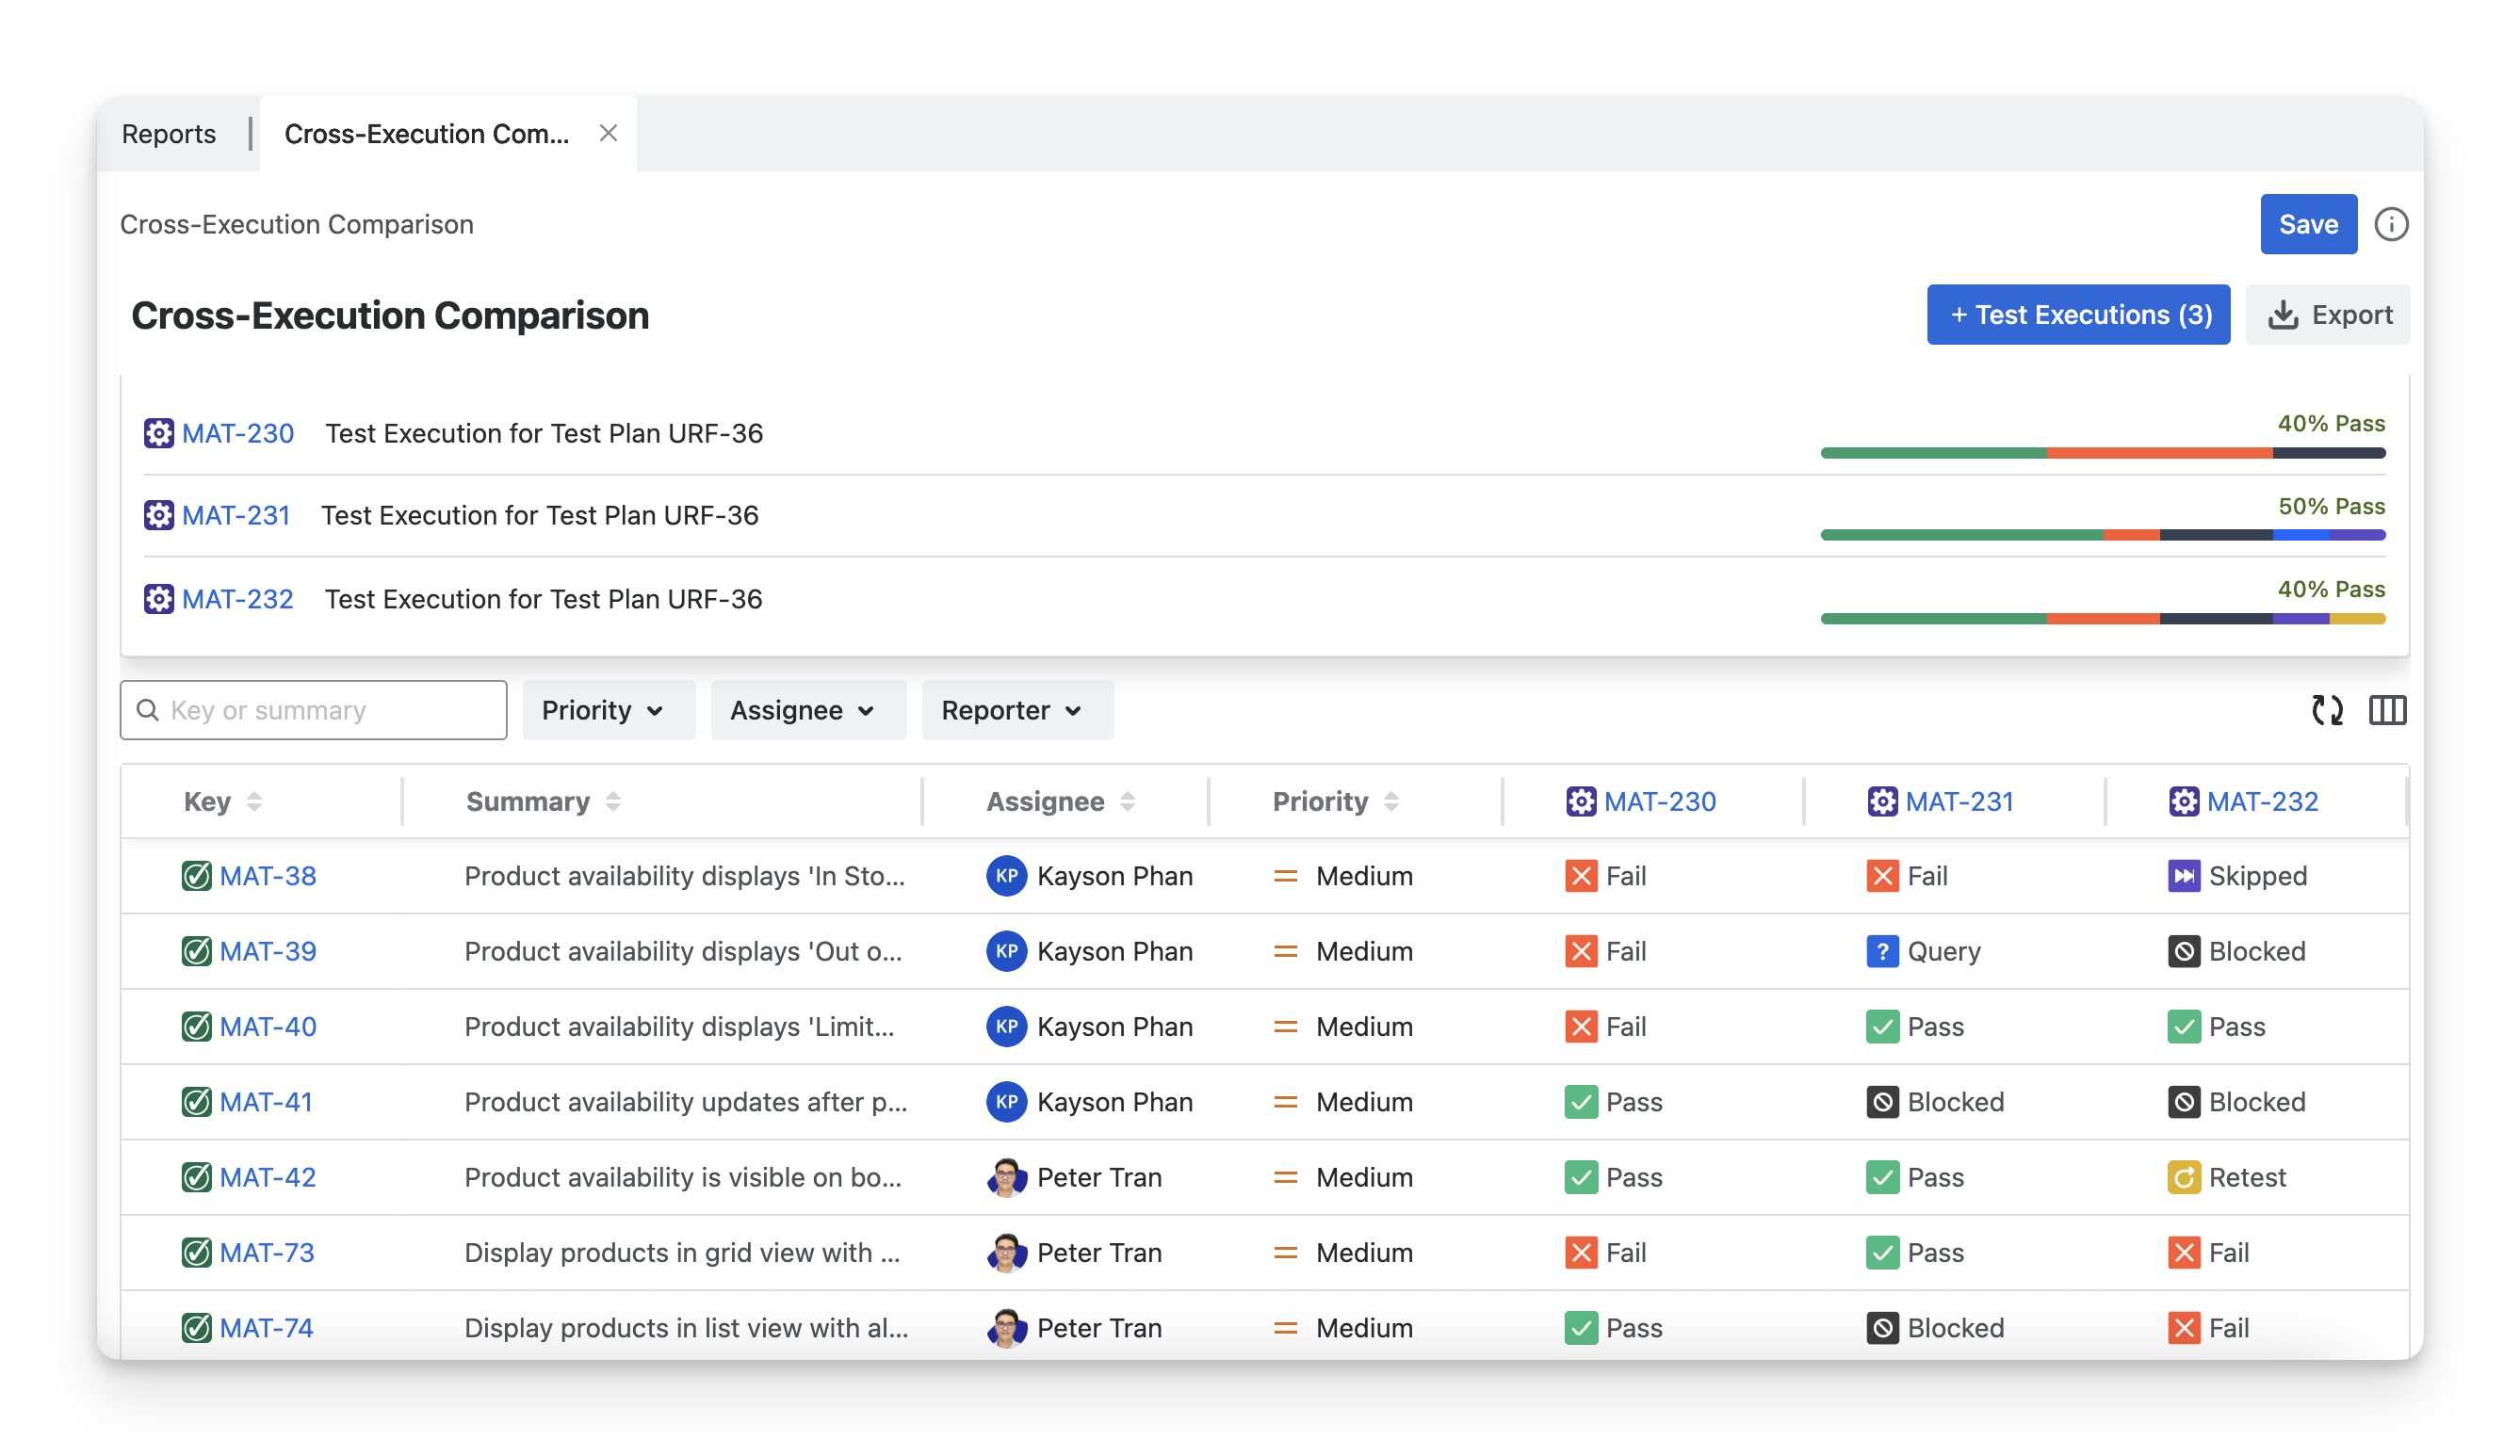
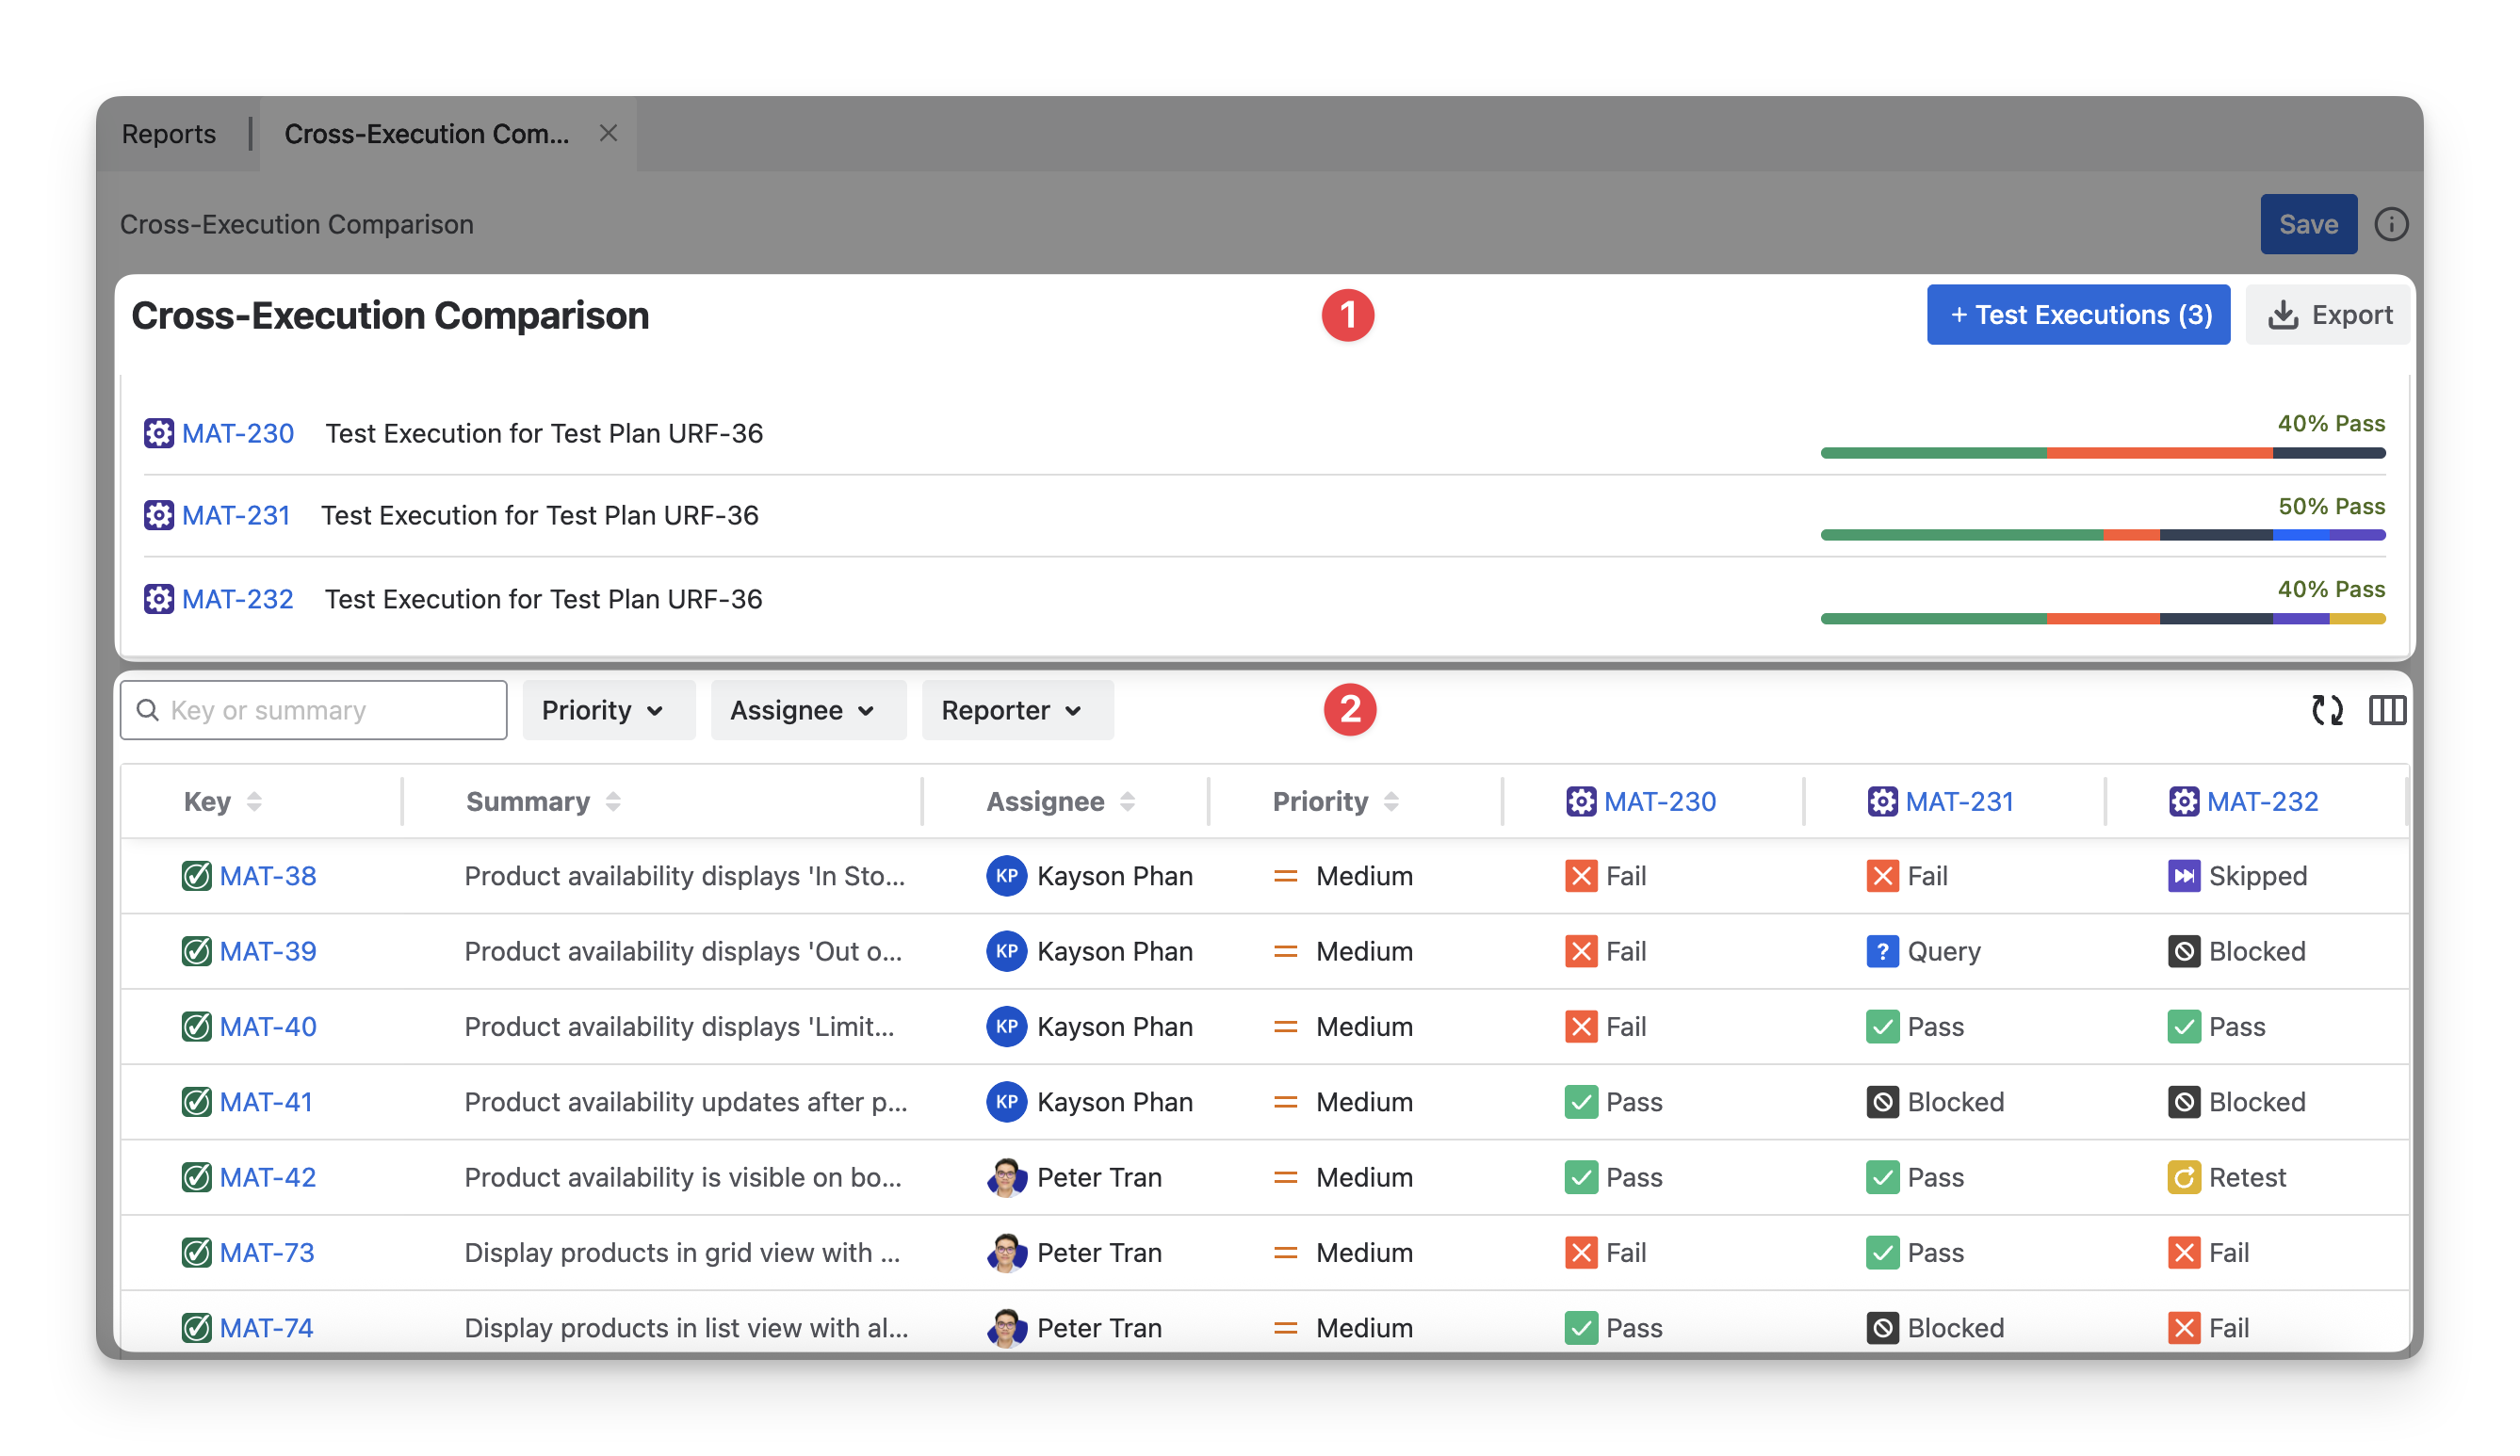
In each Cross-Execution Comparison Report, you will see 2 main sections:
-
Test Executions Overview: A summary of key information and execution status for the selected test executions in the report.
-
Execution Comparison Table: A detailed table that compares the execution results of each test case across the selected test executions.
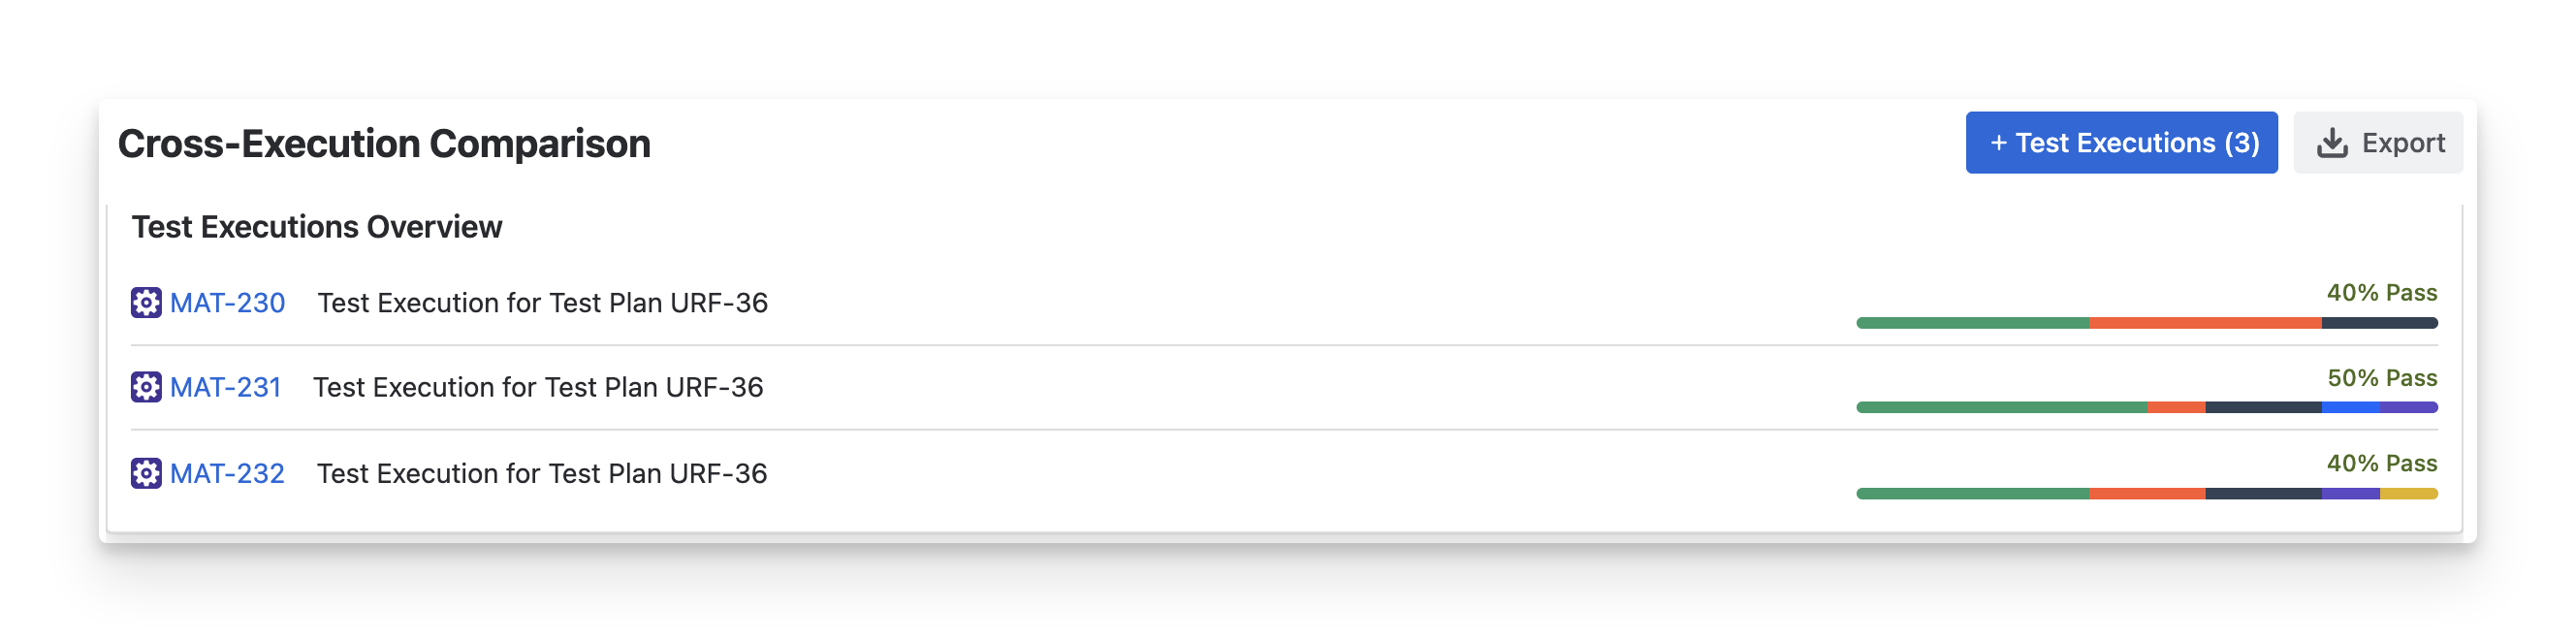
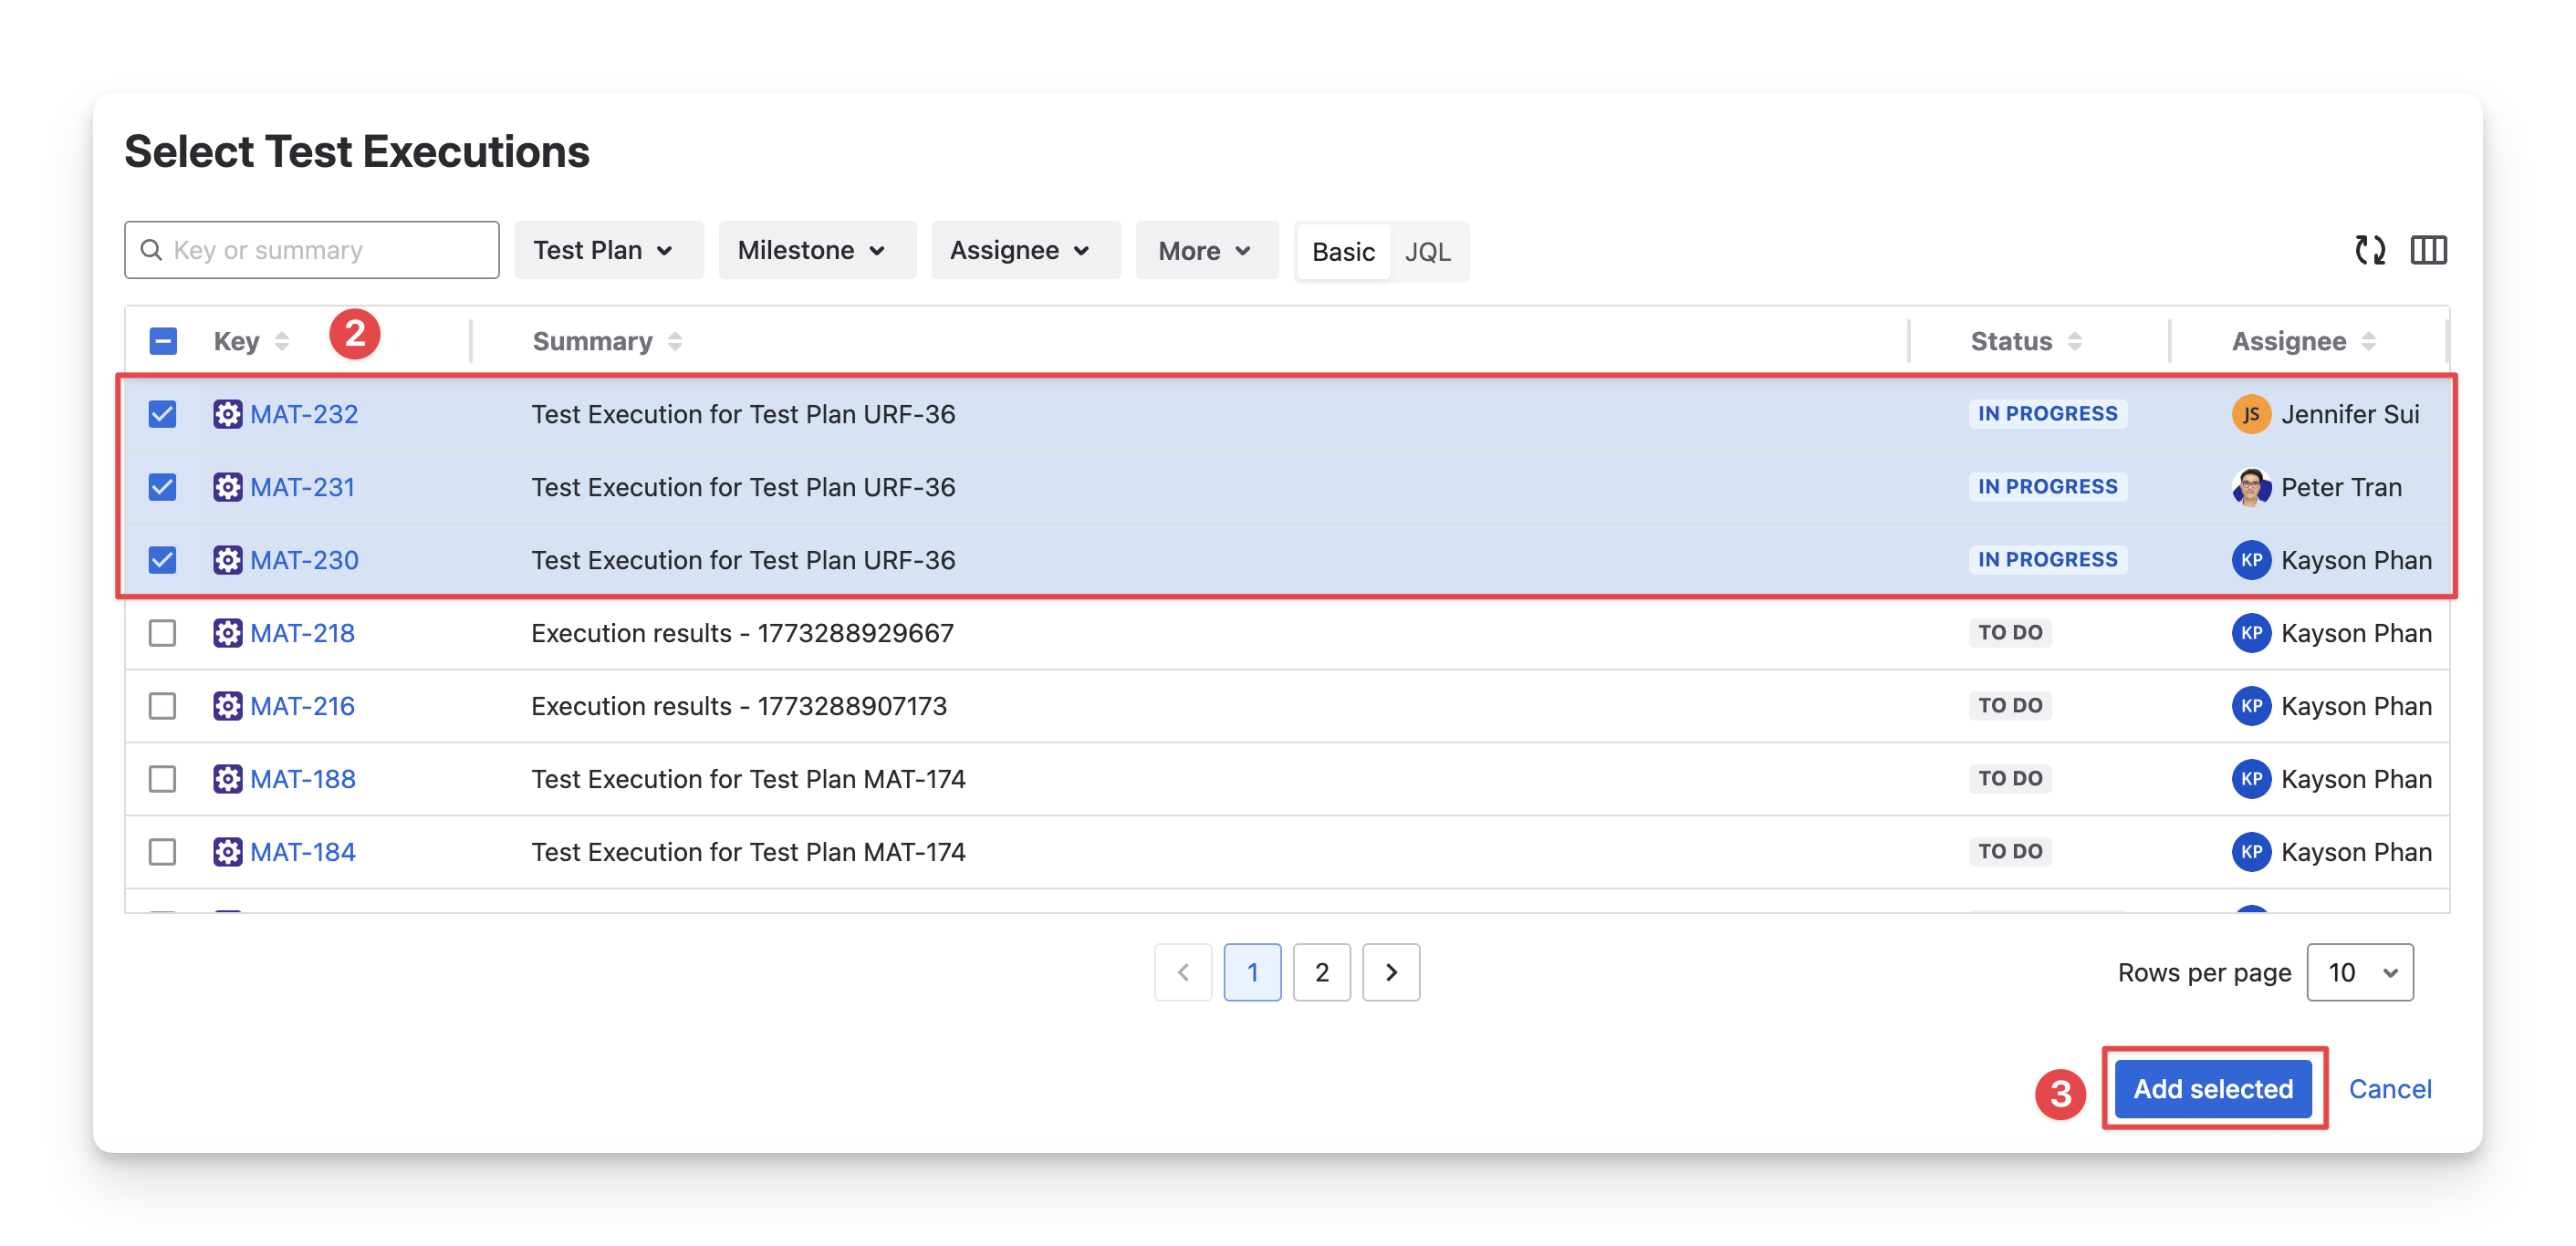
1. Test Executions Overview
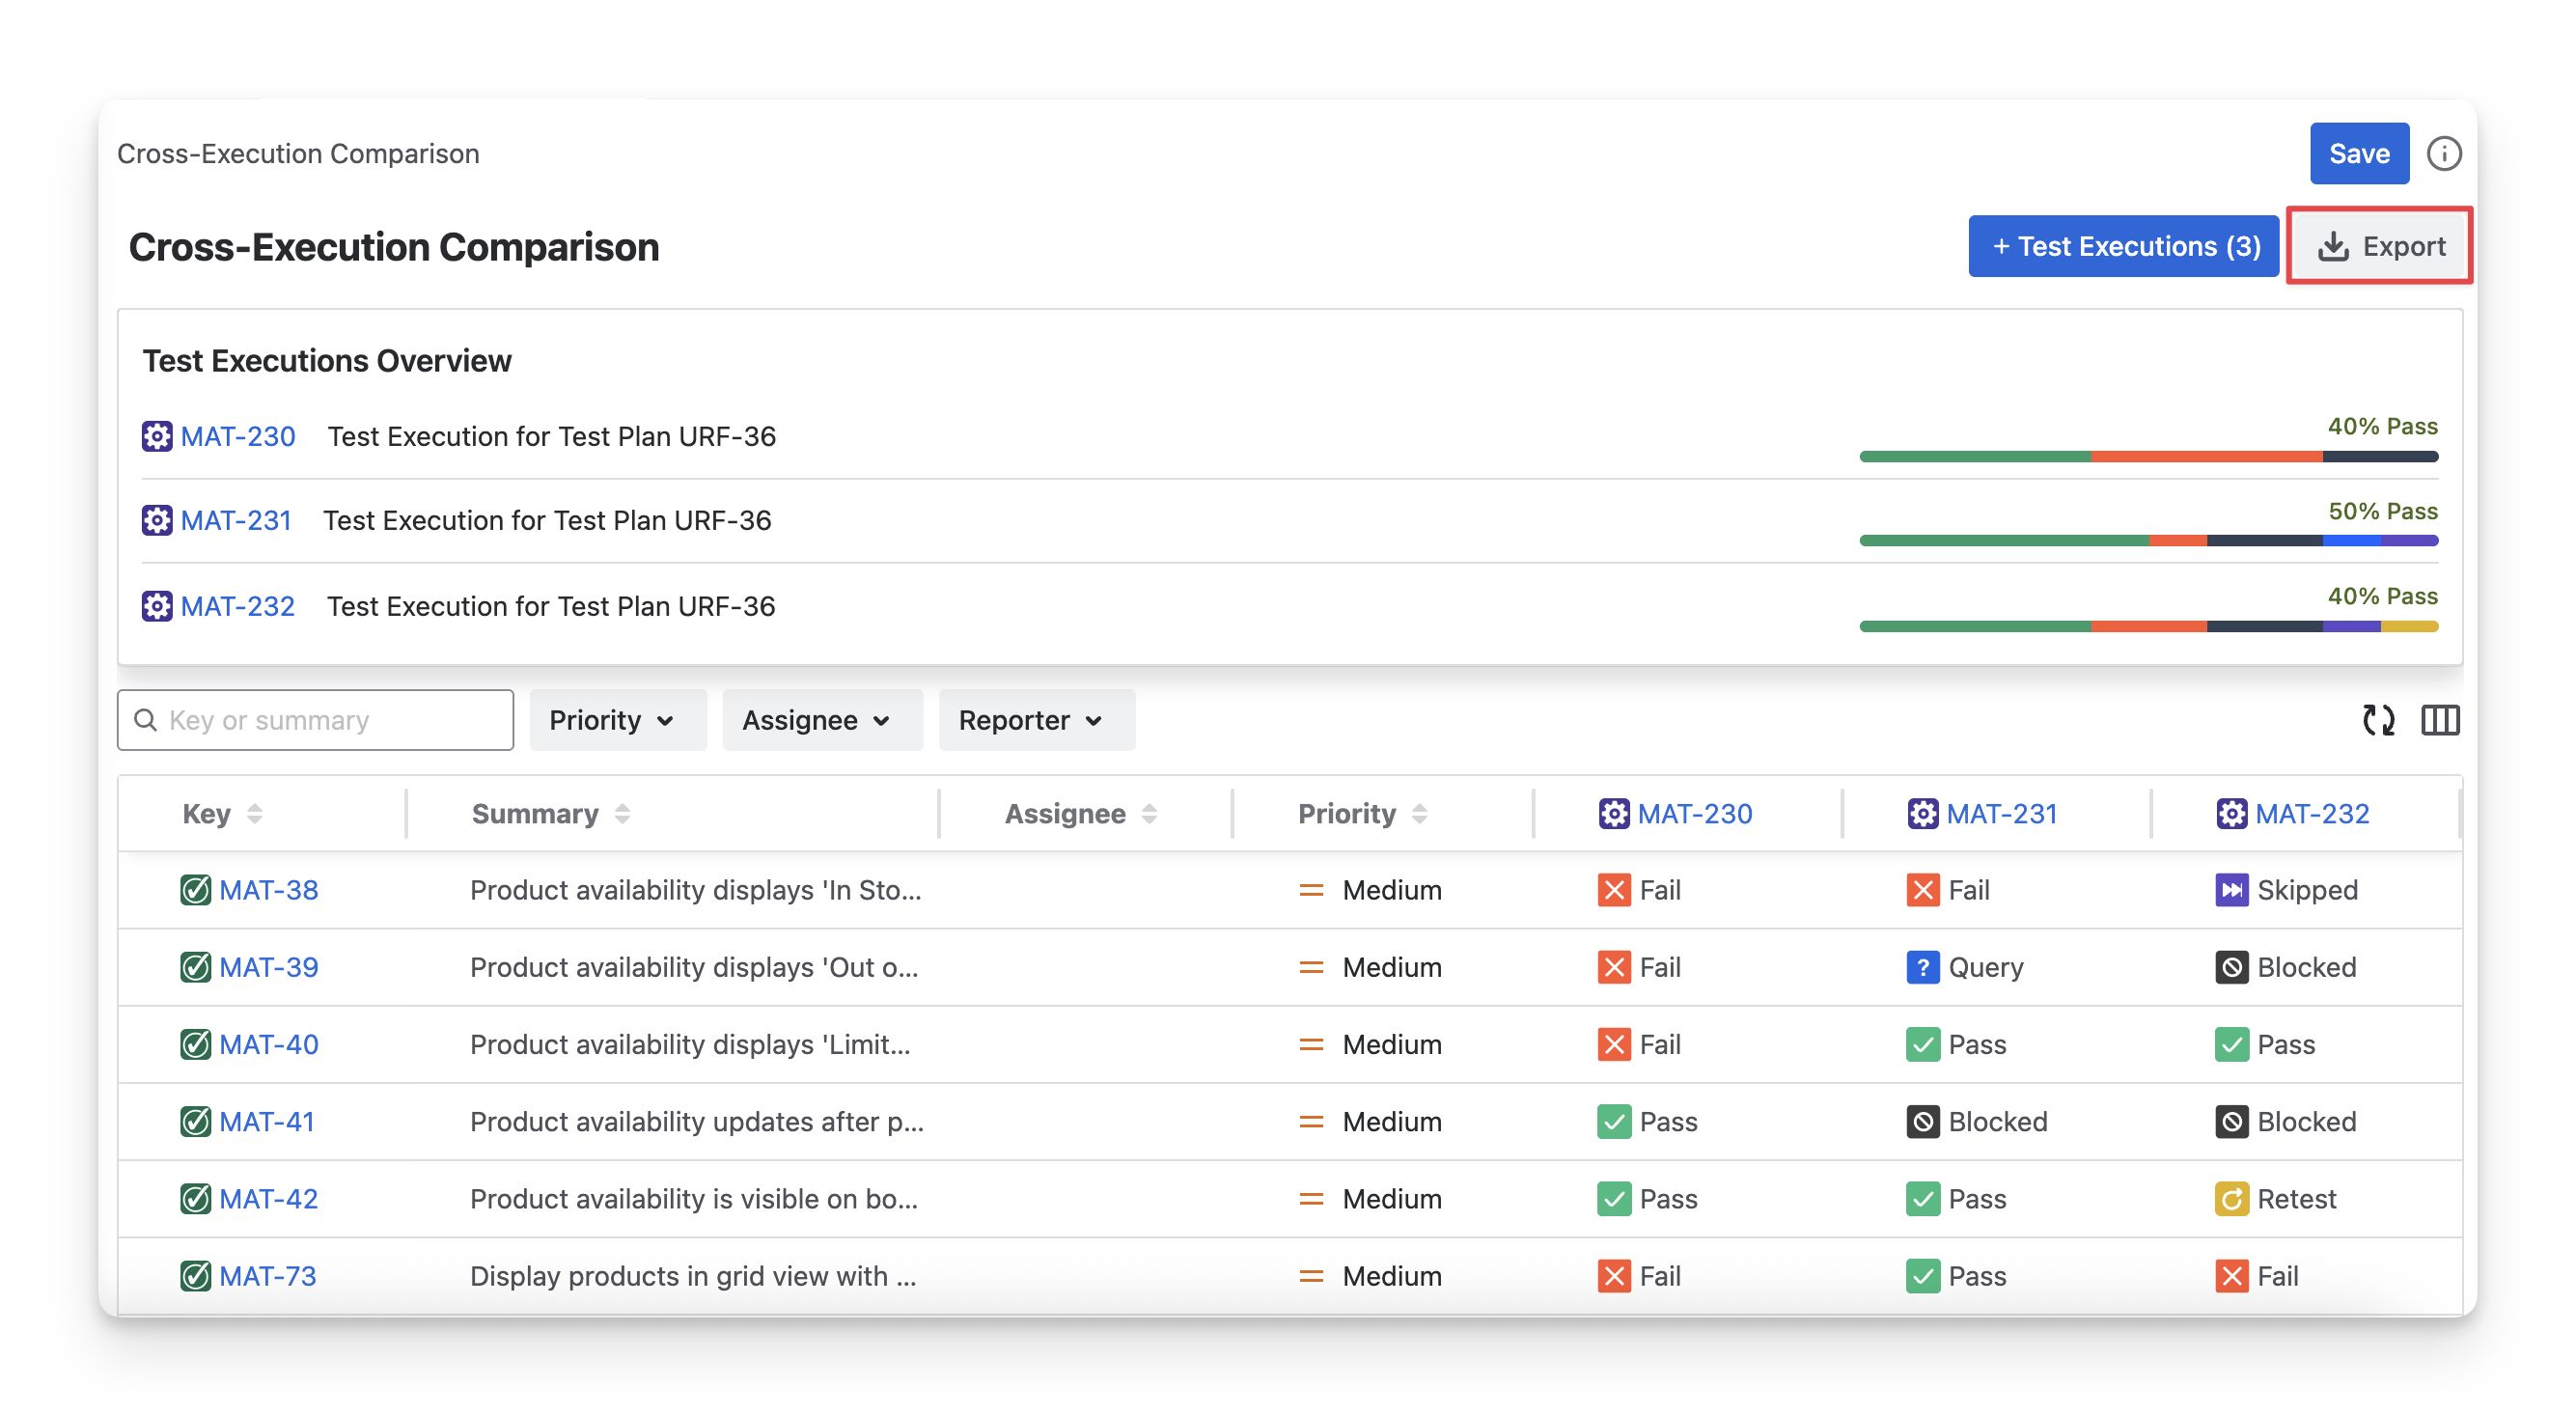
The Test Executions Overview displays the list of test executions selected for the comparison. Each Test Execution shows its Jira ID key, Summary, and the Overall Execution Status.
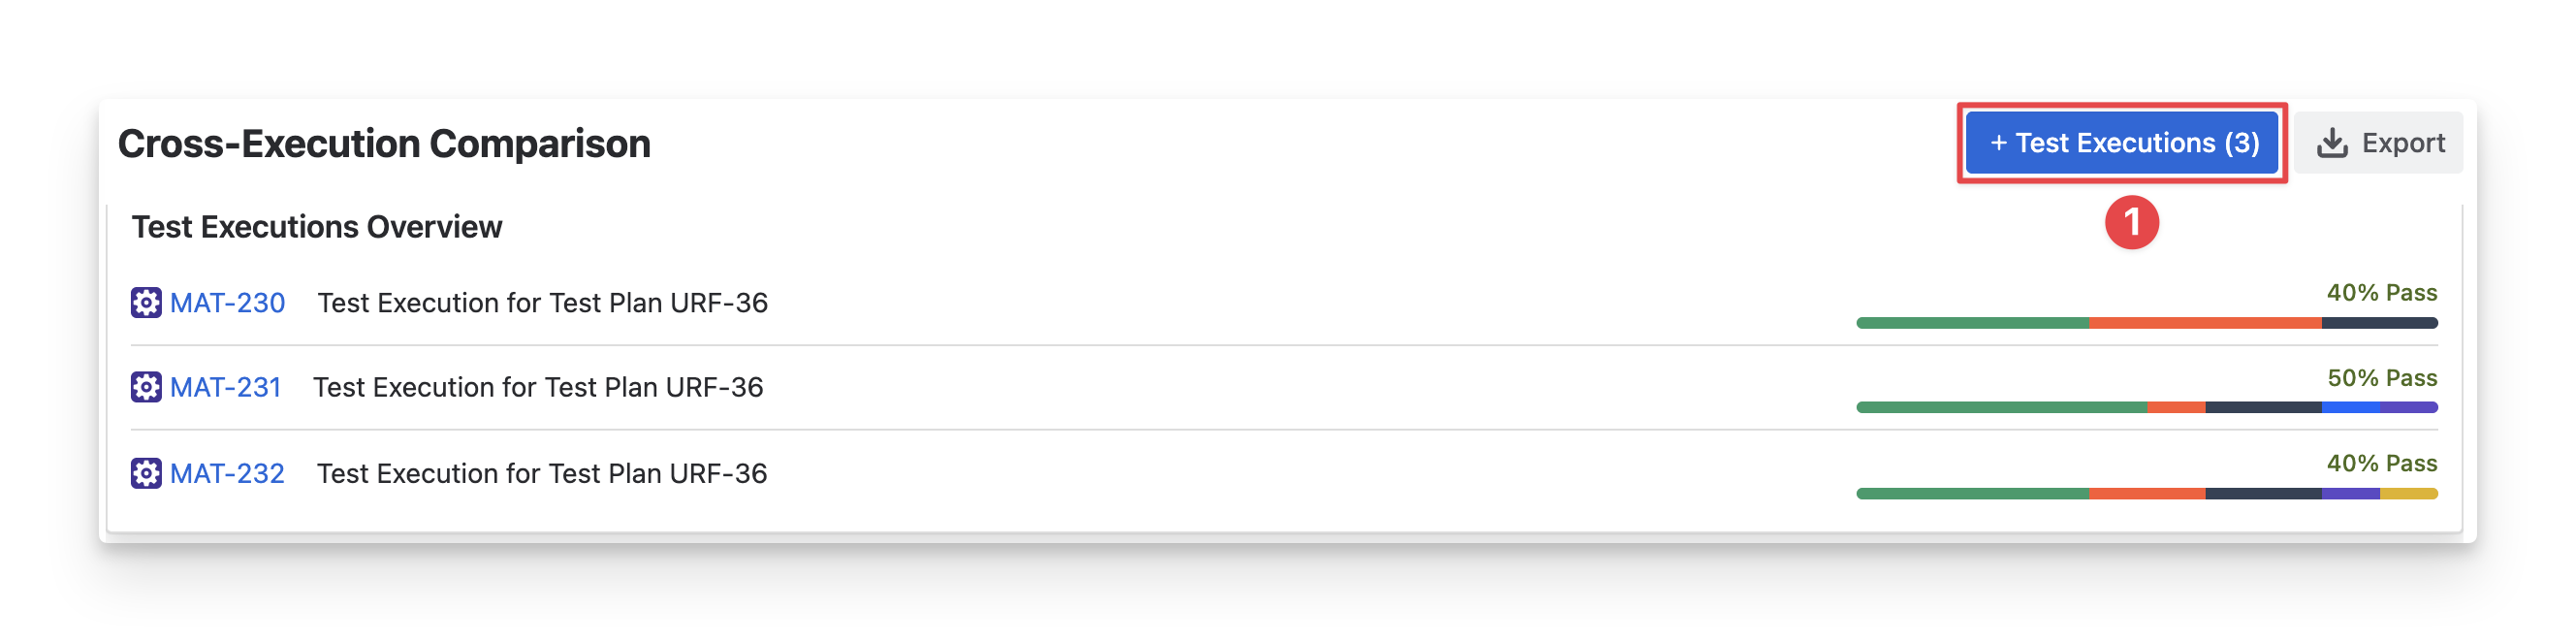
To add test execution and compare their execution status, follow these steps:
-
Click the “+ Test Execution” button.
-
Select the test execution you want to add to the report, up to 50 test executions. You can search for test executions by name, filter with fields, or use JQL.
-
Click the “Add selected” to complete this step.
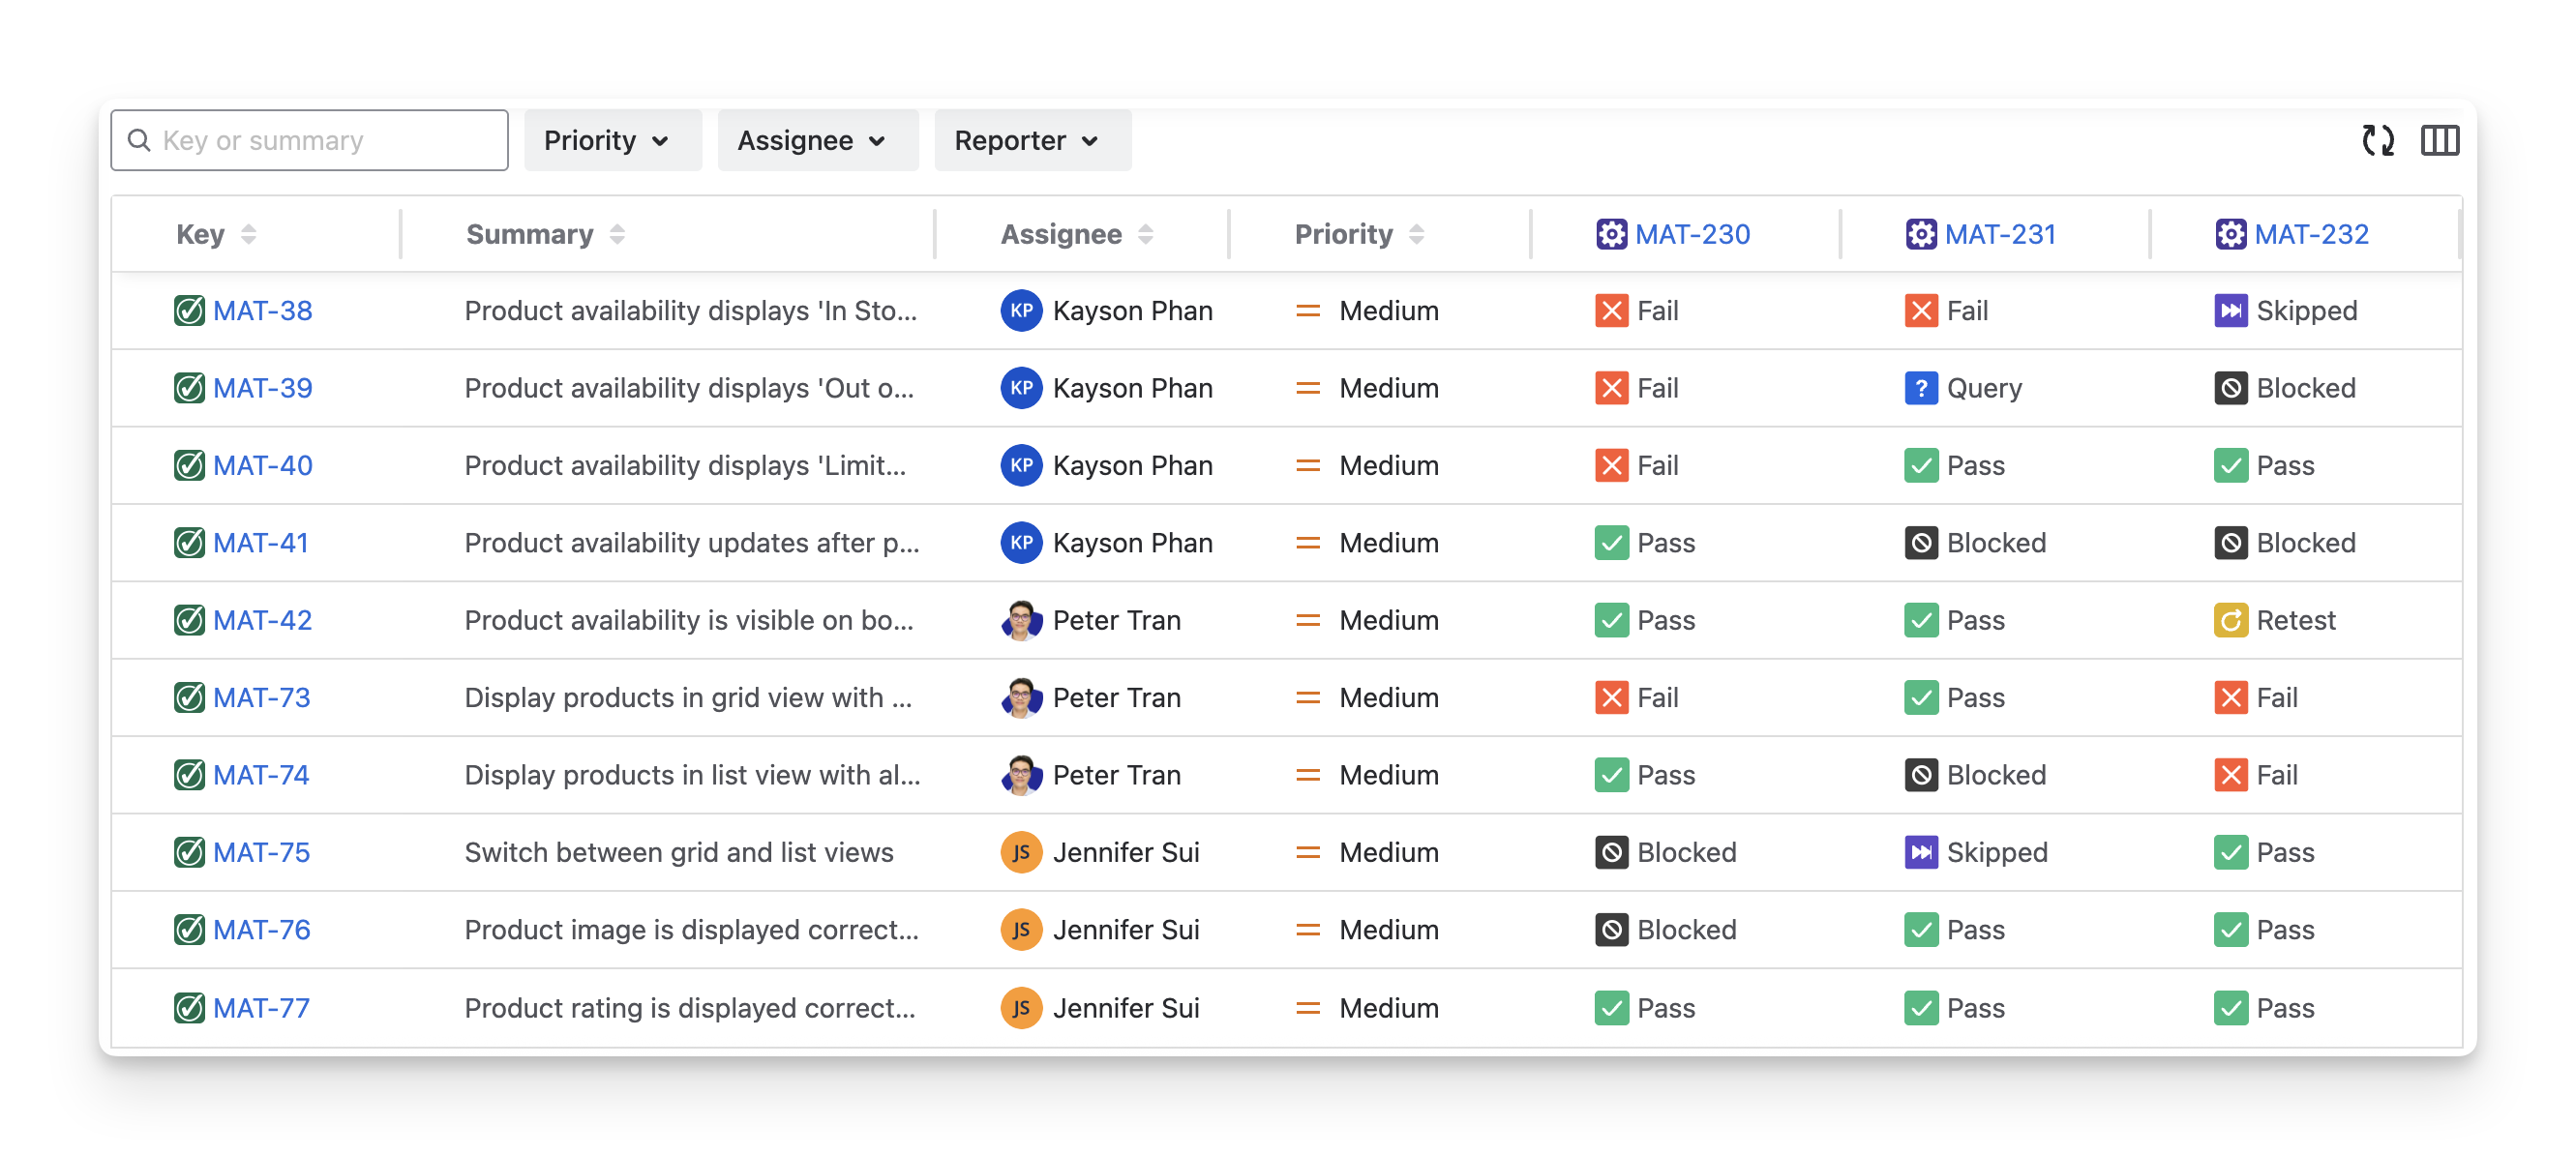
2. Execution Comparison Table
The Execution Comparison Table shows test case results across different selected executions. From this table, you can quickly identify differences in the executed status of test cases ( Fail pass todo query retest Skipped blocked ) in different executions.
With this table, you can perform the following actions:
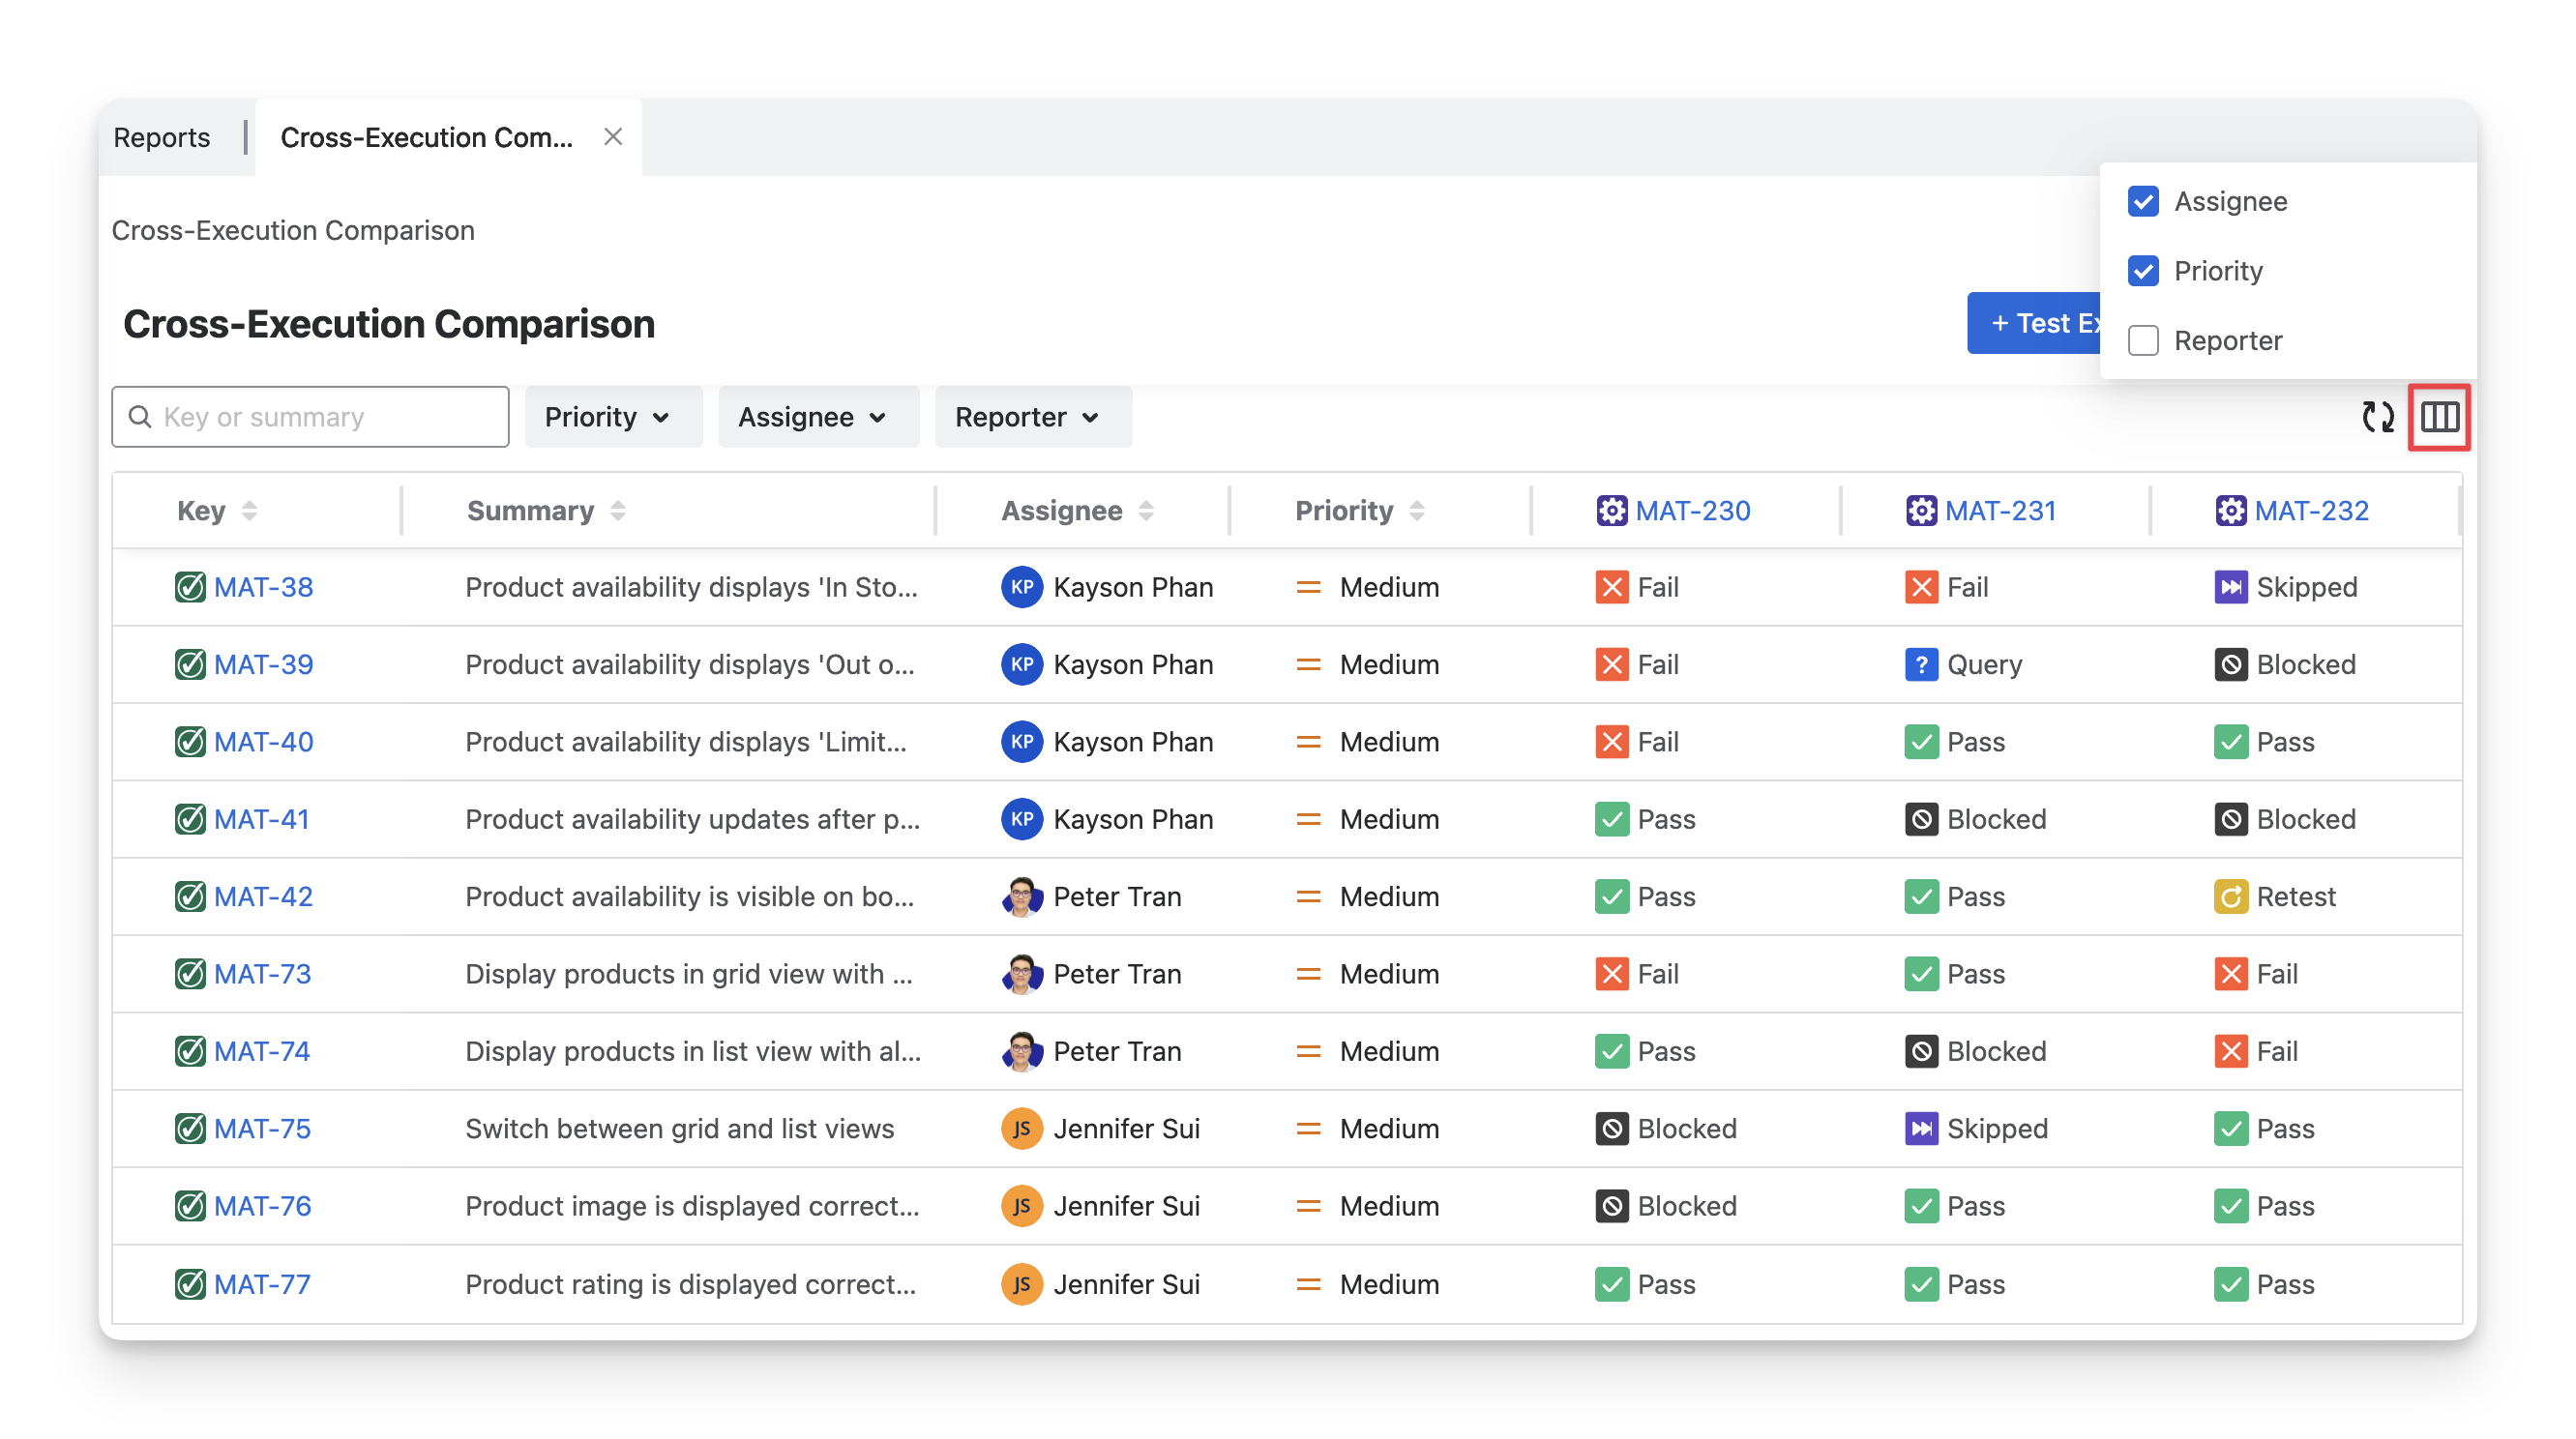
2.1 Display Execution Comparison Table Information
You can Show/Hide the column in the report table by
-
Click on the Display button.
-
Select/deselect any options to show/hide these columns in the Execution Comparison Table.
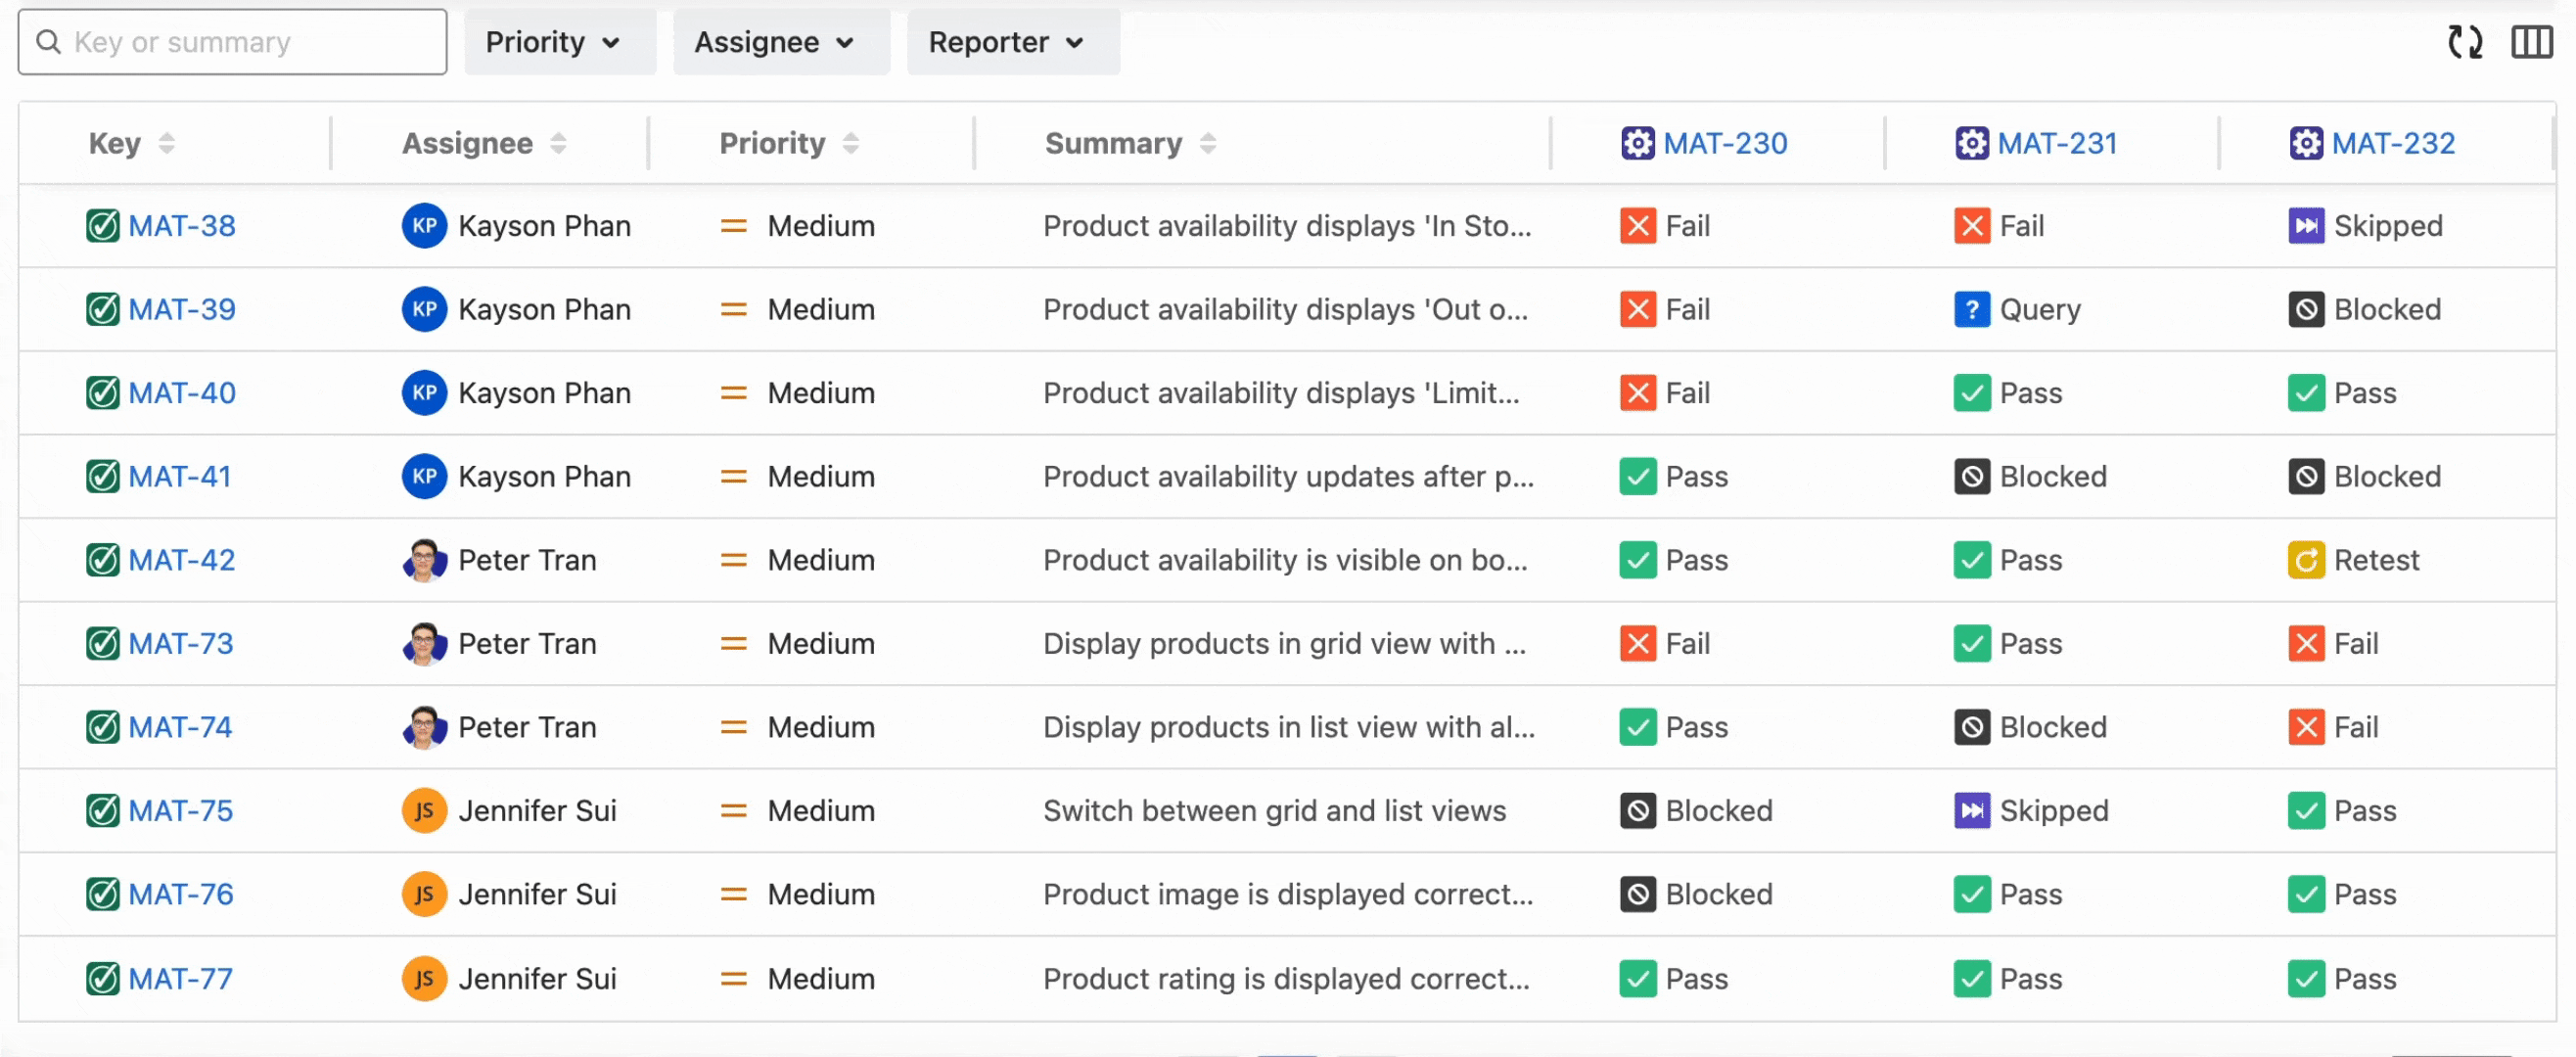
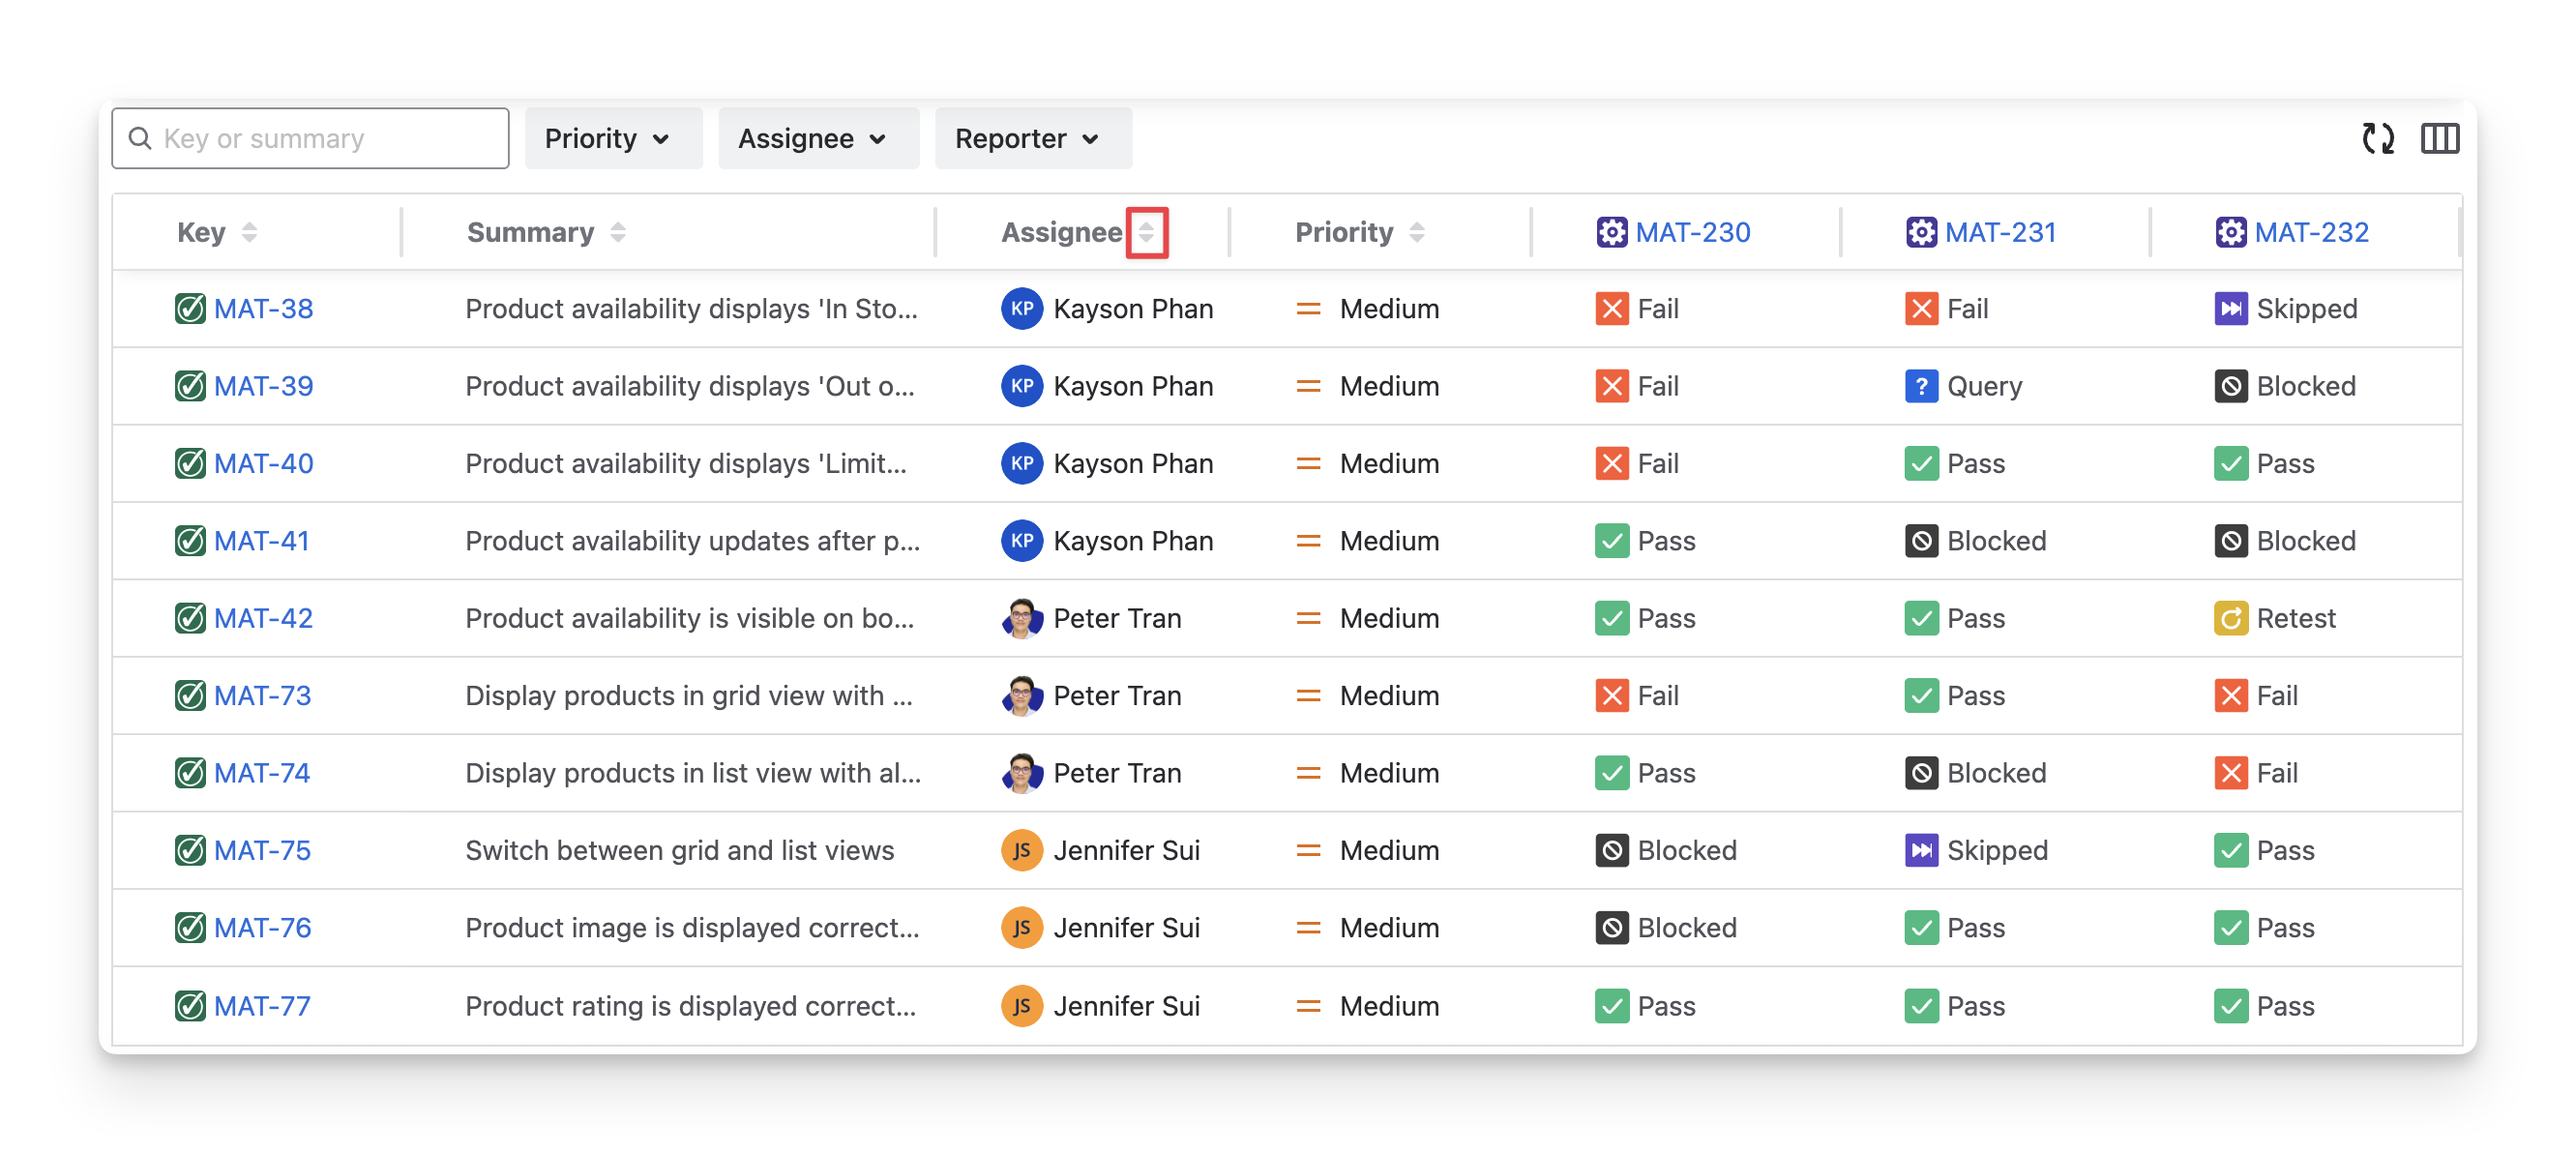
2.2 Rearrange Execution Comparison Table Orders
To change the display order of columns, drag and drop each column to your preferred position.
2.3 Sort Excution Comparison Table
To sort any column and view the data in ascending or descending order, you can:
-
Choose the 🔼 to sort ascending.
-
Choose the 🔽 to sort descending.
2.4 Filter Execution Comparison Table
To quickly identify a specific test case in the comparison table, you can:
-
Provide the Name or Summary to find the exact test case.
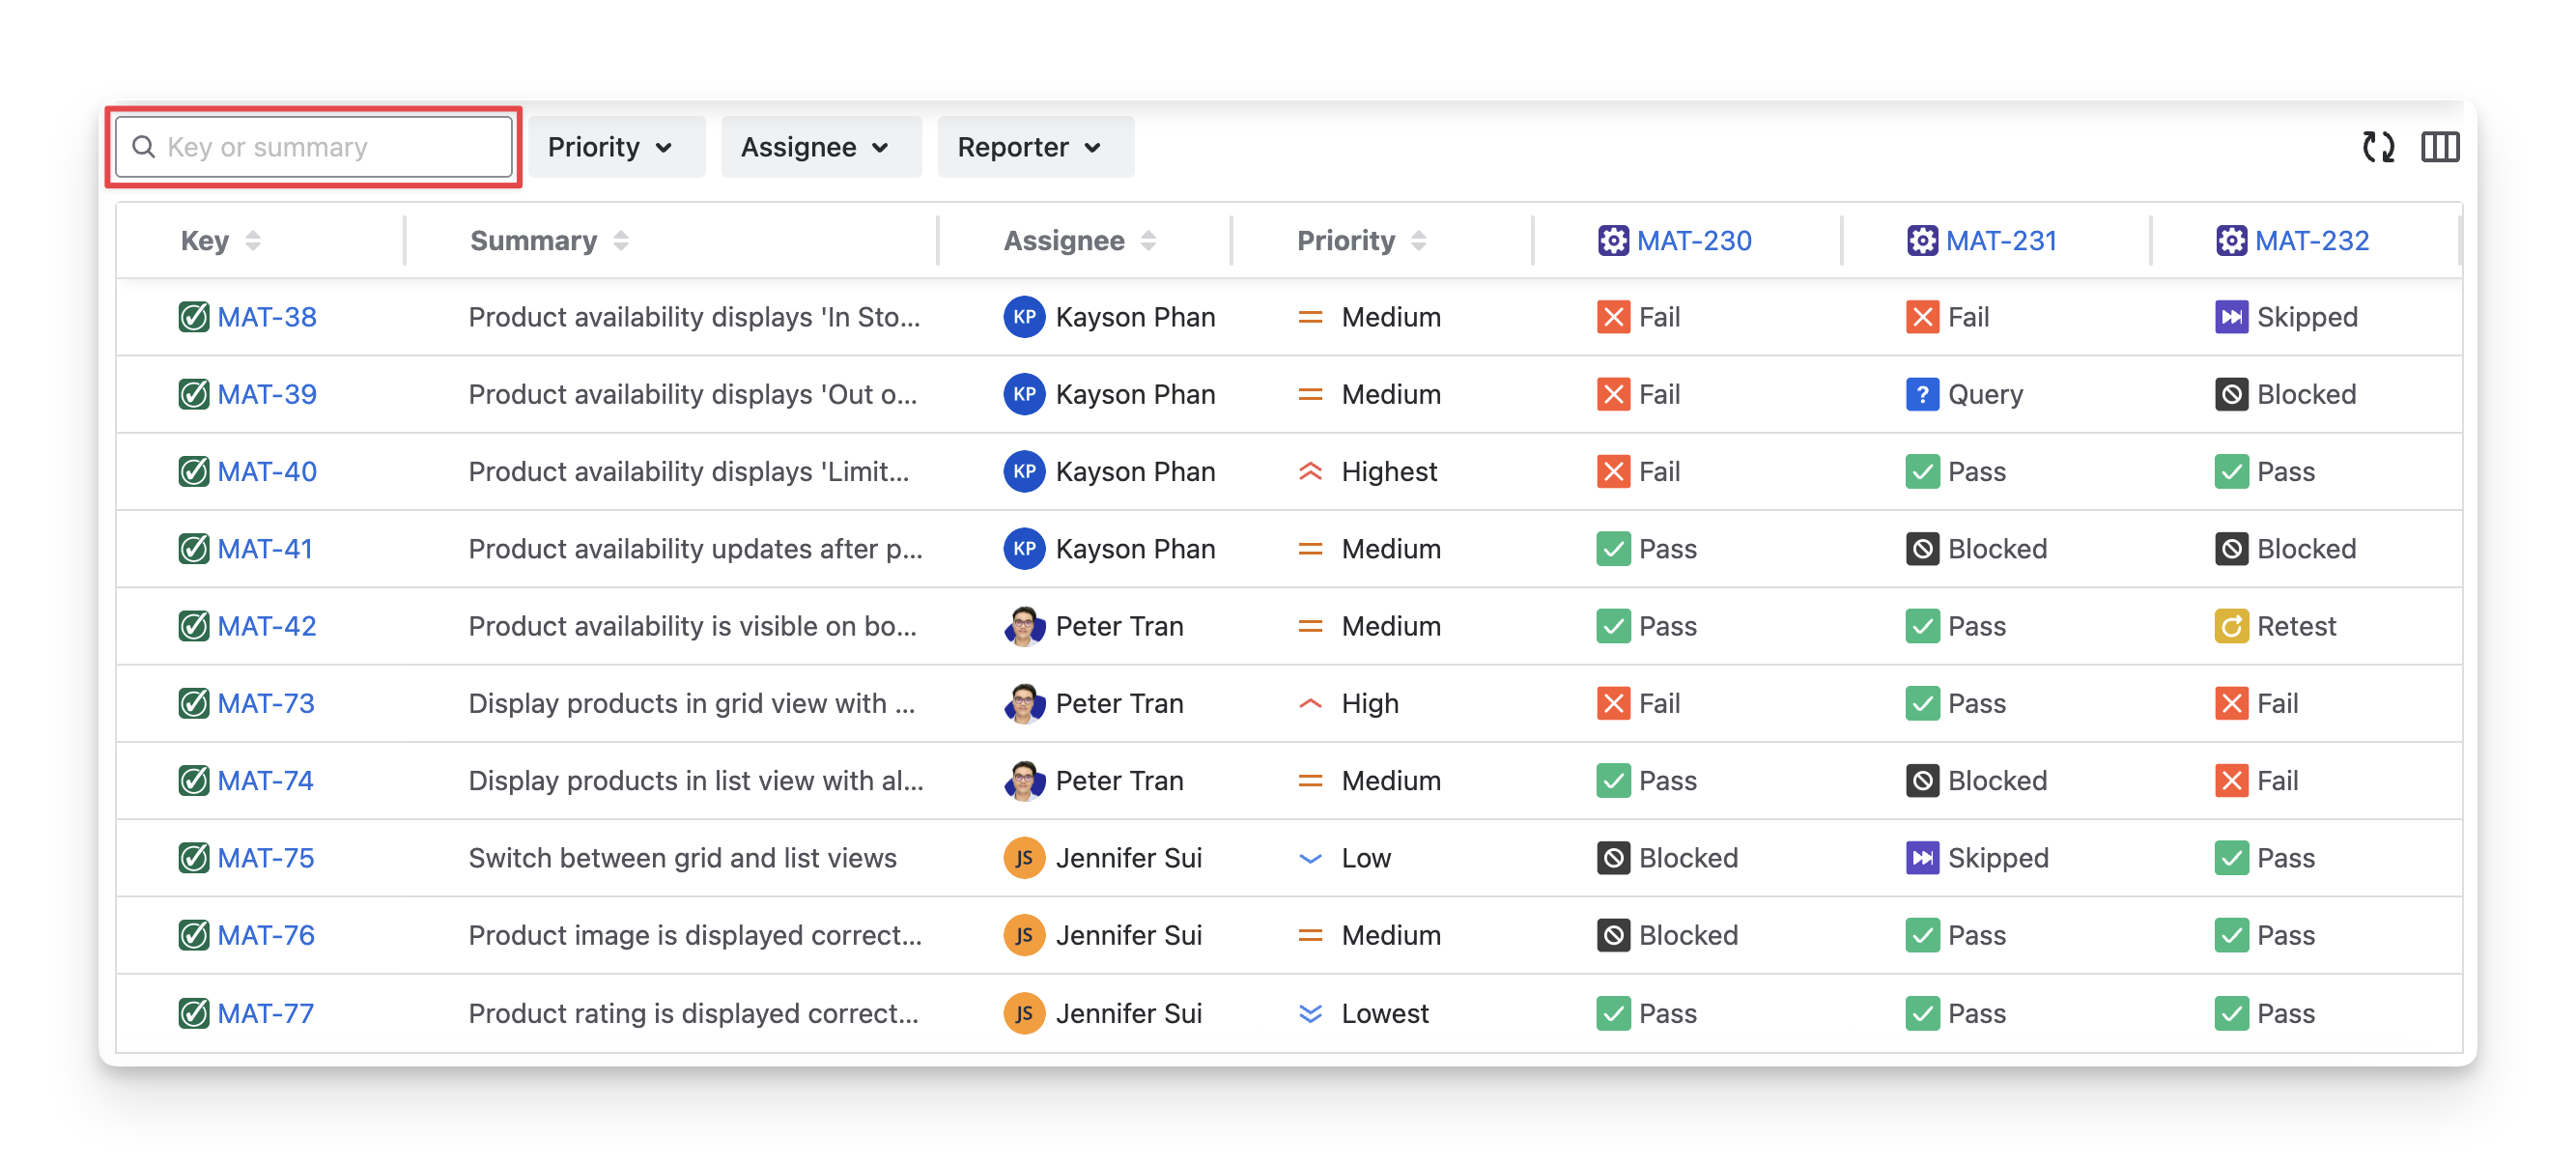
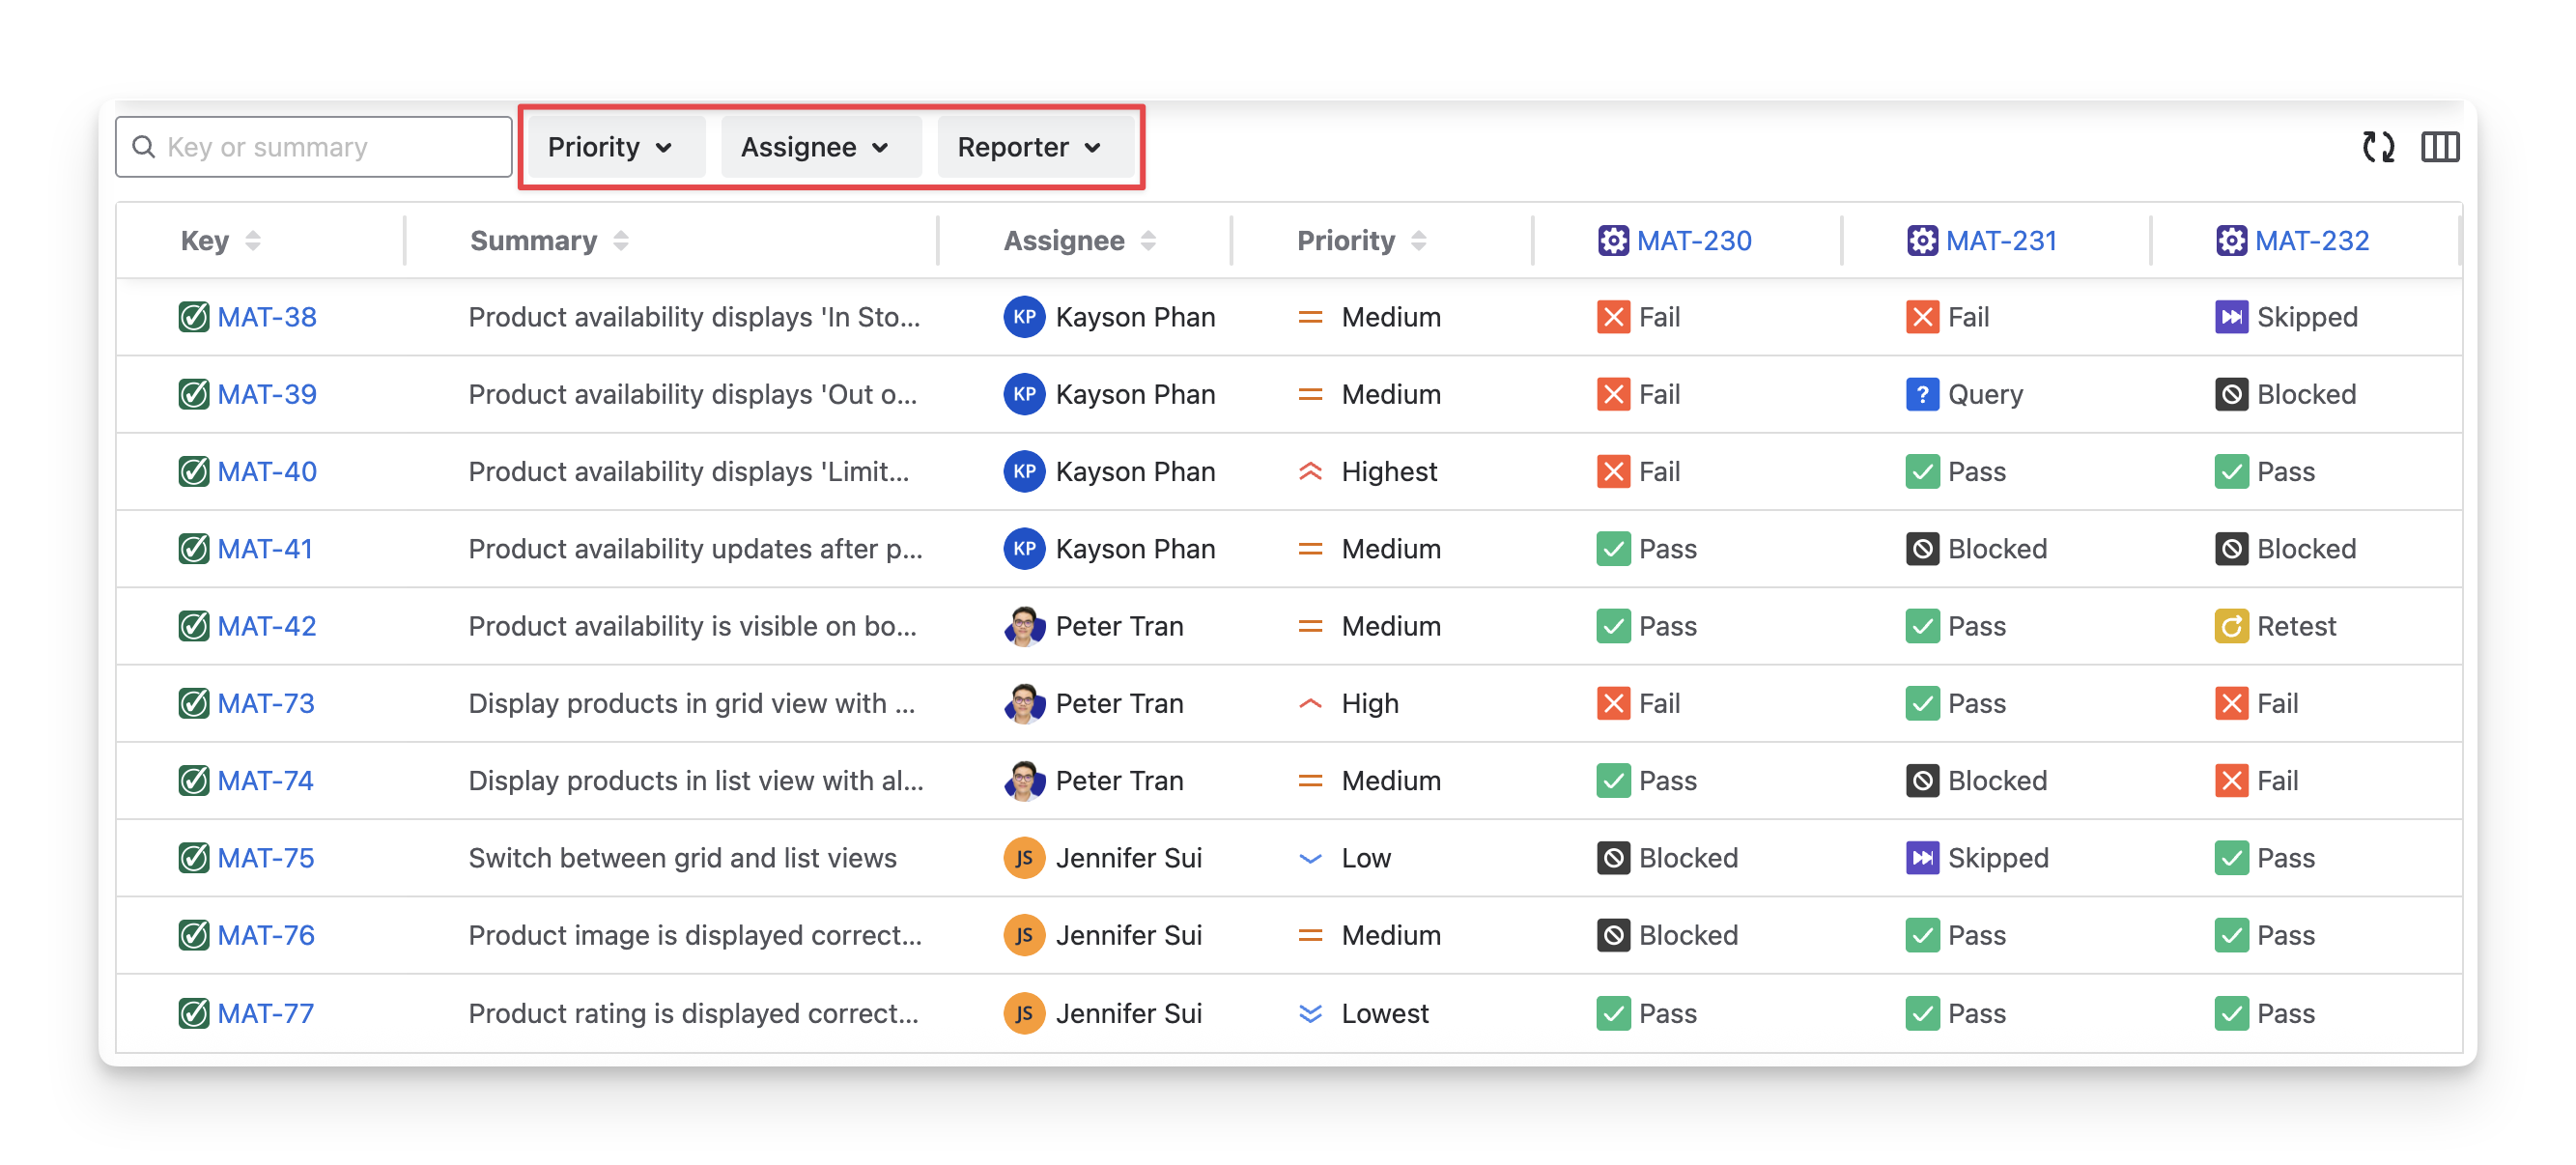
-
Apply Filters to narrow down the list. You can filter reports by:
-
Priority: Filter test cases with selected priority levels
-
Assignee: Filter test cases by assignee members
-
Reporter: Filter test cases by the one who created
-
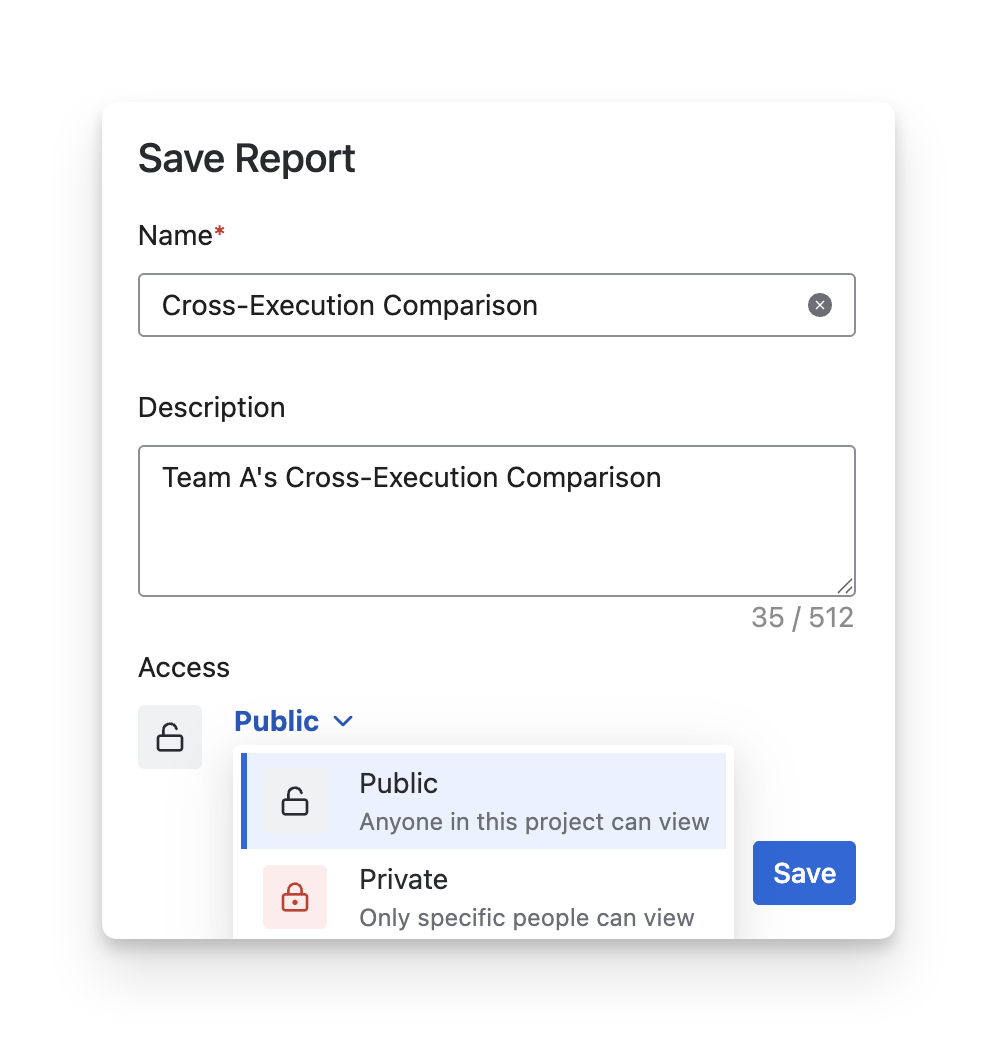
3. Save, Share & Export Report
After modifying the Cross-Execution Comparison Report, click the Save button. When you reopen the report, your settings will restore automatically, so you won’t need to configure it again.
Set the report's accessibility:
-
Choose Private to restrict viewing to some members.
-
Choose Public to allow all members to view the result.
To download the Cross-Execution Comparison report, click the Export button. AgileTest lets you export this report as PDF or Excel files, including all content from the pie charts and detailed table sections.
Should you need any assistance or further AgileTest inquiries, contact our 24/7 Support Desk.