.png)
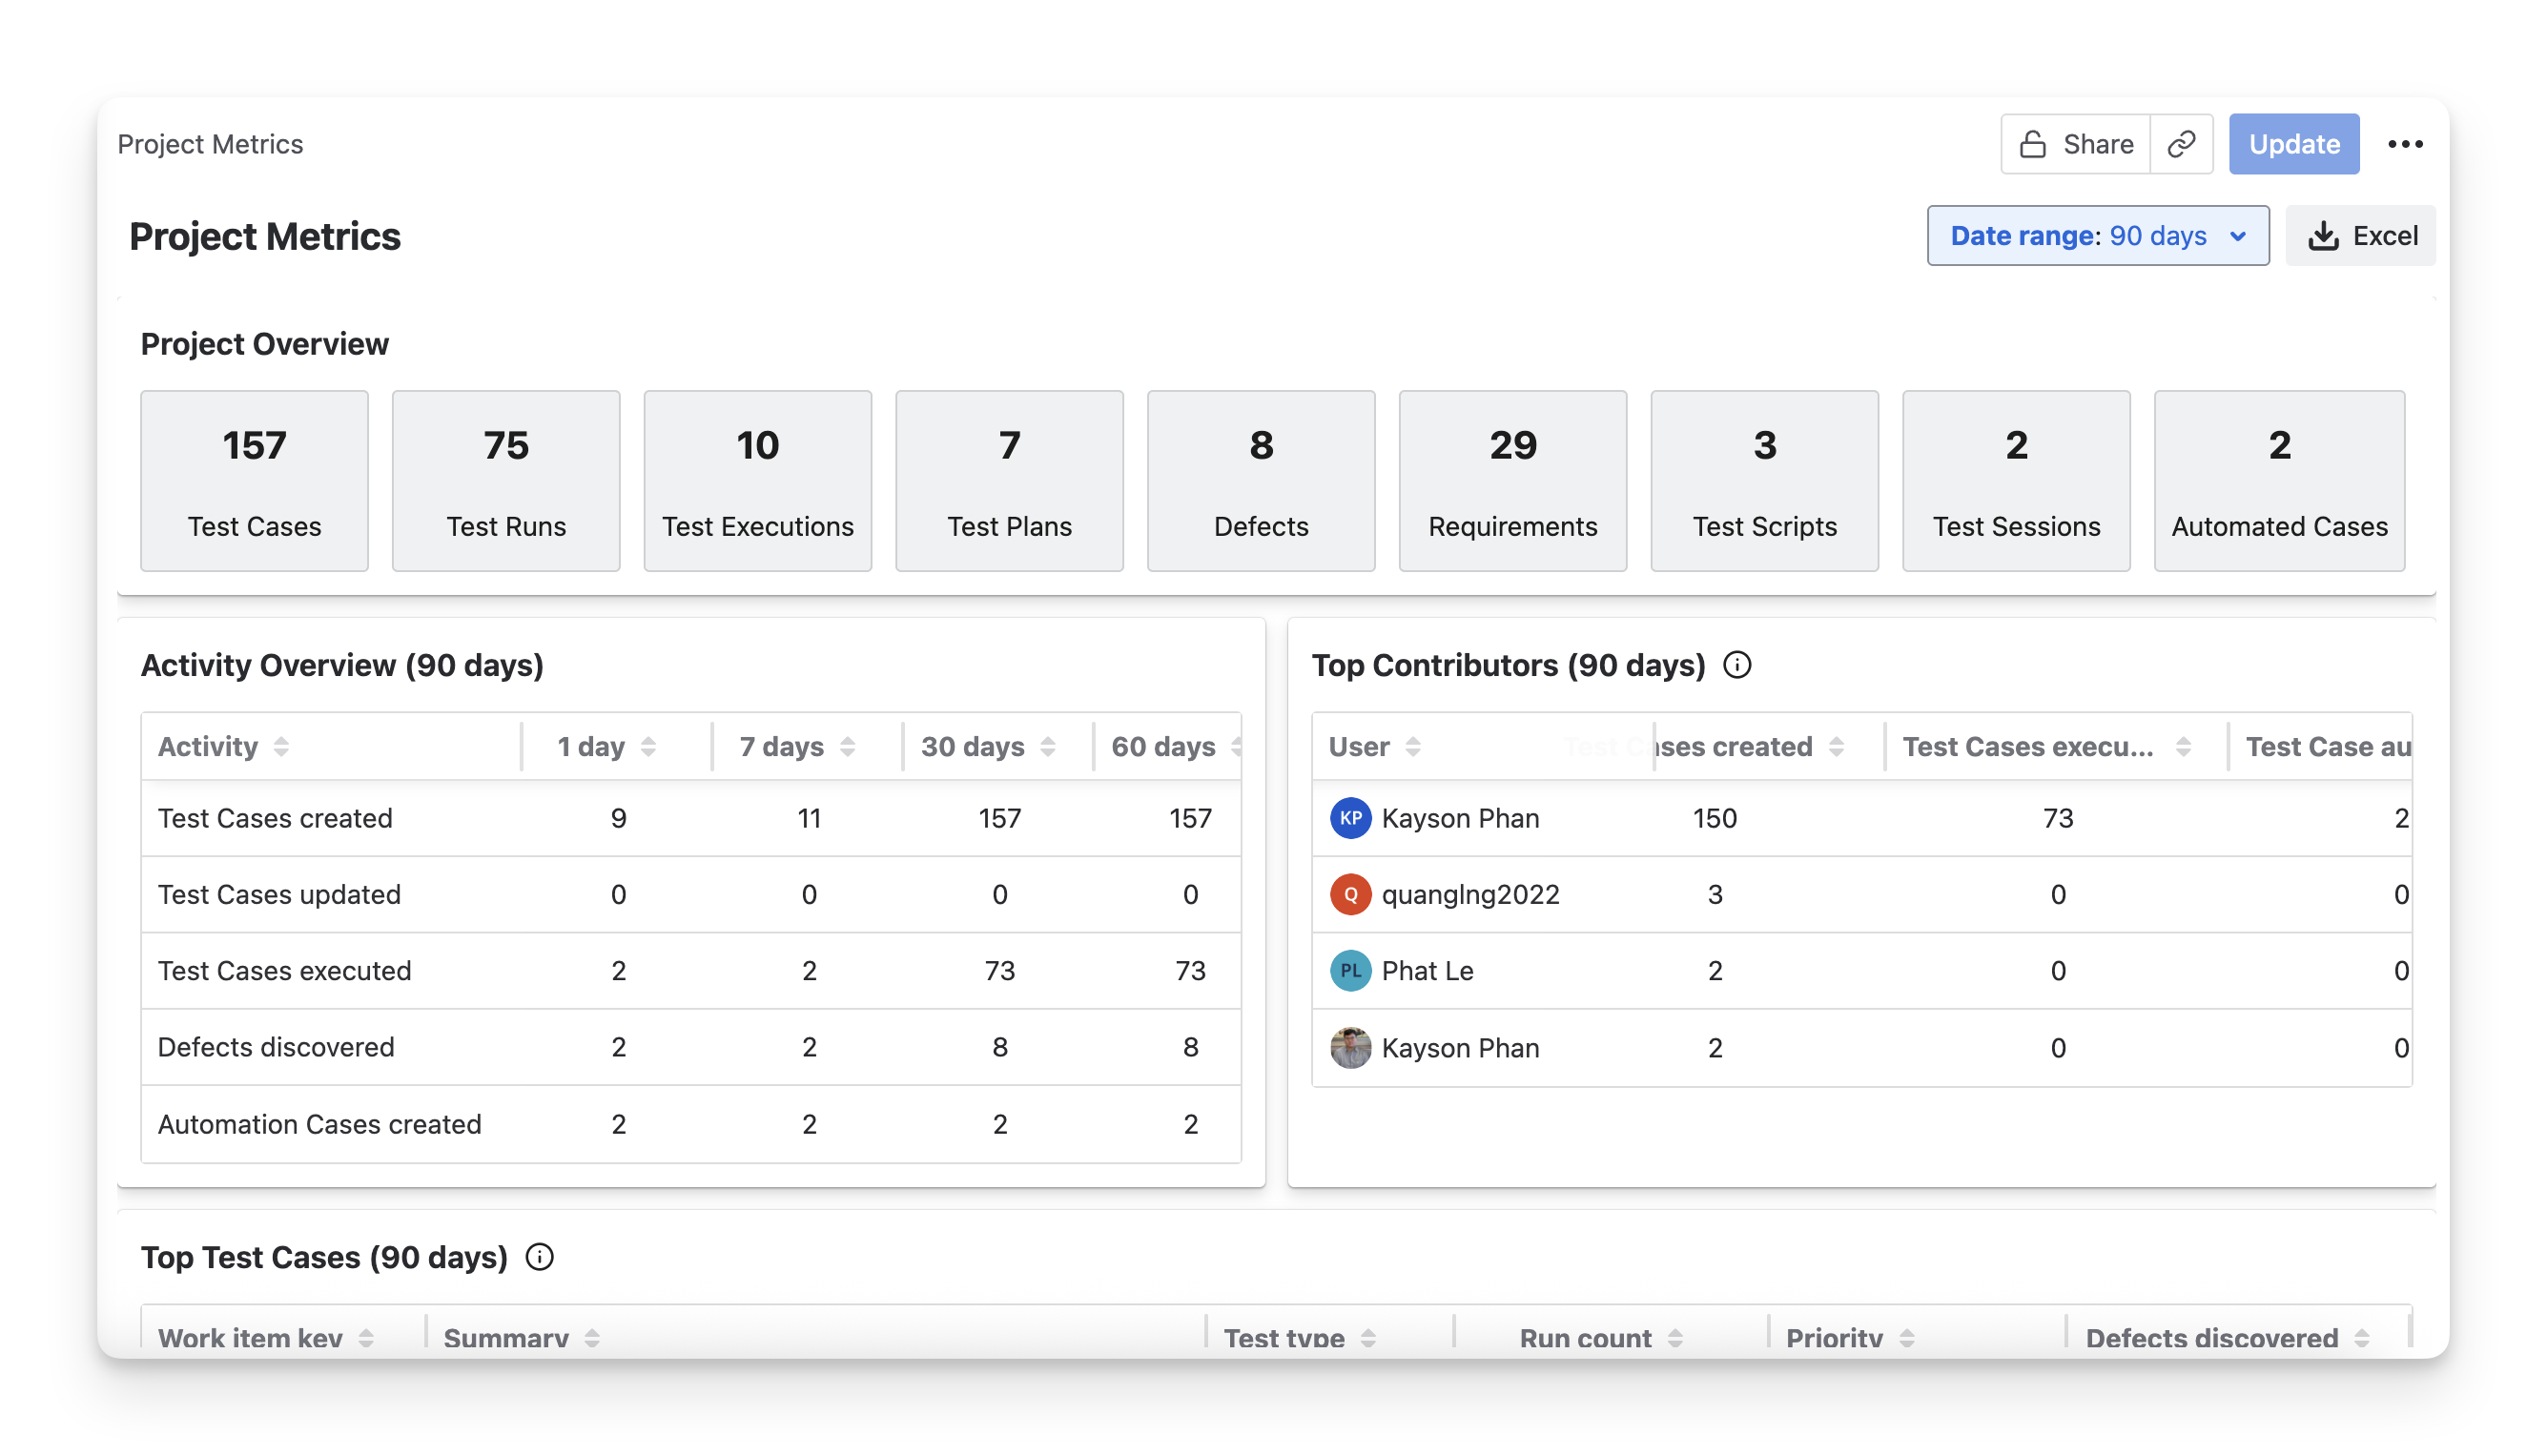
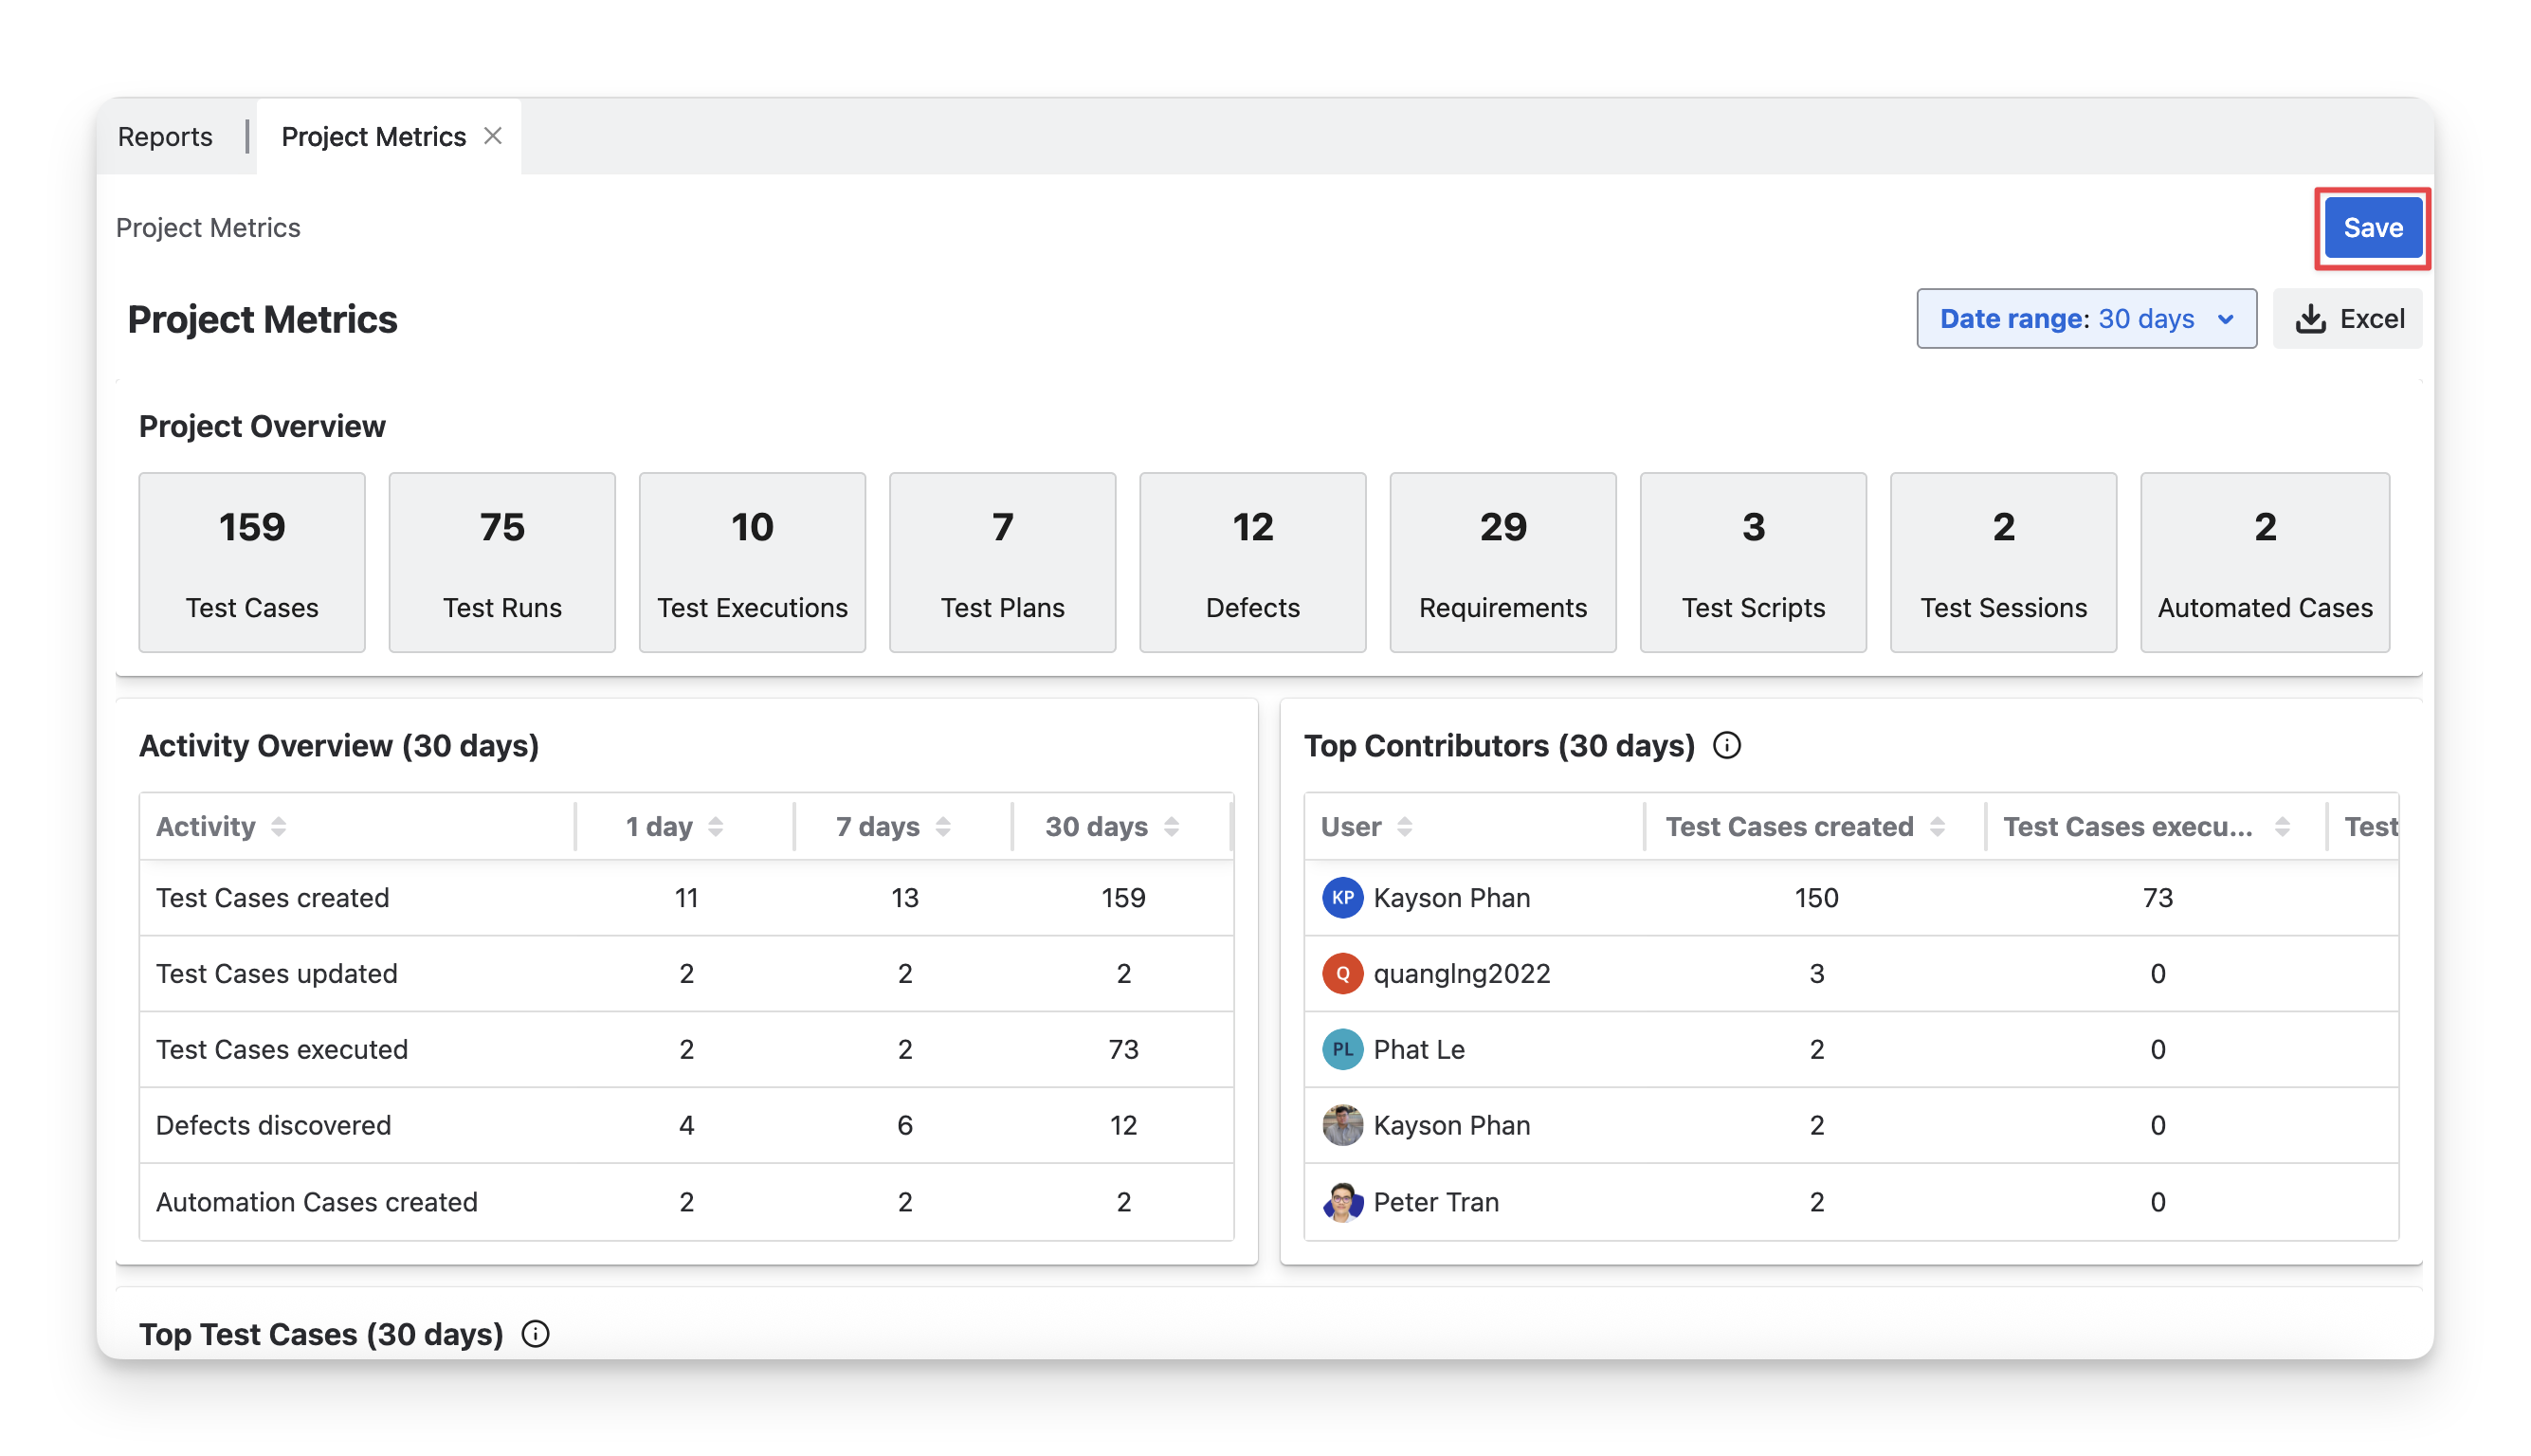
Project Metrics Report in AgileTest provides an overview of your project's testing activities within your selected time range. It summarizes key metrics such as the number of test cases, test runs, executions, defects, and contributions over time. This report enables teams to track project progress, identify performance trends, and make informed decisions based on real-time data.
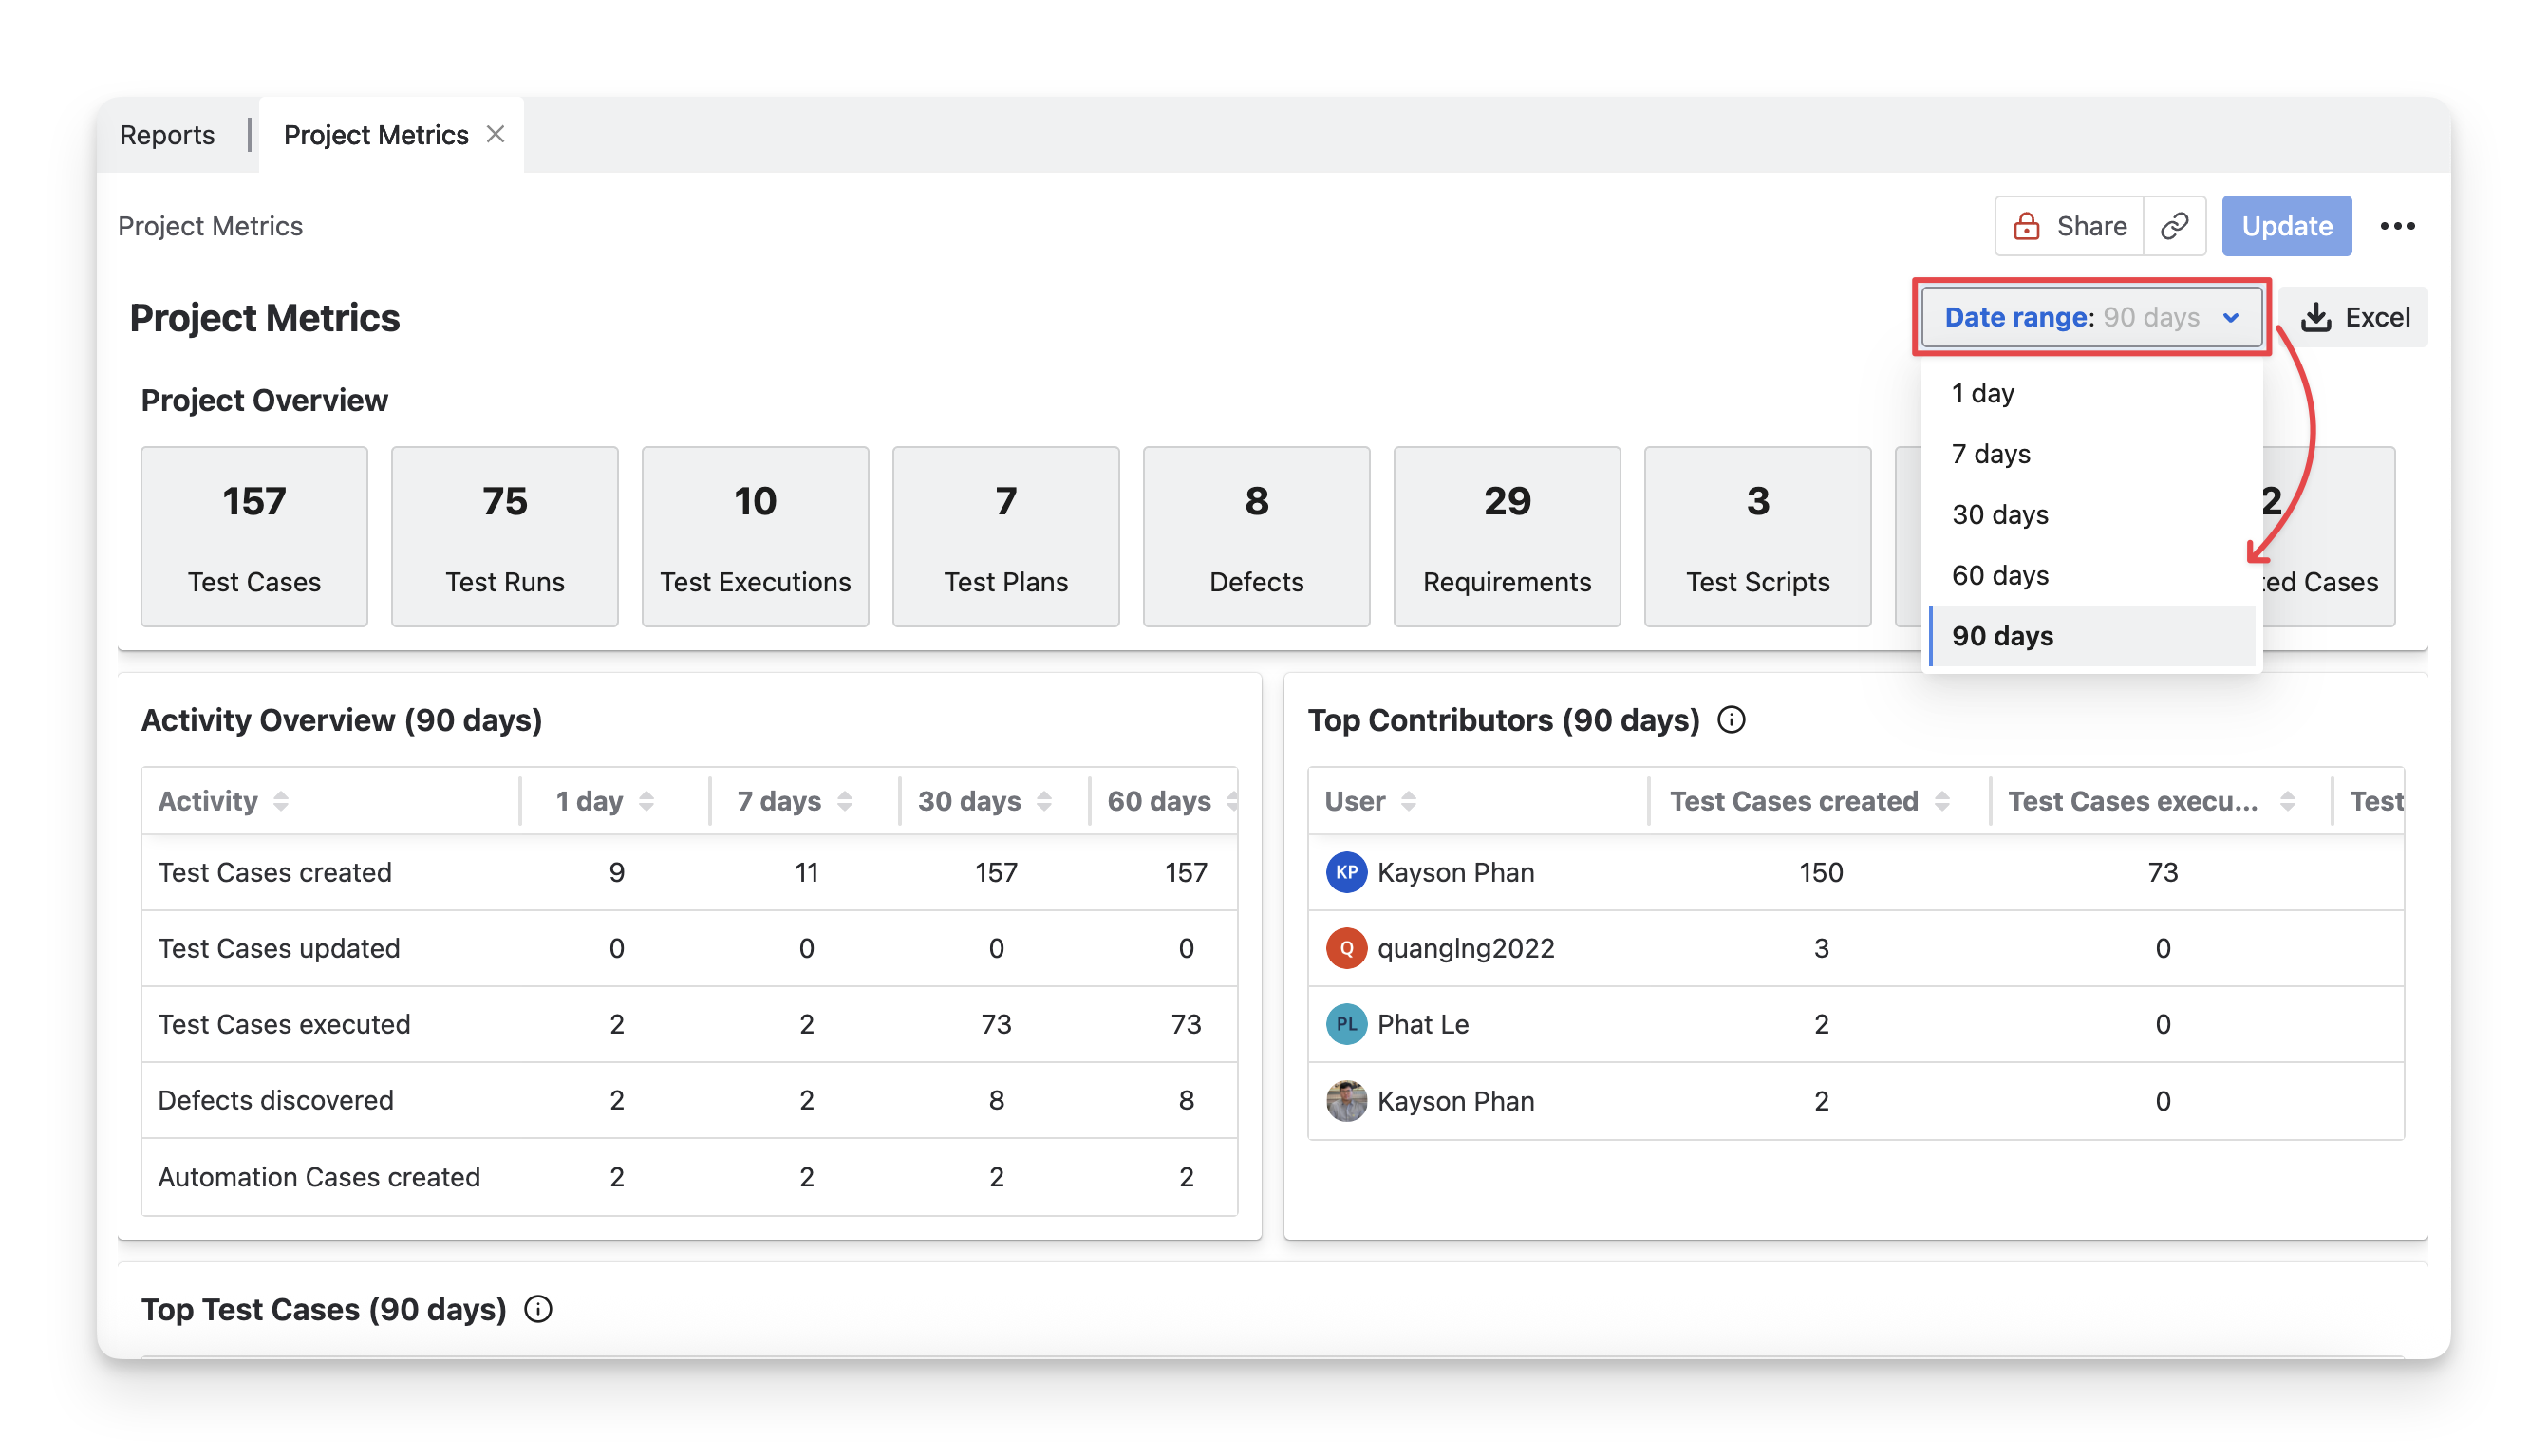
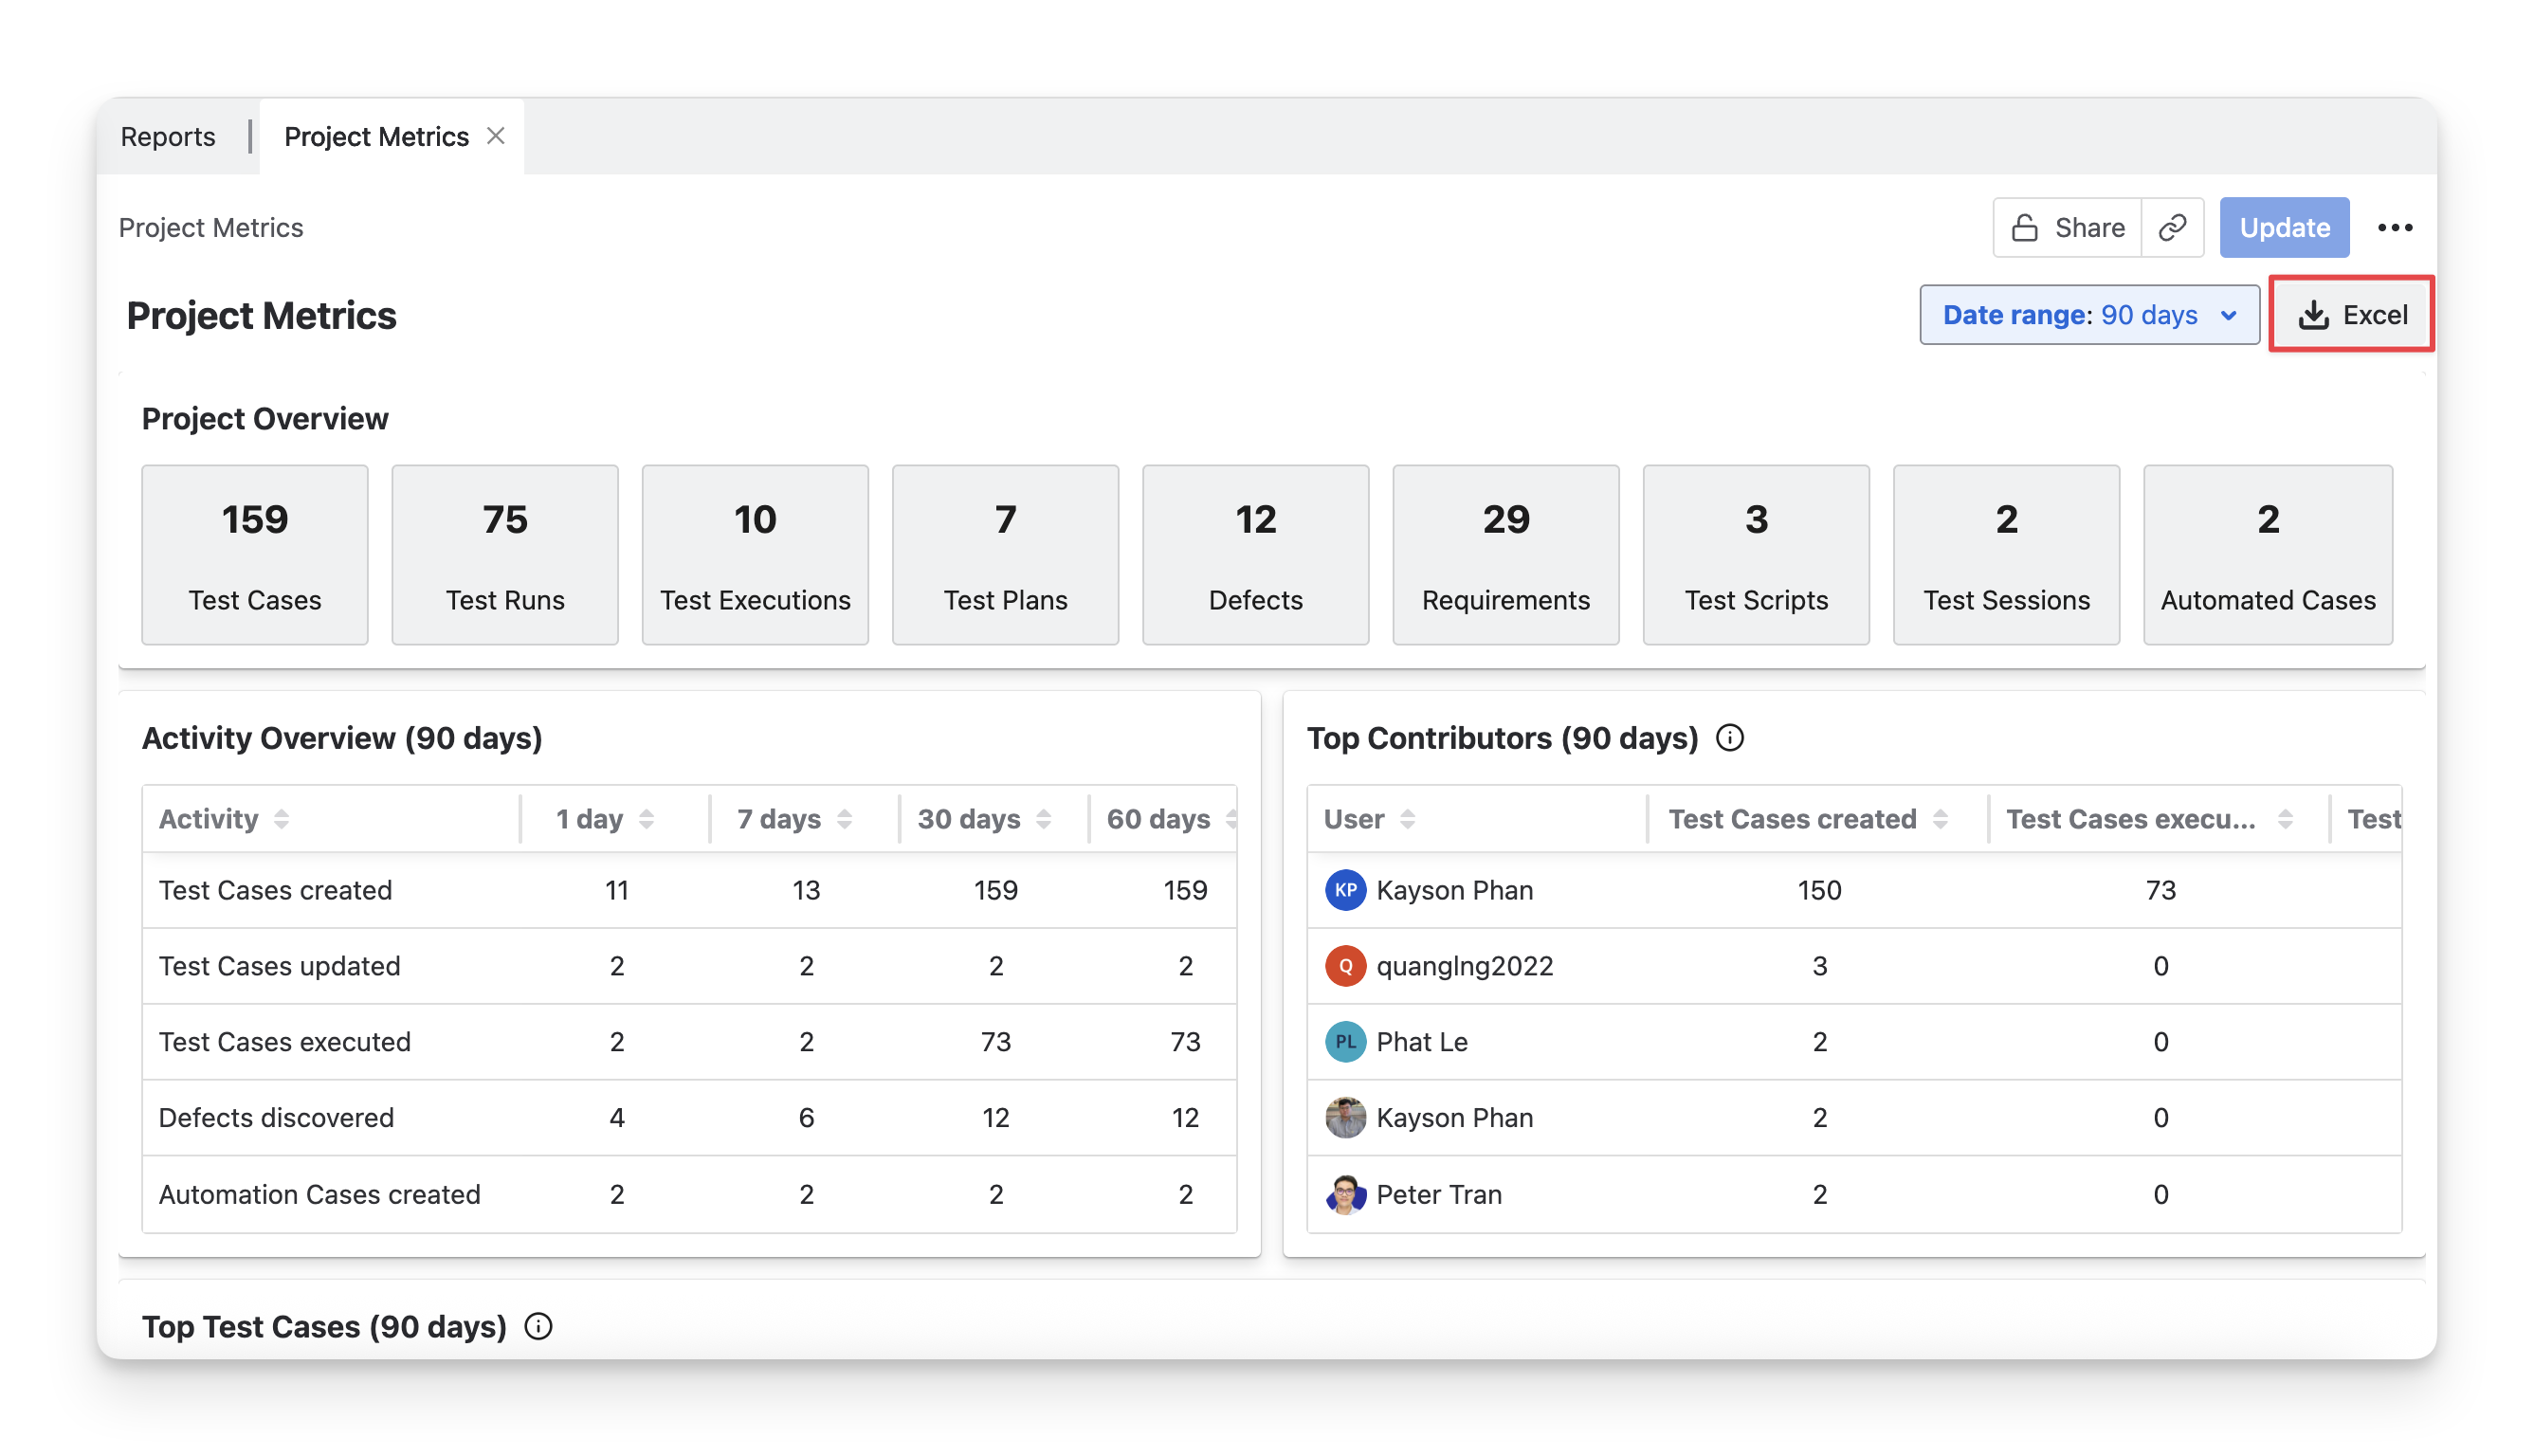
You can adjust the data displayed in the report by selecting a specific time range (1 day, 7 days, 30 days, 60 days, or 90 days) from the dropdown. This will dynamically update the metrics to reflect the selected period.
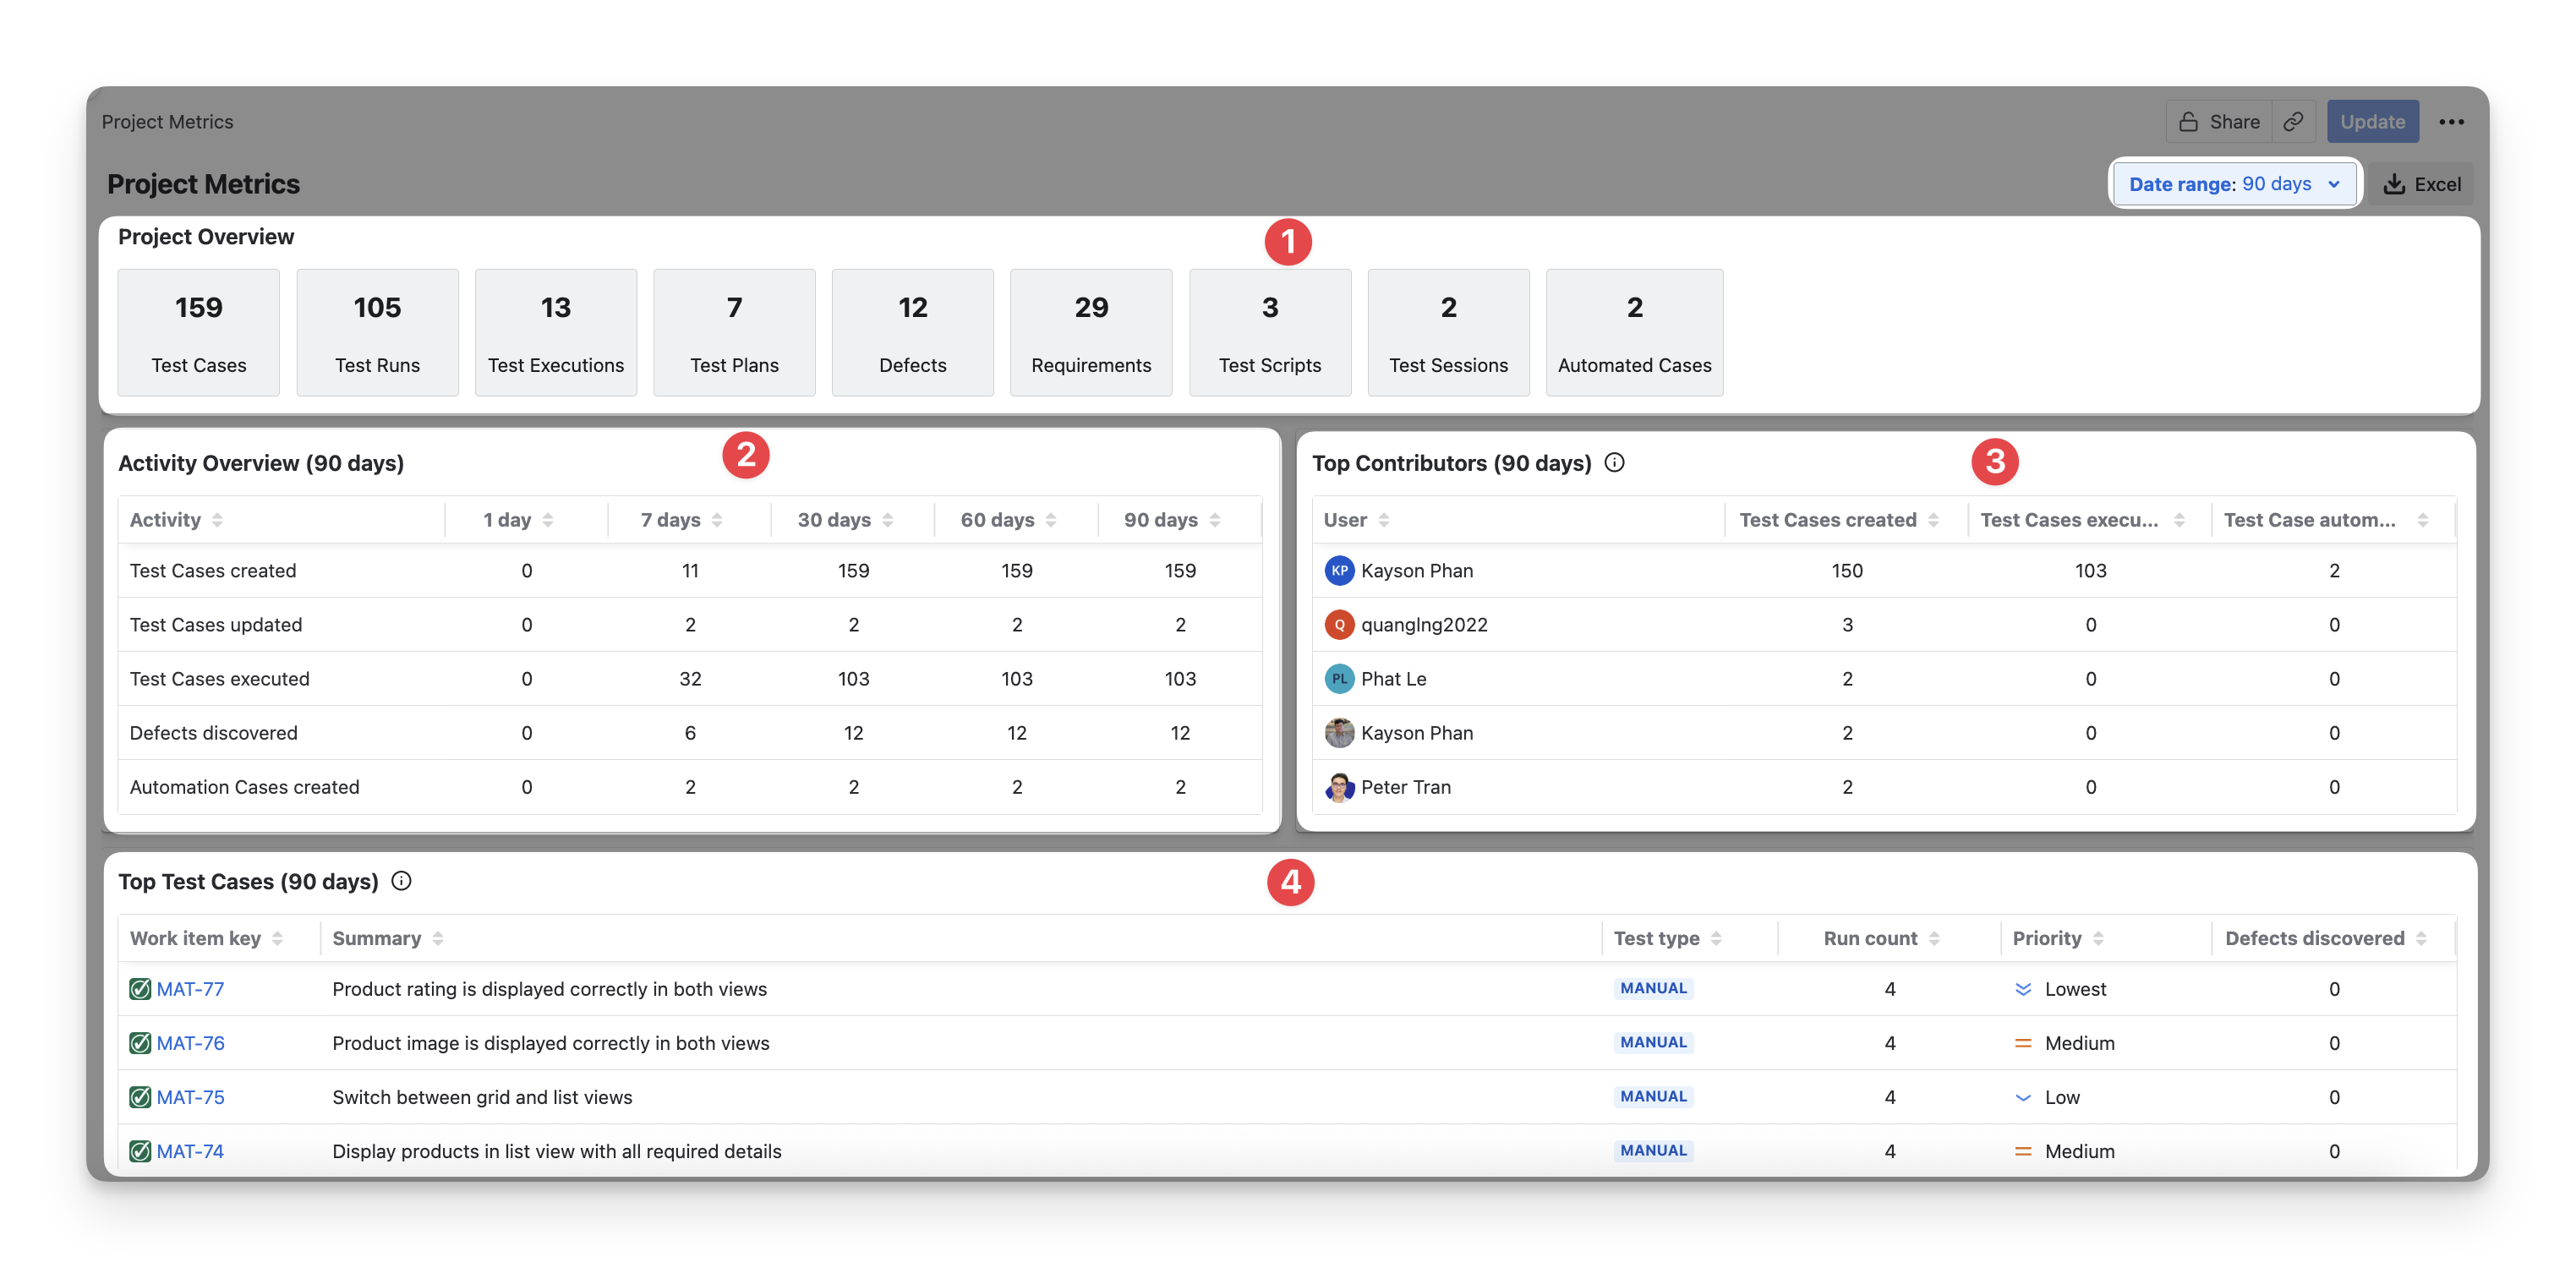
In each Project Metrics Report, you will see 4 main sections:
-
Project Overview: A summary of key project metrics, including the total number of test cases, executions, test plans, and defects, providing a quick snapshot of the project's testing progress based on your selected time range.
-
Activity Overview: A table displaying testing activities for both manual and automated test cases, broken down over different time frames, allowing teams to track progress and trends.
-
Top Contributors: A table listing team members along with the number of test cases they have created and executed, showcasing individual contributions to the project in your time range.
-
Top Test Cases: A table featuring the most run test cases, along with associated defect information, offering insights into the test cases that are most critical to the project's quality in your selected time range.
1. Project Overview
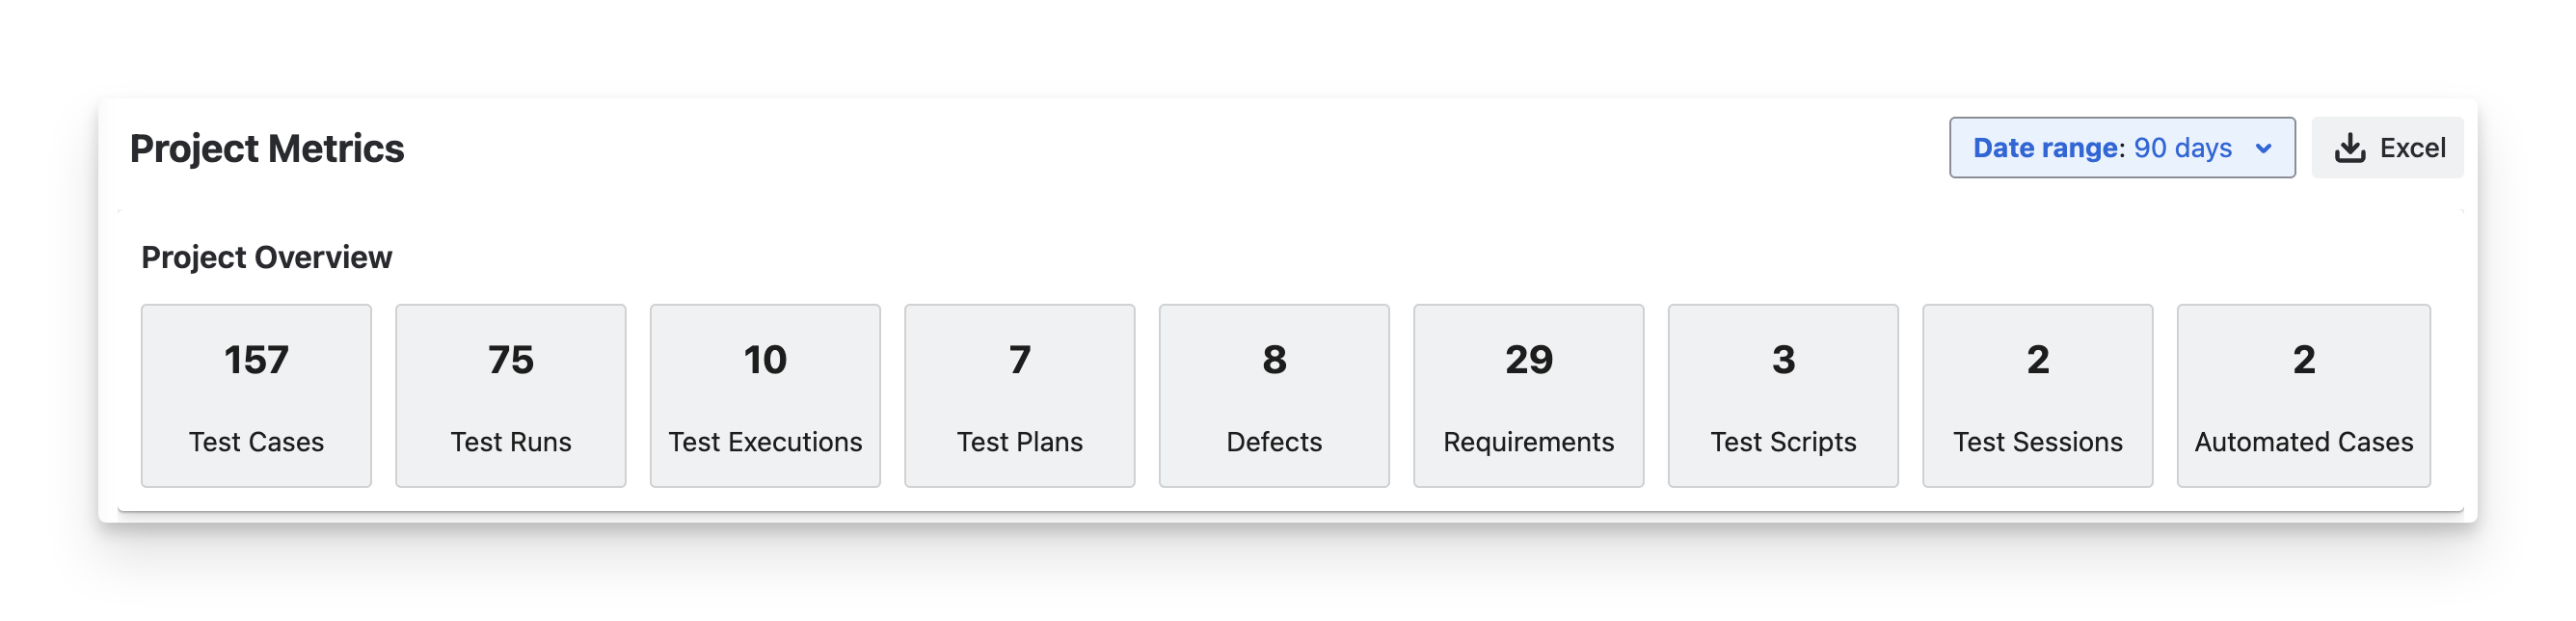
The Project Overview section provides a high-level summary of the key metrics for your project. Here’s a breakdown explanation of each item
-
Test Cases: total number of test cases created in your project of all types ( Manual ; Cucumber ; Generic ), both Classic and automated tests.
-
Test Runs: total runs of test cases in your project. This is calculated by adding together the number of test case from all test executions within the project.
-
Test Executions: total number of test executions of your project.
-
Test Plans: total number of test plans in your project.
-
Defects: total number of defects linked to any test case or test step in your project.
-
Requirements: total number of requirements created in your project.
-
Test Scripts: total number of test scripts created in your project.
-
Test Sessions: total number of test sessions created in your project.
-
Automated Cases: total number of test cases with the Automation source.
2. Activity Overview
The Activity Overview table displays the testing activities performed in the project over different time ranges (1 day, 7 days, 30 days, 60 days, and 90 days). The table will display columns up to the time range you select.
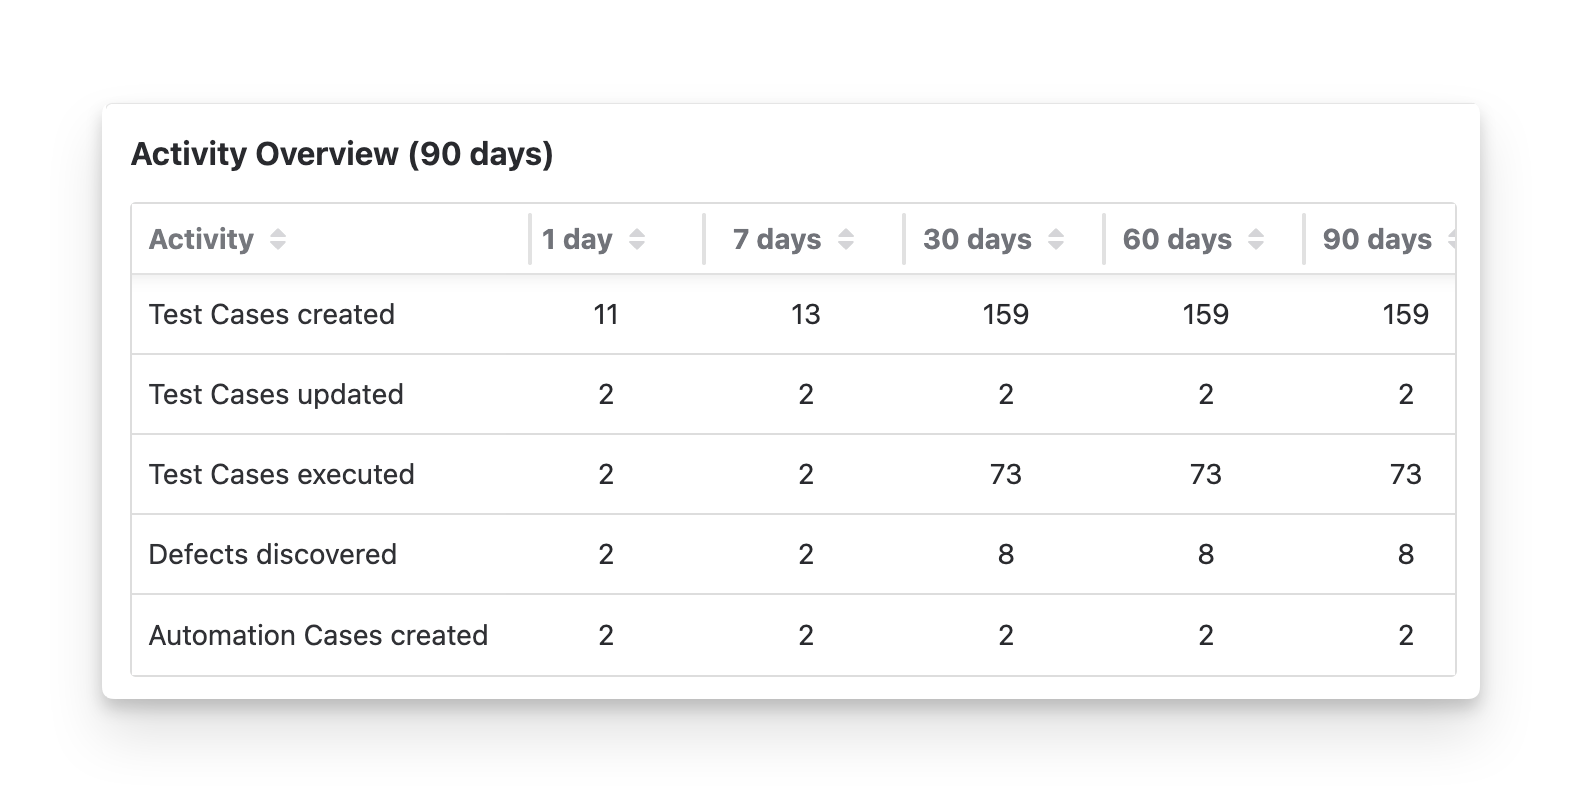
Each row represents a type of activity:
-
Test Cases created: The number of new test cases created, both classic and automated, during the selected time periods.
-
Test Cases updated: The number of existing test cases that were updated in the Details tab. Other changes in Jira fields are not included in this count.
-
Test Cases executed: The number of test cases that were executed within the selected time ranges.
-
Defects discovered: The number of new defects created during your testing activities.
-
Automation Cases created: The number of automated test cases created during the selected time periods.
3. Top Contributor
The Top Contributor table highlights the team members who contributed the most to testing activities.
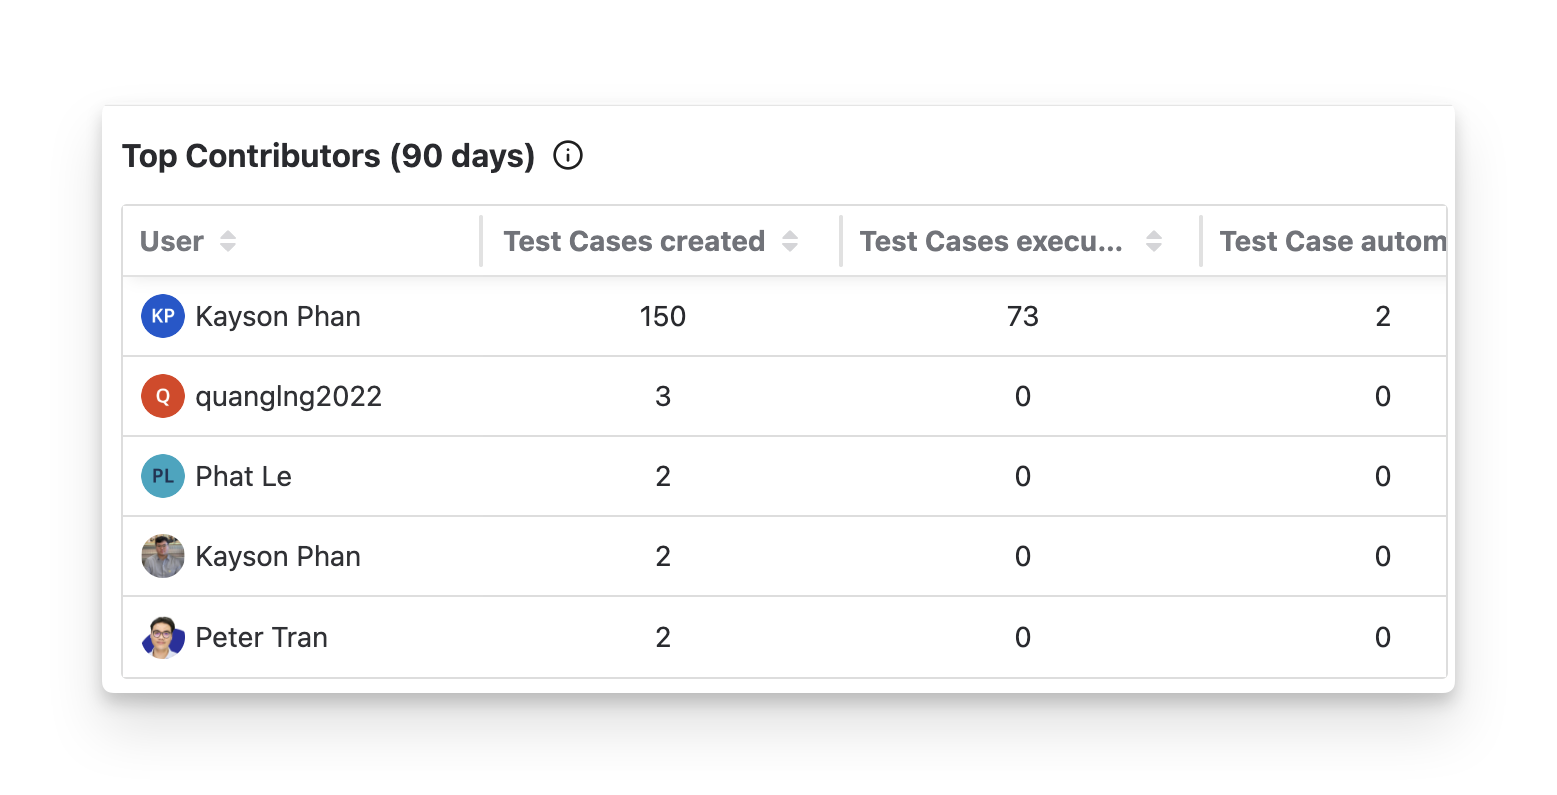
Users are ranked based on a contribution score, which is calculated by combining these three activities. Each activity contributes equally to the score.
Contribution Score Formula:

In which:
-
Test Cases Created: The number of test cases the user created, both Classic and automated tests.
-
Test Cases Executed: The number of test cases the user executed.
-
Test Cases Automated: The number of automated test cases this user has created.
If multiple users have the same contribution score, their ranking will be determined by the time they performed the activities. Users who completed these actions earlier will appear higher in the ranking.
4. Top Test Cases
The Top Test Cases table highlights the test cases that have the most impact during the selected time range. Each row displays key information about the test case, including the work item key, summary, test type, run count, priority, and the number of defects discovered.
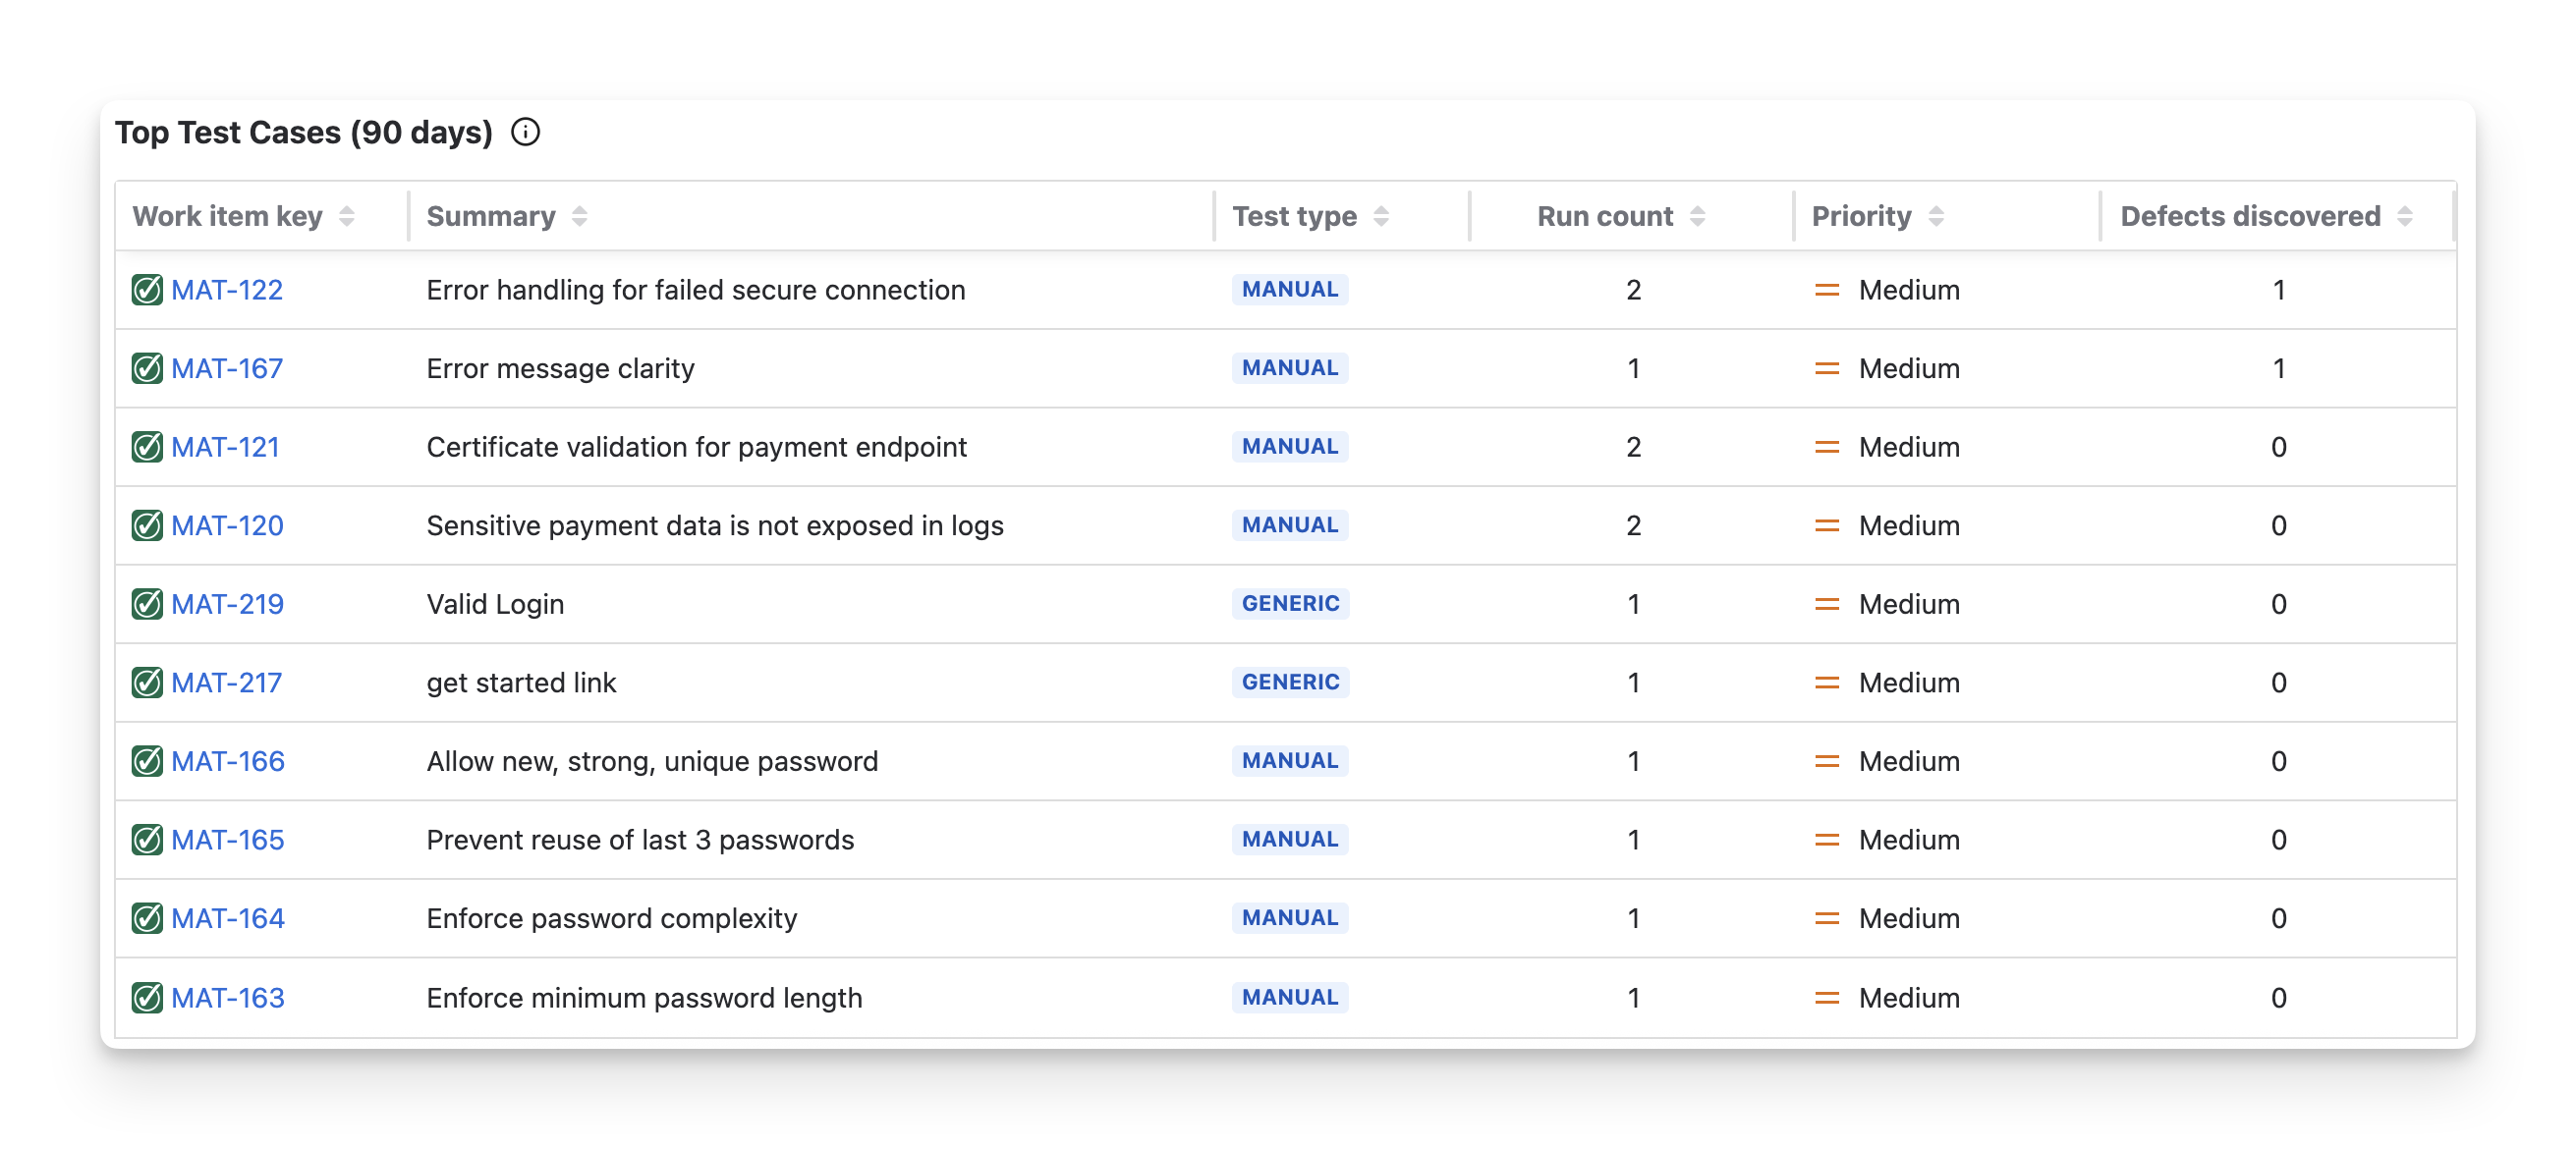
Test cases are ranked based on a test case impact score, which is calculated by combining the number of times the test case was executed and the number of defects discovered from it
Test Case Impact Score Formula:

In which:
-
Run Count: The number of times the test case was executed.
-
Defects Discovered: The number of new defects created and linked to this test case or its test steps as a result of executions.
If multiple test cases have the same score, they will be ranked based on their Jira issue key in ascending order.
5. Save, Share & Export Report
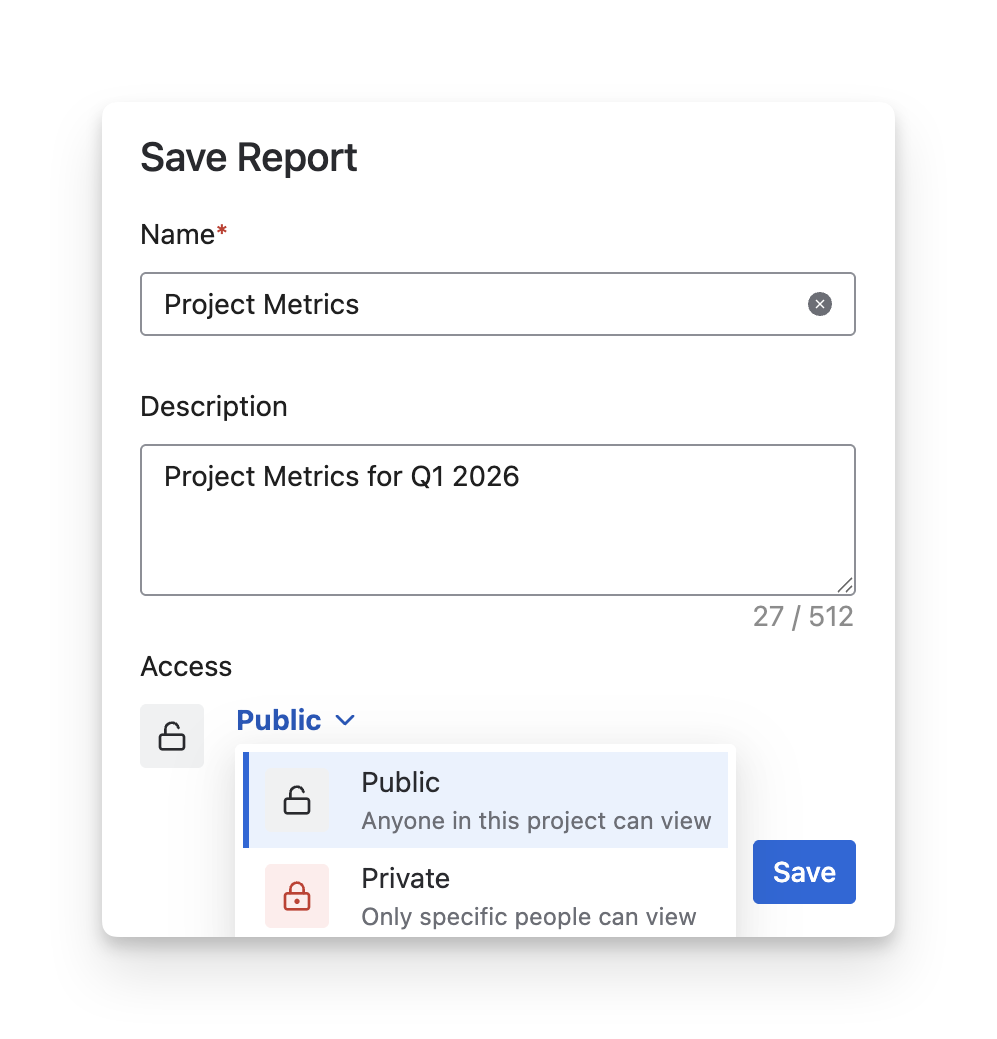
After modifying the Project Metrics Report, click the Save button. When you reopen the report, your settings will restore automatically, so you won’t need to configure it again.
Set the report's accessibility:
-
Choose Private to restrict viewing to some members.
-
Choose Public to allow all members to view the result.
To download the Project Metrics report, click the Export button. AgileTest lets you export this report as Excel files, including all content displayed.
Should you need any assistance or further AgileTest inquiries, contact our 24/7 Support Desk.