.png)
1. Overview
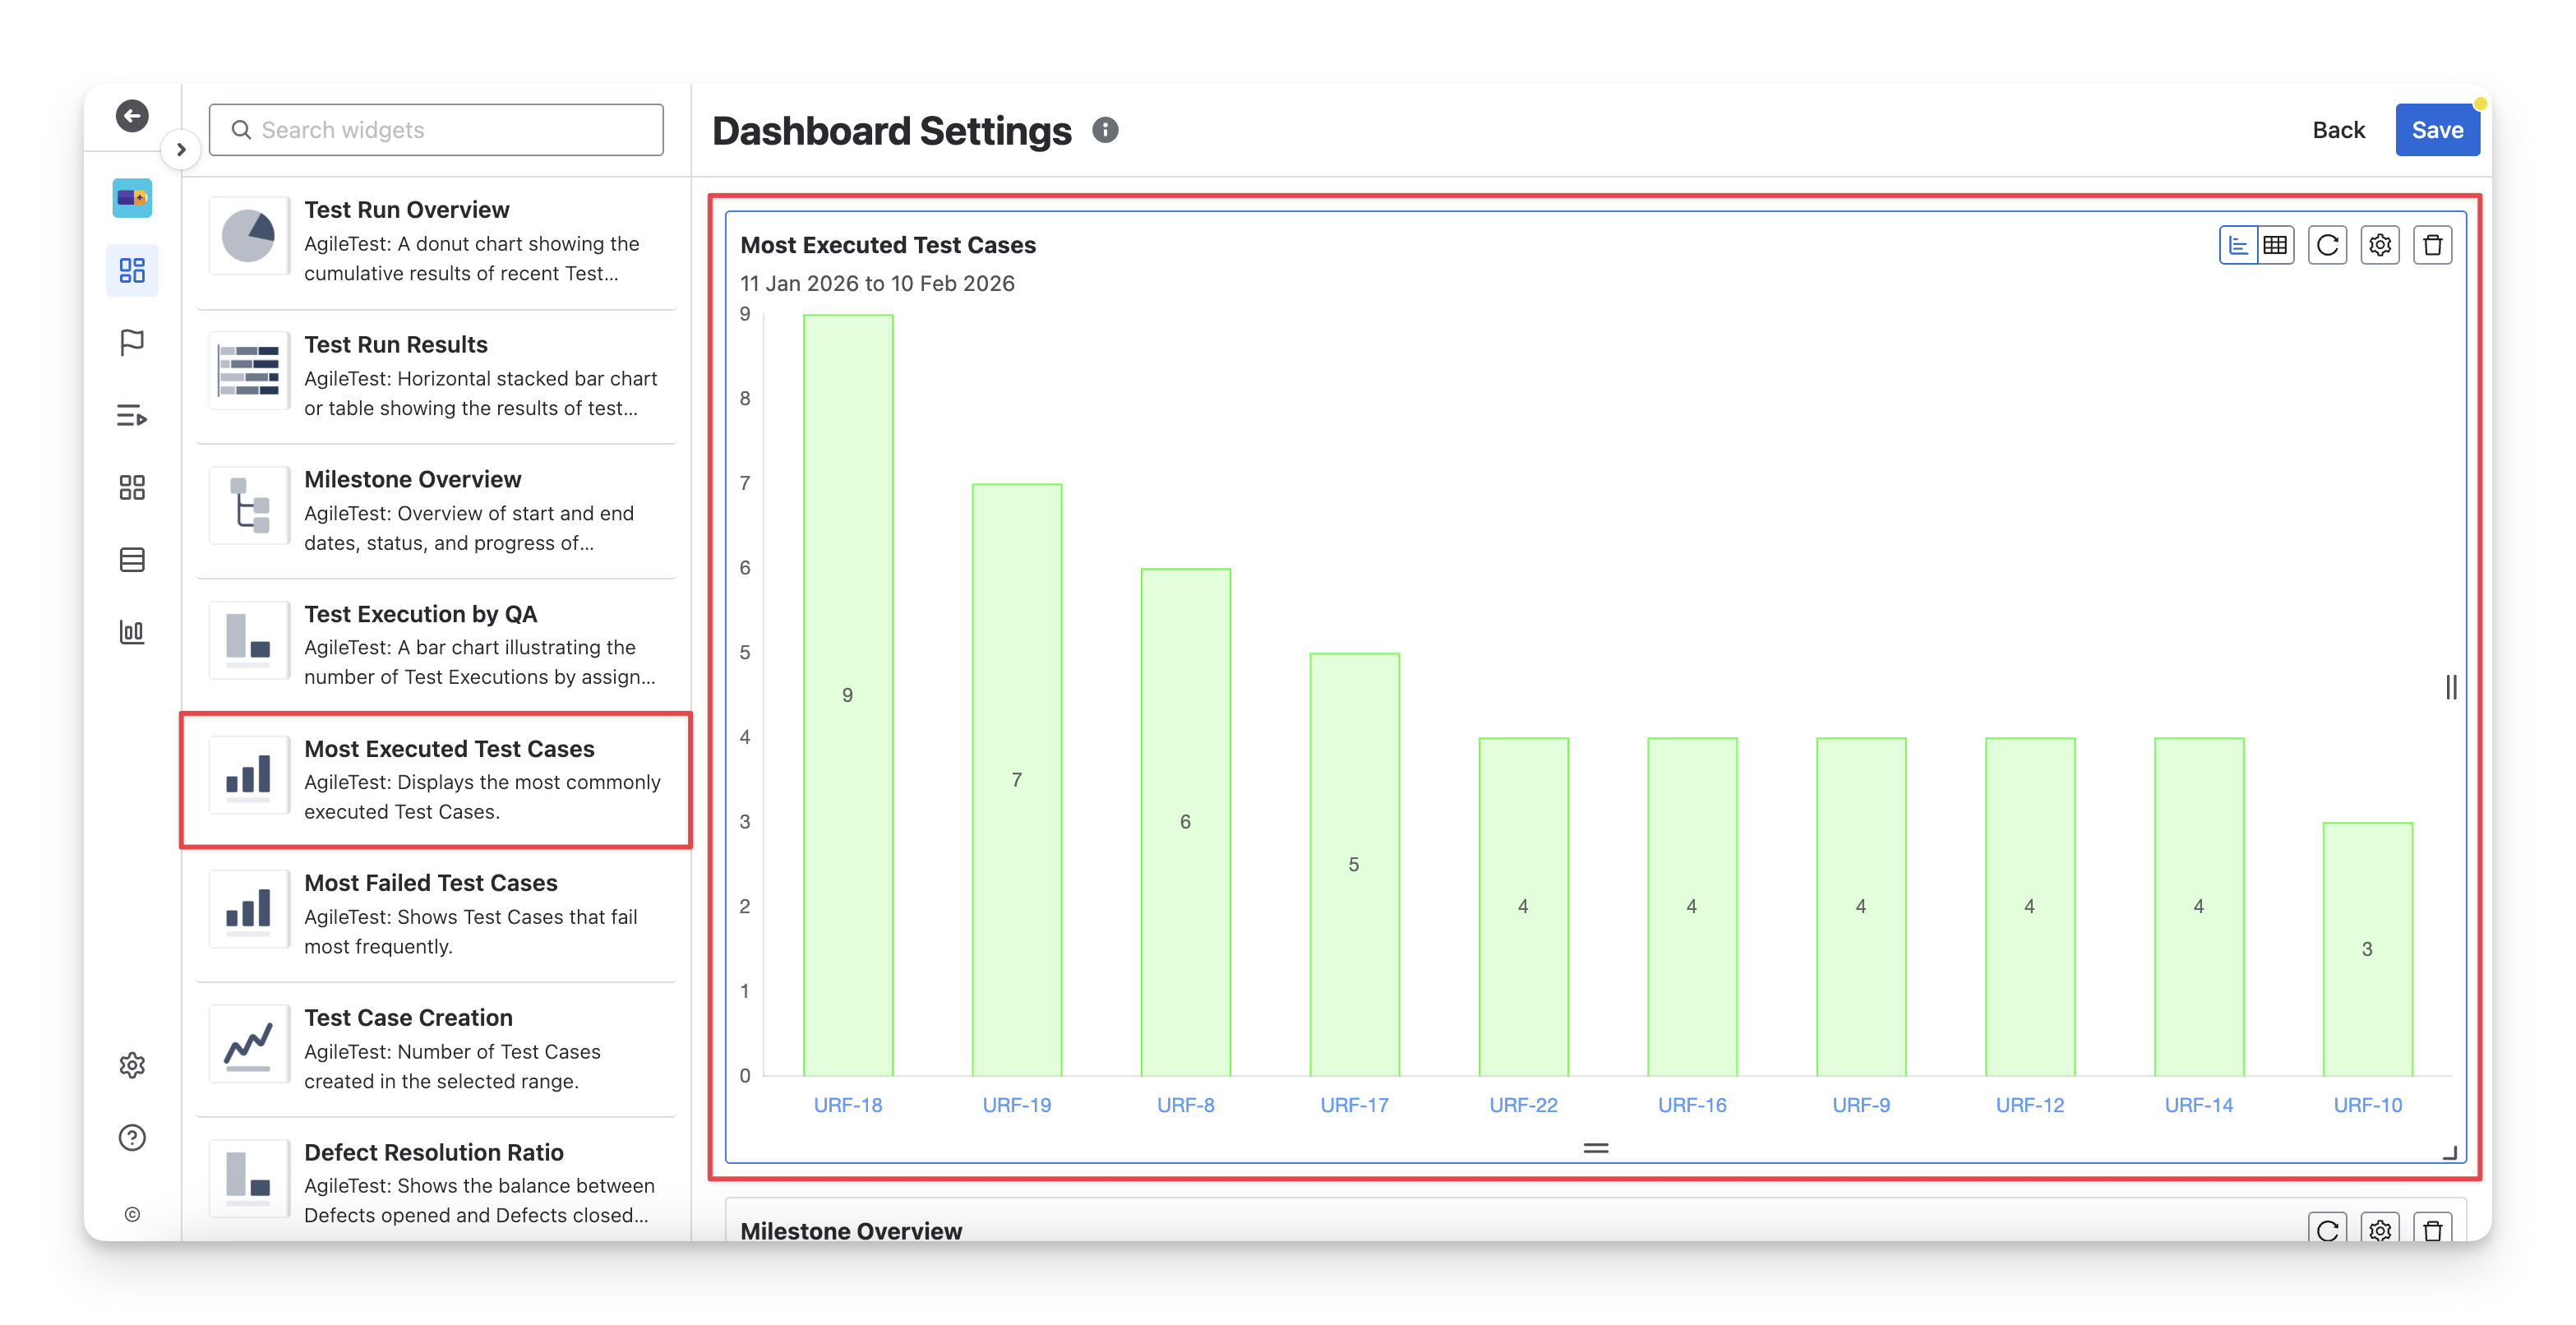
The Most Executed Test Cases widget is suitable for QA teams to identify which test cases are being executed most frequently within a selected time range. By visualizing execution counts per test case, it highlights areas of the product that receive the most testing attention.
This widget has 2 display formats: chart and table. You can switch between these two formats by clicking on the “Switch format” button.
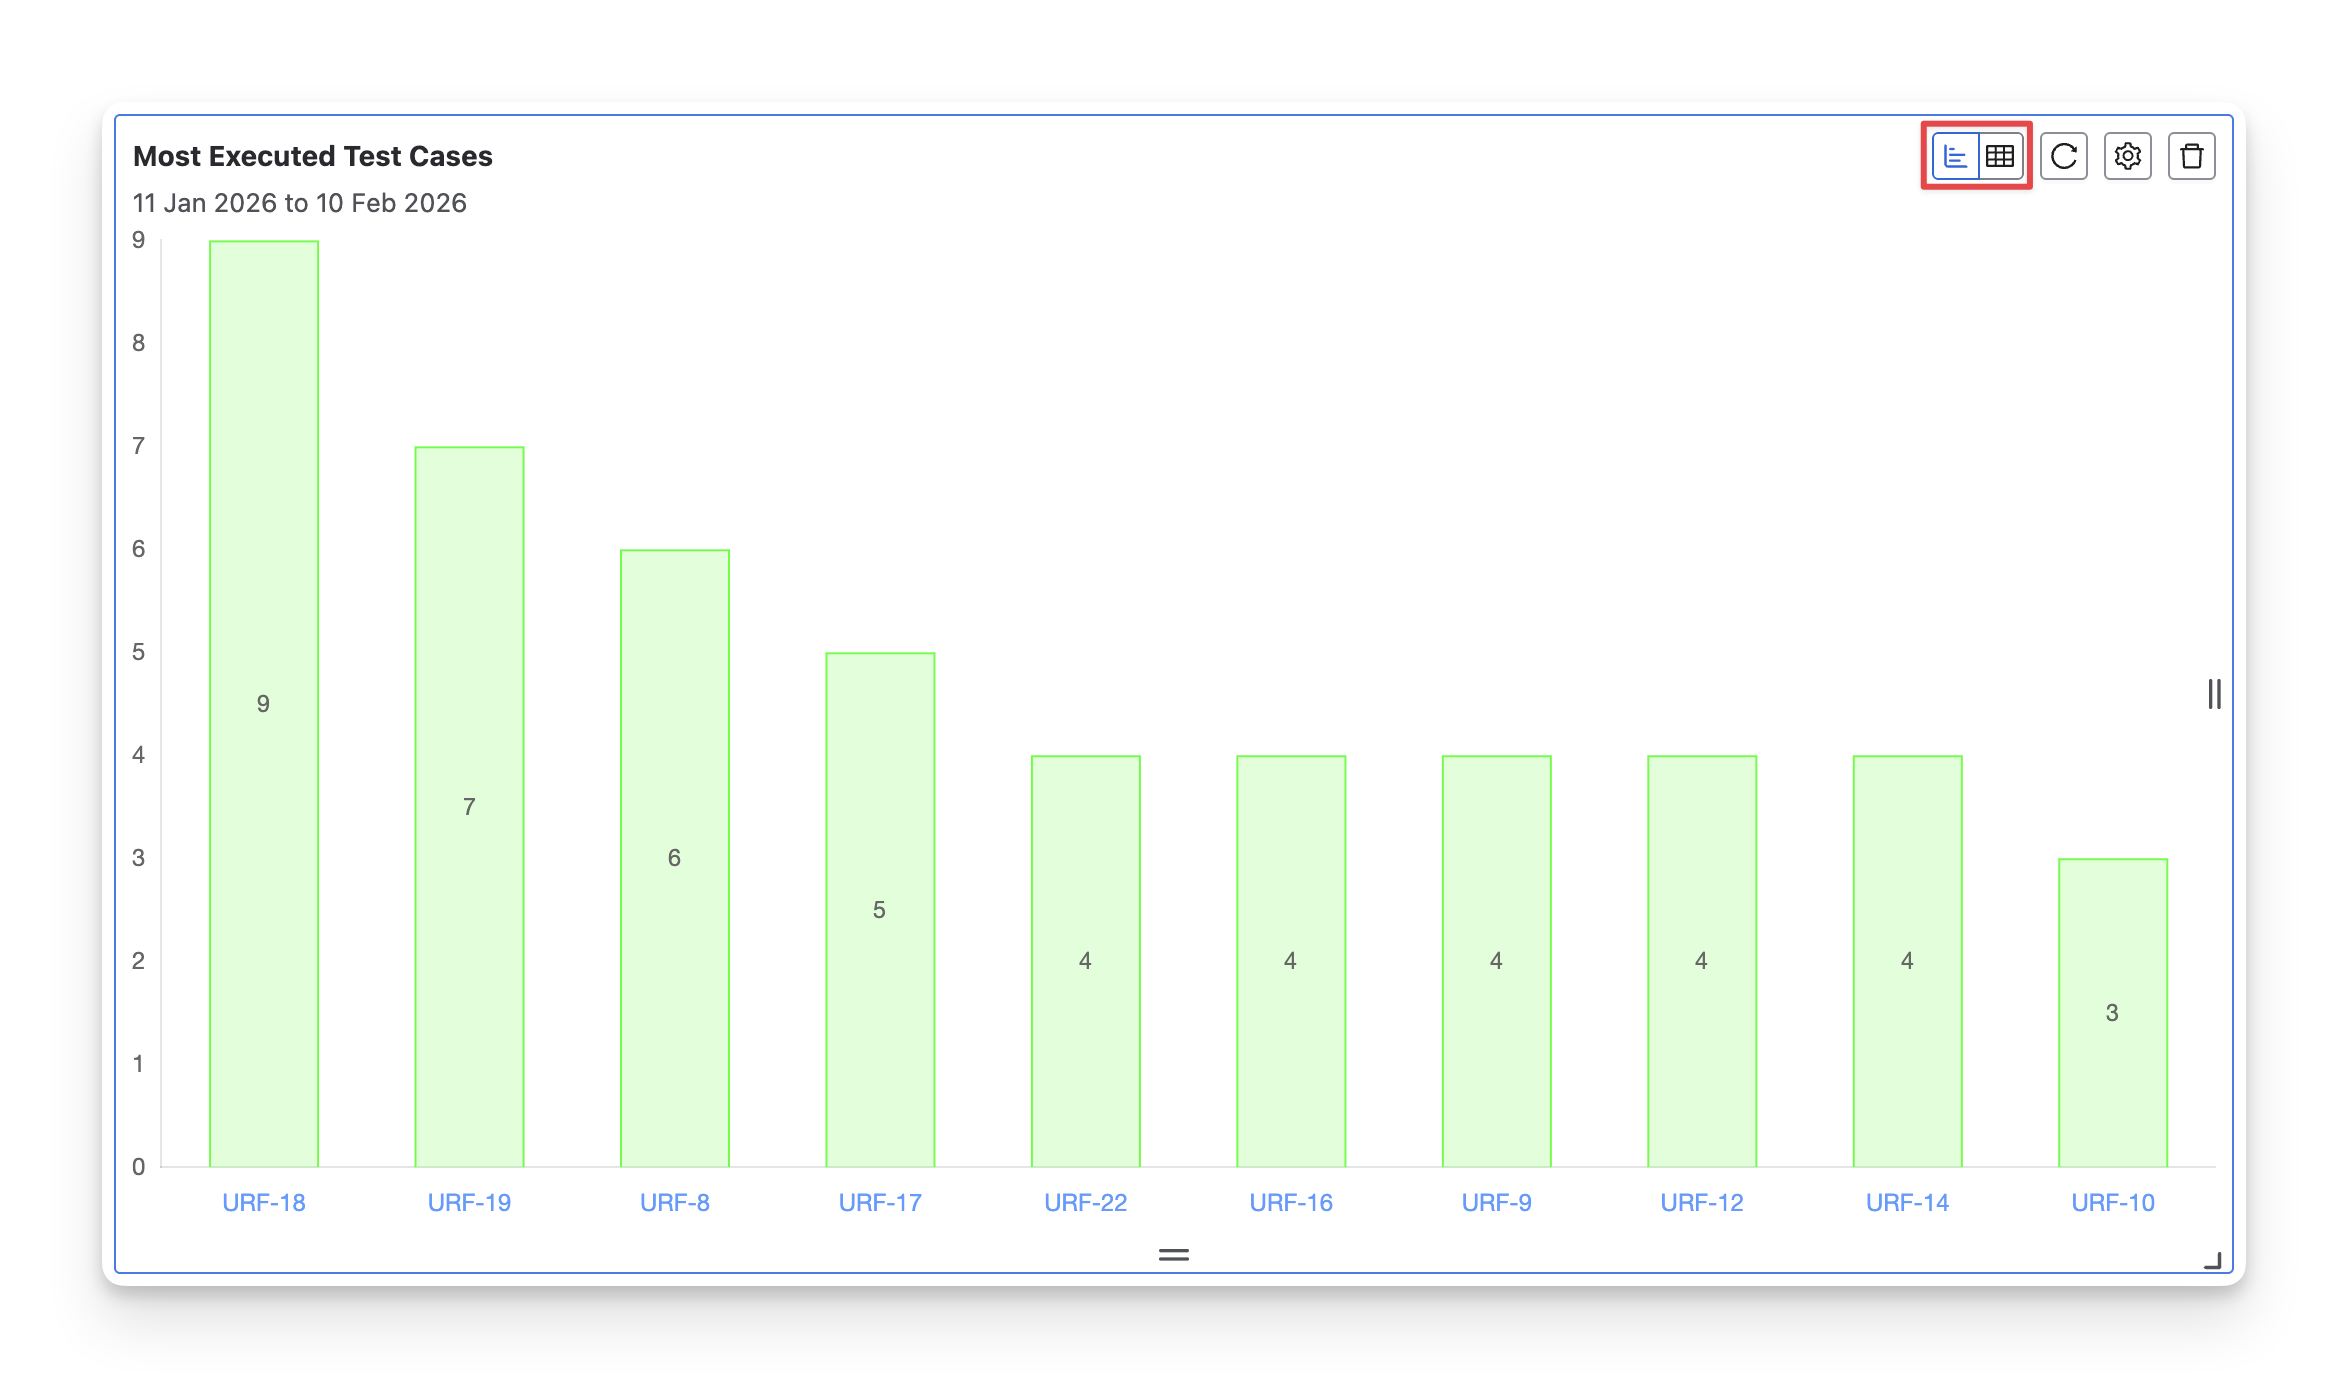
1.1 Chart Format
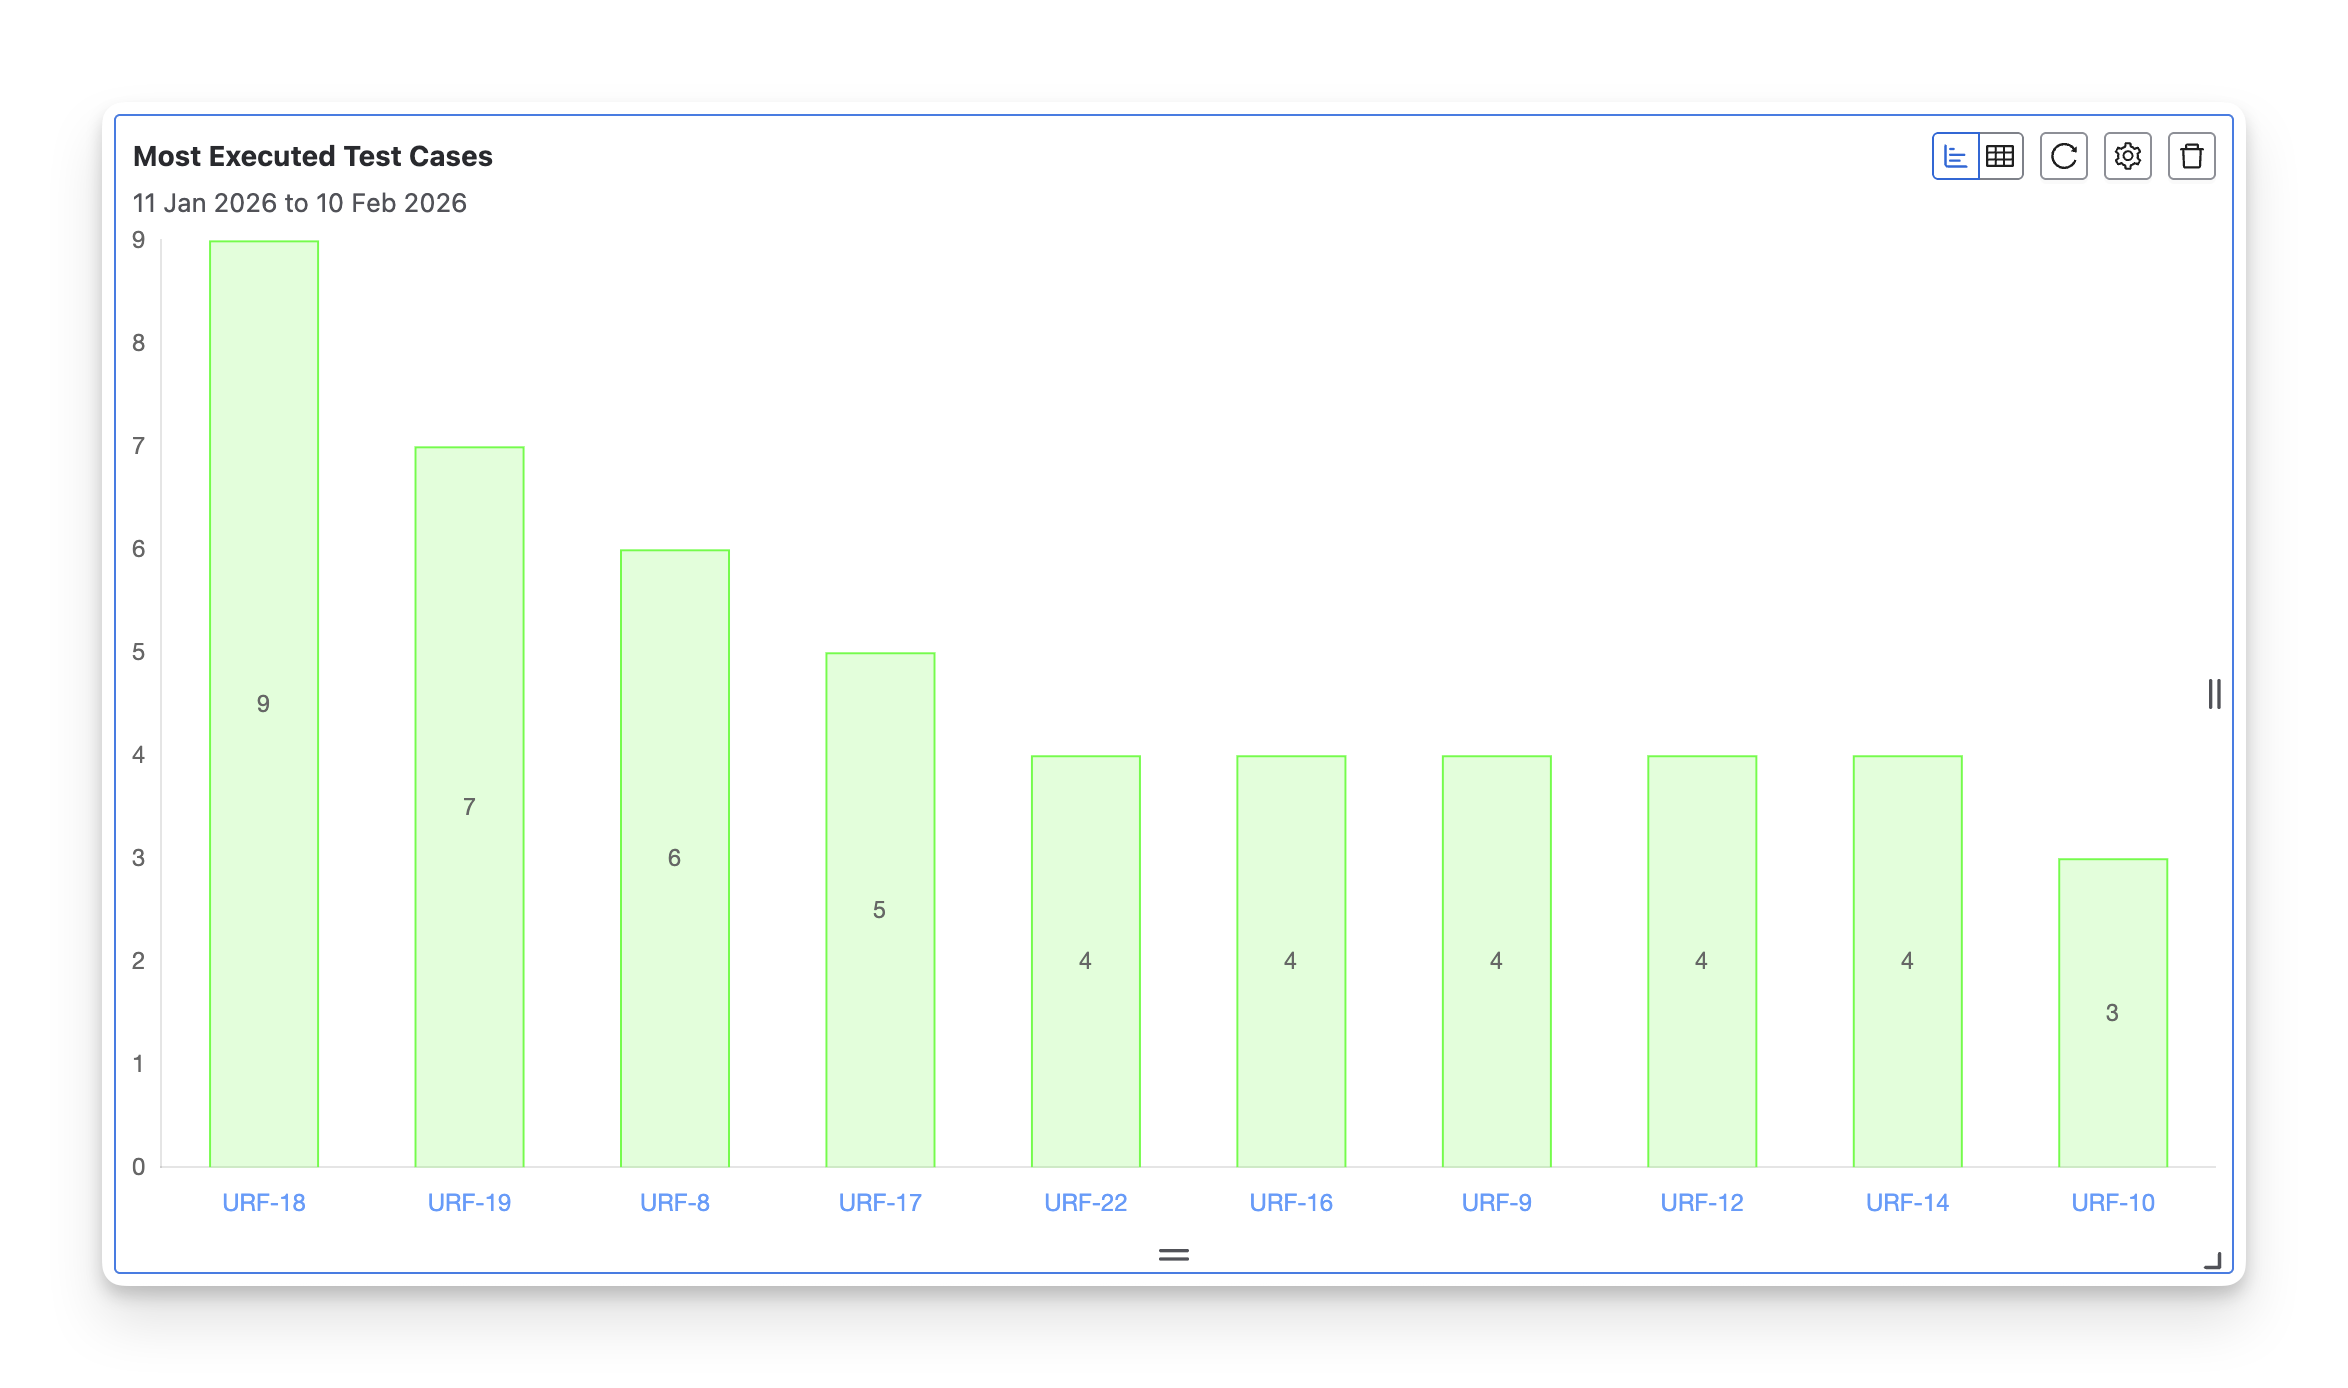
The Most Executed Test Cases chart visualizes test cases based on how frequently they are executed within the selected time range. Each bar represents a test case, and its height shows the total number of executions.
This format is particularly useful when QA teams need to:
-
Identify high-risk or unstable areas: Frequently executed test cases often indicate features that are critical or prone to regression.
-
Communicate insights quickly: Use the visual chart in internal reports or reviews to show where testing effort is concentrated.
1.2 Table Format
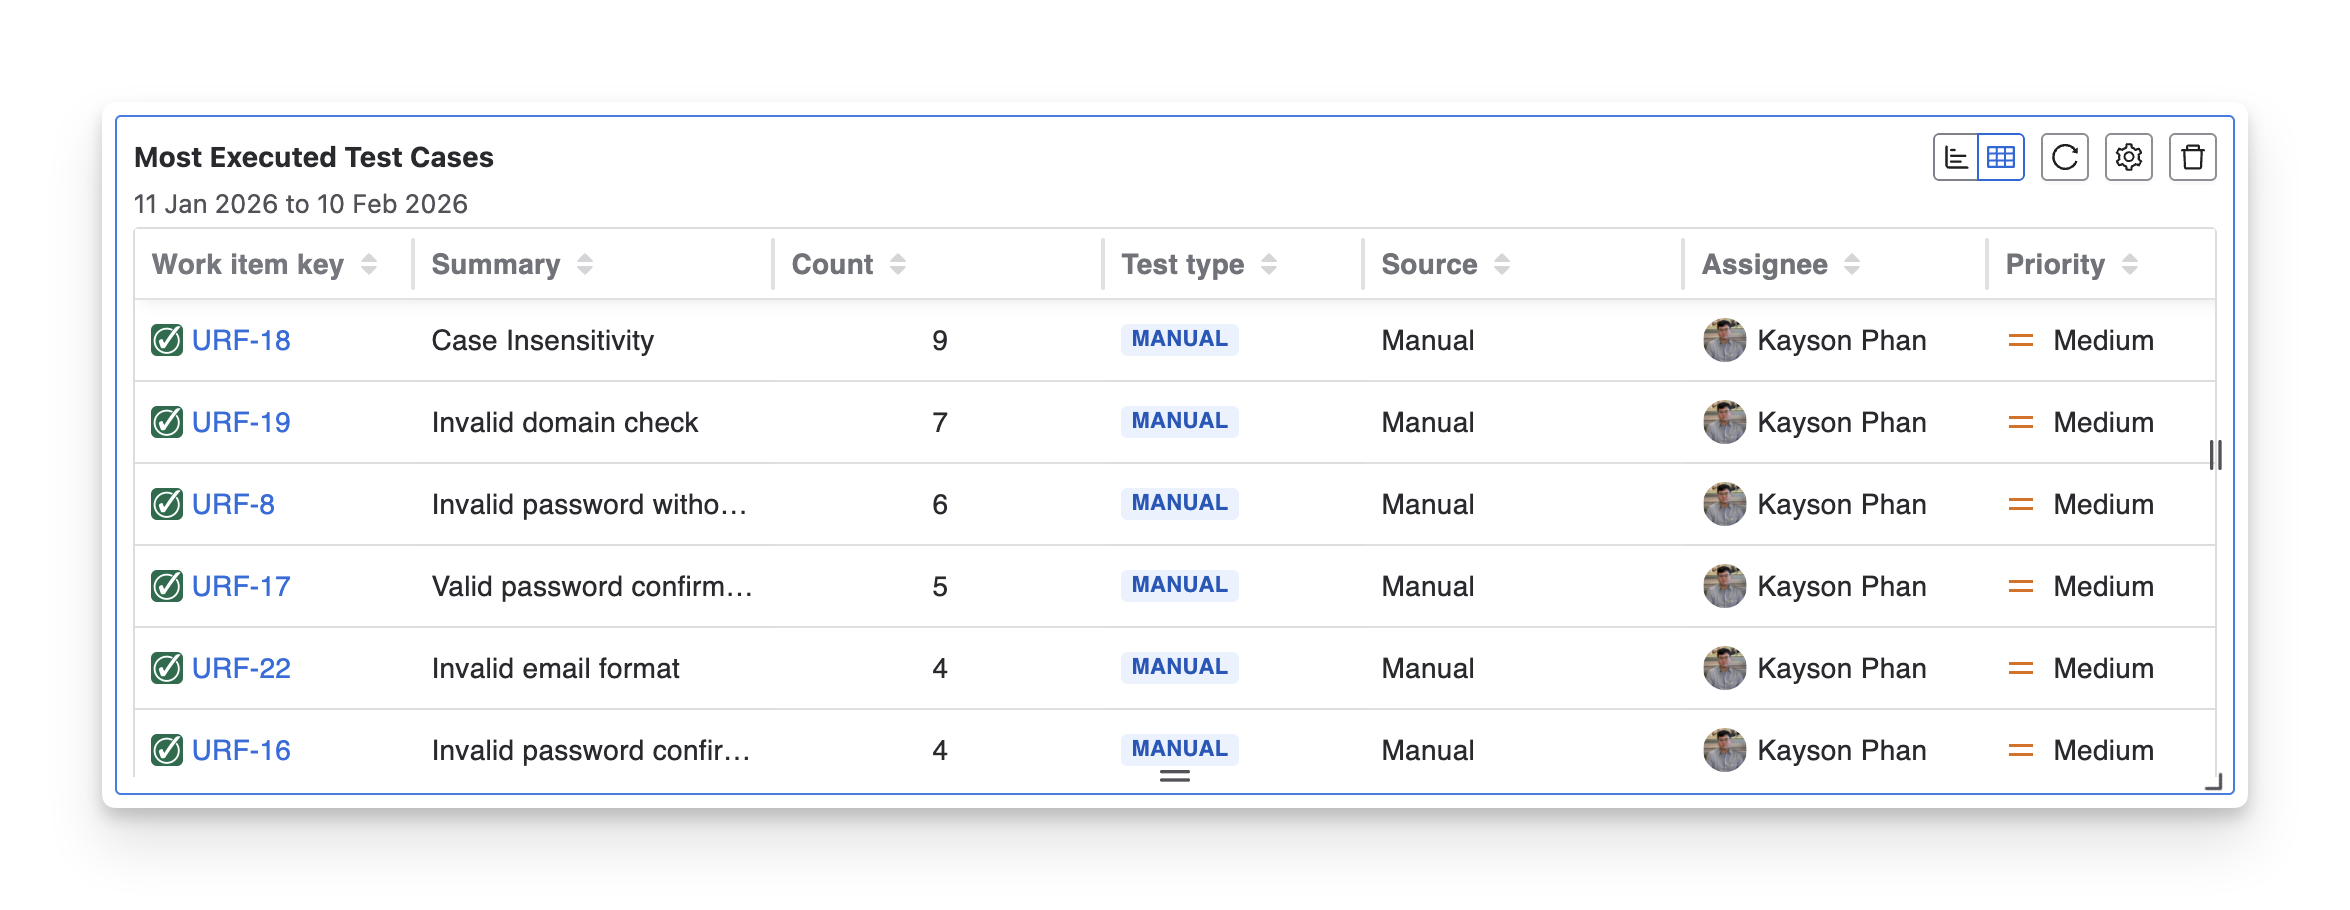
The Most Executed Test Cases table provides a detailed breakdown of the most executed test cases. Each row represents a single test case, showing how often it has been executed and key related details, including execution count, test type, source, assignee, priority, reporter, last updated time, and created date.
This format is particularly useful when QA teams need to:
-
Track execution details: Understand who is running the tests, how often, and whether they are manual or automated.
-
Analyze root-cause analysis: Compare execution frequency with priority and summary to decide whether the test design or product behavior needs improvement.
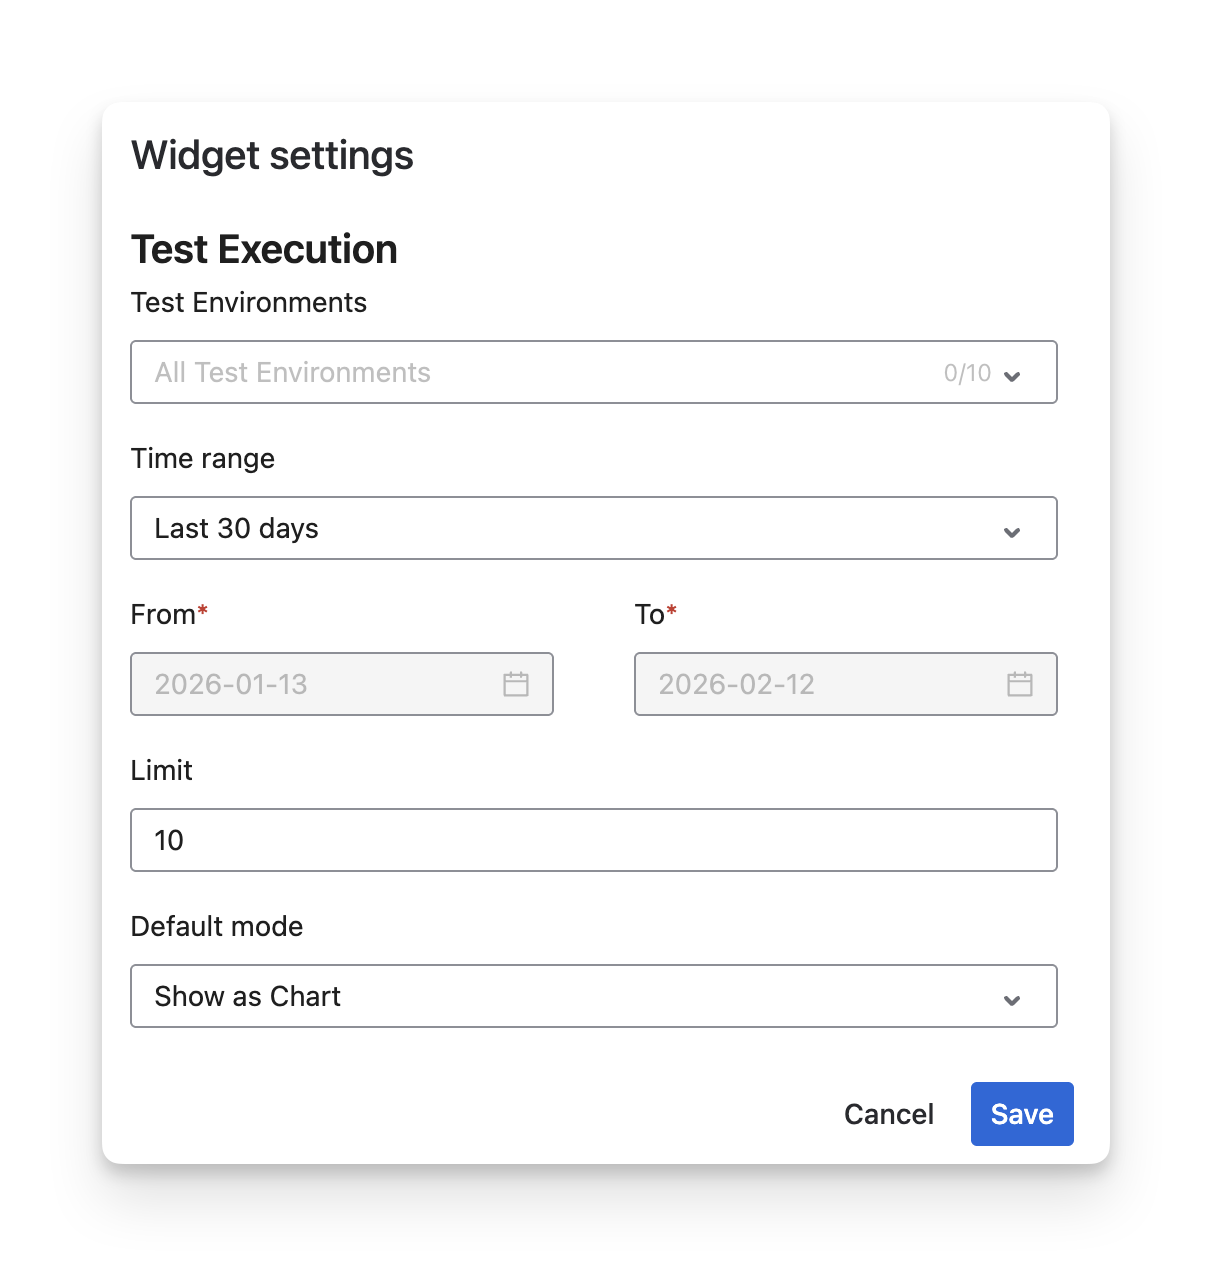
2. Configurations
With this widget, you can:
-
Rename the widget to match your reporting purpose
-
Filter test cases by priority to focus on critical or high-risk test coverage.
-
Filter by test environments (up to 10) to analyze execution activity across specific platforms.
-
Select a time range using presets or define a custom From–To date range to control the reporting period.
-
Set a limit to define how many top executed test cases are displayed (up to 20).
-
Choose the default display mode (Chart or Table) depending on whether you prefer a visual summary or detailed data.
Should you need any assistance or further AgileTest inquiries, contact our 24/7 Support Desk!